Banque centrale du Luxembourg 2, boulevard Royal L-2986 Luxembourg Central téléphonique: (+352) 4774-1 Télécopie: (+352) 4774-4901 E-mail: sg@bcl.lu
STOCK MARKET VALUATION OF OLD AND NEW ECONOMY FIRMS*
by Patrick Lünnemann**
Abstract
Though stock prices are commonly not considered an integral part of central banks’ monetary policy strategy, financial asset prices are highly relevant because they exert important impacts on inflation, on the real sphere of the economy, and on the financial system. This paper illustrates the evolution of selected primary and secondary equity markets and elaborates divergences and similarities between the pricing of old and new economy stocks. It is shown that the valuation of new economy stocks is subject to enhanced contingency. Prices of new economy stocks ceteris paribus react more sensitively to new information and modifications to external assumptions. From both a microeconomic as well as a macroeconomic point of view, the growth projections implicit in price earnings ratios observed in recent years seem unrealistic. Furthermore, from a utility maximising perspective, it seems unlikely that the observed shift in investment away from old economy stocks and into new economy stocks could have been achievable without a change in the aggregate risk preference. Panel regression analysis based on 219 EURO STOXX firms, though, confirms a significant impact of firm-specific and macroeconomic fundamentals on monthly returns for old economy companies as well as for telecommunication, media and technology (TMT) firms. The null-hypothesis of no statistically significant difference between TMT firms and non-TMT firms with respect to the role of firm-specific and macroeconomic fundamentals in explaining monthly stock returns is rejected. While theoretical considerations and empirical findings suggest that the monetary policy stance remains an important factor driving equity valuation, the growing passion for stocks and the more volatile pricing of new economy stocks bear important implications for central bank policy making.
* Opinions expressed in this paper are personal opinions and do not necessarily reflect those of the Banque centrale du Luxembourg. I owe a special debt to my colleague Jean-Paul Bever who prepared detailed comments and comprehensive suggestions and I have enjoyed and benefited from his most competent and dedicated assistance in various areas. I would like to thank Jean-Marie Azzolin (Banque Générale du Luxembourg), Yves Bodson (Banque et Caisse d’Epargne de l’Etat), Léon Kirch (Banque de Luxembourg), Roland Werdel (Banque et Caisse d’Epargne de l’Etat), and many other colleagues from the Banque centrale du Luxembourg for their advice and expertise. All remaining errors are mine. ** Monetary Affairs, Economic Analysis and Statistics Department
Table of contents
Page
1. Central banks and stock markets: an introduction...7
2. Peculiarities of new economy firms...9
2.1 Specific characteristics of new economy firms...9
2.1.1 The field of activity...9
2.1.2 The business model...11
2.2 What makes the valuation of new economy firms so special?...11
3. On the evolution of stock markets from 1997 to 2001...15
3.1 The evolution of composite indices...15
3.2 The evolution of index components...15
3.3 Correlation between the United States and the euro area: the industrial and the telecommunication sector...16
3.4 Descriptive evidence from firm-level data...18
3.4.1 EURO STOXX companies...18
3.4.2 A comparison with "genuine new economy firms"...19
3.5 On the evolution of price earnings ratios...22
3.6 The primary market...23
4. On the plausibility of the recent valuation of equity...26
4.1 The evolution of earnings and dividends...26
4.2 On the sensitivity of high growth stocks' price earnings ratios to growth expectations and inflation...28
4.3 On the plausibility of recent price earnings ratios...33
4.3.1 Microeconomic aspects...33
4.3.2 Macroeconomic aspects...36
5. Did preferences of equity investors change? ...38
6. Stock prices and fundamentals...42
7. Implications for central banking and conclusion...48
List of figures
Page
Figure 1: The share of high-tech segments in the NEMAX ALL SHARE index [%]...10
Figure 2: Changes in telecommunication and industrial stock prices: correlation between the euro area and the US...17
Figure 3: Key indicators of monthly stock returns by EURO STOXX sector ...18
Figure 4: Intraday spread and daily returns for TMT and non-TMT stocks...19
Figure 5: Average and standard deviation of monthly returns...20
Figure 6: The distribution of returns: former state-governed companies (LHS) and "genuine new economy firms" (RHS) in the telecommunication sector [%] ...21
Figure 7: Daily returns and intraday spread: former state-governed companies and "genuine new economy firms" in the telecommunication sector ...21
Figure 8: PE ratios for S&P500 and NASDAQ computer stocks...22
Figure 9: The secondary market versus the primary market...23
Figure 10: Initial returns on IPOs and the relative position of the subscription price ...24
Figure 11: Dividend yields (LHS, [%]) and dividend growth from 1998 to 2001 by EURO STOXX sector (RHS, 1998 = 100) ...28
Figure 12: Normal market PE ratio according to the constant growth dividend discount model ...29
Figure 13: The impact of a 20 % decrease in earnings growth on the normal market PE ratio [%]...30
Figure 14: Implicit growth assumptions for NASDAQ computer and EURO STOXX media stocks [%]...35
Figure 15: Growth expectations implicit in EURO STOXX PE ratios and the implicit shift in the profit share in nominal GDP...36
Figure 16: Investor indifference curves by risk aversion parameter...39
Figure 17: Optimum share of portfolio investment in the old economy (DAX) as a function of the risk aversion parameter ...40
Figure 18: The risk aversion parameter implicit in an equivocal portfolio allocation between the DAX and the NEMAX...41
1. See, for example, European Central Bank (2000). 2. See, for example, Jalava (2001) and Lee (2001).
1
Central banks and stock markets:
an introduction
Few expressions have been hyped as much as the new economy has been recently. Still, the concept of the new economy phenomenon remains nebulous. Commonly, economists focus on the achievements of the US economy throughout the second half of the 90’s, namely the simultaneous robust and exceptional economic growth and sustained remarkably modest price acceleration. Though the uncertainty applies to its driving forces as well, the emergence of a new economy is commonly considered a result of the confluence of advances in information and communications technology (ICT), improved macroeconomic management (both fiscal and monetary) and international elements (e.g., globalisation, economic activity abroad, foreign exchange), where pride of place is commonly going to the ICT revolution.1 Contrary to
numerous studies on the new economy2, this document is not to assess the
emergence of “higher speed limits”. Instead, the aim of the document is:
i) To describe what makes the pricing of new economy stocks so special (section 2).
ii) To illustrate the rapid rise in equity prices, notably among new economy stocks, which accompanied the emergence of the so-called new economy phenomenon and to investigate its plausibility from a microeconomic and a macroeconomic perspective (sections 3 and 4).
iii) To investigate whether the aggregate risk preference of equity investors has been subject to change and to discuss the role of fundamentals in explaining equity returns in recent years (sections 5 and 6).
iv) To elaborate implications of recent stock market trends for central bank policy (section 7).
Though stock prices are commonly not considered an integral part of central banks’ monetary policy strategy, financial asset prices are highly relevant because they exert important impacts on inflation, on the real economy, and on the financial system. Final demand, for example, is affected through both demand for consumption and demand for investment.
As for consumption, economic theory provides three main impacting channels. First, increases in financial asset prices are generally considered an increase in permanent income which, according to Friedman, translates into augmented private consumption (“wealth effect”). Second, Friedman’s permanent income theory states that, in deciding on individual consumption, economic agents rely on their expected permanent income. Thus, once changes in equity prices incite agents to modify their expectations with respect to income generated by non-equity wealth, even consumption behaviour of non-non-equity holders may change.
Third, changes in financial asset prices affect the borrowing capacity of households. If the latter drops, households will readapt their portfolio by reducing current consumption and increasing savings.
Investment demand of non-financial firms, too, may be affected via three channels. First, decreasing equity prices may imply a reduction of Tobin’s q (i.e., stock market valuation of a given company over its existing net capital stock), thereby rendering new capital more expensive relative to the stock existing.3
Second, investment activity could suffer from decreasing equity prices according to the flexible accelerator theory.4 When coupled to the multiplier concept,
changes in investment may bring about a more than proportional change in production. Third, decreasing stock market prices imply a reduction of the net value of firms and renders credit-taking more expensive and difficult.
Another important transmission channel from financial asset prices to the real economy runs through balance sheets of financial institutions. In a direct way, a harsh downward correction of stock prices would deteriorate balance sheets within the banking sector and reduce banks’ lending capacity. Furthermore, rapidly shrinking asset prices may impact on the real sphere in an indirect manner by deteriorating the solvency of the private sector in general (through diminishing value of collateral held against loans). Once banks sell such collateral due to clients’ non-ability to match their payment obligations, additional pressure is exerted on asset prices.5
Given that financial markets are highly integrated, the recent sharp fall in equity prices is commonly considered a risk not only for the USA, but for the global economy.6 Finally, the mere anticipation of significantly shrinking equity prices
may render specific currencies less attractive for international investors, thereby affecting underlying capital flows and exchange rates.7 Thus, due to their impact
on central bank information variables, intermediate targets and price stability and given the increasing passion for equity as well as the nature of new economy stocks, central banks are asked to monitor in detail the evolution of stock markets.
3. According to the q theory, firm investment is a function of q. If market capitalisation exceeds the value of the company’s assets, firms are encouraged to invest given that the expected revenue generated by the assets is higher than their costs. Conversely, if q remains below one, a firm is supposed to disinvest. 4. Felderer/Homburg (1994).
5. Putten/Vergnaud (2001).
6. As for the US, according to the OECD, a 20 % decline in equity prices – when coupled to a 4,5 % decrease in marginal consumption propensity – transmits into a 1,2 % decrease in private consumption. This, in turn, would correspond to a 0,6 % reduction in the annual growth rate (Boone/Giorno/Richardson (1998)).
7. From the perspective of the European Central Bank this may be particularly relevant for capital flows from the euro area to the US. According to the FMI, a 20 % reduction in equity prices may reduce the value of the US Dollar relative to the Euro by around one fifth (IMF (2000b)).
2
Peculiarities of new economy firms
2.1 Specific characteristics of new economy firms
2.1.1 The field of activity
In recent years, the valuation of stocks – in particular that issued by new economy firms – has been extensively discussed among the public, researchers and financial market practitioners. Still, there is no unanimous understanding as to what characterises a new economy firm. Two possible properties in characterising new economy firms refer to the field of activity and the business model. With respect to the field of activity, again, there is no unanimity. Whereas some economists analysing macro aspects of the new economy phenomenon consider but the ICT segments 8, others refer to the telecommunication, media
and technology sectors (TMT).9 Financial market institutions and their products
related to the new economy, however, indicate a larger understanding reflecting that some entire stock market indices have become synonyms for the new economy (e.g., the German NEMAX and the US American NASDAQ). The NEMAX, for example, provides as much as nine high-tech sectors (see figure 1). The field of activity constitutes an important property underlying stock market valuation since it is subject to specific assumptions with respect to growth potential, future effective growth rates, corporate pricing power, barriers to market entry, etc. (see box 1).
8. See, for example, Houben/Kakes (2001).
9. In general, the TMT approach embraces the ICT as well as other industries. This approach, however, requires a definition of the technology segment (see, for example, Brierley/Kearns (2001)).
BOX 1: Key properties of selected technology-based sectors 10
Growth projections for the telecommunication sector are bright. Different scenarios apply to the existing business areas within this sector. First, whereas the voice transmission segment may lose pace, data transmission may benefit from rapid growth. Second, mobile and fixed communication may converge in terms of volume and price. One common element across business fields is rapid price erosion.
Potential growth in the media sector is giant due to the basically unlimited range of information provided and the increasing demand for specific information. Marginal cost of production and distribution are exceptionally low. However, barriers to market entry are low and prices subject to rapid erosion.
Growth potential and uncertainty in the software sector are substantial. Connectivity being the focal issue, the potential success may be very high, but strictly limited to a few players. Start-up companies depend essentially on rapid initial growth. Established companies benefit from significant market entry barriers.
The biotechnological product life cycle is different from common product and IT product cycles (slower product obsolescence, longer research and development phases).11 Ultimately,
risks may be binary and subject to ethical and/or legal criteria. In merchandising their products, biotech firms depend on the financing power and the logistics of pharmaceutical multinationals. Similar to the health sector and the IT sector, the biotech sector is subject to narrow markets due to high fixed research and development costs.12
The technology sector is relatively heterogeneous. Firms benefit from strong strategic positioning in well-defined markets and low price pressure. They may be highly dependent on critical components, which only make up a small fraction of their business in terms of value added.
Providers of new financial services face limited possibilities for business expansion. The frequency of financial transactions, in general, is sensitive to the overall market stance. Financial products are highly substitutable implying low corporate pricing power. Market entry barriers are barely existing.
Figure 1: The share of high-tech segments in the NEMAX ALL SHARE Index [%]
Source: Deutsche Börse AG, own calculations. 10. On the following, see, for example, Fraikin (2001). 11. Brierley/Kearns (2001). 12. UBS Warburg (2001). 0 5 10 15 20 25 30 35 40 Biotechnology Financial Serv ices IT Services
Media & Entertainment Medtechn. & Health
Software Technology Telecommunication June 2000 December 2000 June 2001
Industr. & Ind. Services Intern
2.1.2 The business model
The business model may relate to numerous firm properties. Apart from sector-specific elements (such as the upside potential and the term of revenue generation), the characteristics specific to new economy firms, as a baseline, refer to their affinity to innovation, the kind of techniques employed, the source of their know-how as well as the financing sources for research and development activities (see table 1).
Table 1: Selected business model characteristics of old and new economy companies
OLD ECONOMY COMPANIES NEW ECONOMY COMPANIES Relatively conservative Innovative
Use of established Use of new cutting edge
techniques techniques
Historical know-how Experimental know-how and expertise
Use profits to fund Use investors money to fund research and development research and development
2.2 What makes the valuation of new economy firms so special?
The specific character of new economy firms has important implications for equity valuation. Any assessment of new economy stocks will probably be subject to a higher level of contingency than the valuation of old economy stocks due to several reasons.
First, new economy companies are different in that they use new technologies and rely on new and probably more diverse business models. Obviously, any valuation of these is conditional upon the limited historical experience among potential investors.
Second, new economy firms frequently have been created only recently meaning that any valuation may not rely on back data.
Third, new economy firms much more than traditional firms rely on intangible assets (notably human capital). The greater role for intangibles creates additional uncertainty: on the one hand, there is currently no technique available allowing for a reliable assessment of such assets. On the other hand, the higher fraction of investment into intangible assets immediately and to the full extent shows up as costs in their balance sheets thereby reducing accounted current profits and rendering the evolution of profits less steady.13
13. Mouriaux/Verhille (2000).
Fourth, the commitment of new economy firms to investment and intangible assets implies that investors buy future growth expectations at the expense of current earnings. Any valuation of new economy firms, therefore, relies increasingly on expected rather than actual figures.
Fifth, the valuation of new economy stocks may be more sentiment and/or news flows driven than that of old economy firms.
Sixth, prices of new economy stocks ceteris paribus react much stronger to given changes in external growth or inflation assumptions due to the discount leverage.14
14. See also paragraph 4.2. BOX 2: Valuation techniques Comparable Company Analyses:
New economy companies and those not making profit are notoriously difficult to value, and benchmarking them against a peer group is a common methodology.
Discounted Future Earnings:
Taking a representative measure of profitability and then discounting this back to present value is used as a proxy for current profitability. This method is simpler than a full-blown discounted cash flow analysis and relies on fewer assumptions. But the assumptions are, though fewer, more influential and therefore must be implemented with caution.
Discounted Portfolio Valuation:
The value of some new economy companies lies not in their current, near-term, revenue generation ability, but rather in the company’s potential to bring value-enhancing products to the market. Such companies can have lumpy and unpredictable revenue streams that make them unsuitable candidates for a comparable company analysis. One way to get around this caveat is to assess each product in the company’s portfolio in terms of its potential market and its probability of getting to market. A key driver is the likelihood of getting to market and to this extent a set of probabilities – each representing a specific development stage – is applied. Once the market potential and the likelihood to enter that market has been estimated, a relatively aggressive discount rate is applied to obtain the net present value of each product.
Risk-Adjusted Discounted Cash Flow:
This method is quite similar to the discounted portfolio method. Sales forecasts for the products in pipeline are risk-adjusted and the net present value is derived by assuming long-term growth rates, such as GDP growth. This method is primarily applied to later stage earnings driven companies.
Traditional Criteria:
Frequently applied instruments are PE ratios (or PE to growth ratios), dividend discount models, price to sales ratios and price to book ratios (PB ratios).
Seventh, from an empirical point of view, changes in projections about sales and profit growth themselves have been much more important for new economy than for old economy firms.15
Eighth, anticipating the business outlook for some new economy fields is more difficult due to the massive price erosion, which they are commonly subject to. Finally, valuation of new economy companies relies substantially on a qualitative assessment of the strength, quality and experience of the management, which mostly requires extensive on-site firm visits. Since these are frequently only available to large wholesale investors, this may – despite ubiquitous ICT - lead to structural valuation divergences between large institutional investors on the one hand and small-size investors on the other hand.
Apart from these sector-specific factors, there are also peripheral factors that may drive stock prices differently than in the past and/or may affect new economy stocks in a different way than old economy stocks.
For example, the emergence of electronic trading platforms and online brokerage has multiple achievements , such as more rapid trade execution and settlement, permanent access and reduced transaction costs as well as increased market liquidity. But they may also be conducive to contagion and/or intraday trading. They enable non-institutional investors (i.e., new behavioural patterns16)
to enter the markets, which may have unknown effects on valuation and its volatility. Furthermore, electronic trading may have inclined dealers to “spoofing”17 and some characteristics of technology stocks – small float, high
volatility – appear well suited to investors who prefer these new channels of communication and stock market trading.
The increased role of index-linked management can amplify the spread of herd behaviour and lead to self-sustaining price increases: when prices of certain stocks rise, their relative weight in the index increases, thus prompting managers to accumulate these shares within their benchmark portfolios.18 This may be
particularly applicable to an environment characterised by small firm size and asymmetrically distributed market capitalisation.
Crowd behaviour may create financial bubbles according to the “bigger fool” theory. This theory may better apply to new economy stocks (more volatile and more sensitively reacting to modifications to external assumptions) since risk taking preferences may allow for more extreme “bets” among investors.
15. See, for example, the ad hoc announcements published by the Deutsche Gesellschaft für Ad hoc-Publizität (according to German securities law, listed firms are asked to publish any firm-specific, not publicly known information that may significantly affect the price of its equity).
16. For example, according to a recent study by Schroder Salomon Smith Barney, non-institutional investors are particularly subject to certain patterns of investment conduct, such as the so-called psychological representative heuristics (Handelsblatt, 19/20 October 2001).
17. In fact, the National Association of Security Dealers, owner and regulator of NASDAQ, led investigations concerning price manipulations in equity trading (Neue Zürcher Zeitung, 24 August 2001).
Massive share buybacks may be one reason for a substantial increase in prices of new economy stocks due to the narrow linkage with stock options, which have become an increasingly popular way of remunerating staff within the new economy sector. By buying back shares, the management can, in effect, inflate its own pay – and, because stock options do not appear in the company’s income statement, it can even do it without affecting recorded profits.19
The spread of a global equity culture, increased wealth across population and generation change (e.g., ageing baby-boomers anticipating retirement, younger people better endowed with financial resources and enriched by inheritances) may imply a reduction in the equity risk premium in general and a shift in investment towards more volatile new economy stocks in particular.20
The large media and marketing campaigns commonly organised prior to IPOs may affect stock prices and volatility in a way unknown before (e.g., by attracting an entirely new investor population, enhancing the news/sentiment driven impact on stock valuation). The impact of non-anticipated news on stock valuation is particularly relevant for high growth stocks.
19. The Economist (2001a). Note, however, that share buyback programs have been launched by old economy companies too (e.g., in order to improve earnings per share). Anyway, the frequent use of stock options by new economy firms may provide an additional incentive for employees to pursue more closely the objective of bright stock market valuation.
3
On the evolution of stock markets
from 1997 to 2001
3.1 The evolution of composite indices
From October 1998 to March 2000, it seems that the passion for equity bewitched world stock markets. The unusually bullish valuation of stocks was frequently seen in the light of the technological revolution, which notably the new economy firms promised to bring about. Accordingly, equity price inflation was less pronounced at the level of general stock market indices (e.g., the French CAC40 (+ 150 %)21, the German DAX30 (+ 130 %)), and more so at the level
of “technology-based” indices (e.g., the German NEMAX (+ 1300 %), the US American NASDAQ (+ 300 %)). Though the general trajectory taken by stock markets is well known, two messages may be retained with respect to the period from March 1997 to April 2001. First, the major fraction of the stock price increases observed had been achieved within short periods of time. This is most obvious for euro area and “technology-based” indices. Second, though the new economy phenomenon is primarily associated with Anglo-Saxon economies in general and the US American in particular, euro area stock market indices performed stronger than Dow Jones and FTSE100. Interestingly, though the navigation into the new economy was frequently characterised by “Nasdaqmania”22 , the relative increase in NASDAQ was only slightly superior to
increases in the broad French CAC40 index.
3.2 The evolution of index components
Index components are mostly grouped by sectors.23 Ideally, distinguishing by
sectors may eliminate fixed sector effects and allows abstracting from diverging sector weights across stock market indices. Given its wide sector-based grouping scheme and our particular interest in the euro area, in the following, the focus is on the EURO STOXX. Whereas prices within old economy sectors (such as retail and construction) evolved steadily (increasing by around 70 % compared with their January 1997 score), TMT sectors increased by a stunning 400 % (telecommunication, technology) or 200 % (media). The three new economy sectors took off at the same time (from October 1999) and reached their zenith within the same month (March 2000). Throughout the bull period, the EURO STOXX telecommunication and technology sectors evolved in a remarkably
21. Approximate maximum increase relative to the corresponding scores observed in March 1997. 22. L’Echo, 8 May 2000.
23. For example, the NASDAQ index offers a 7-sector grouping scheme (i.e., Bank, Computer, Industrial, Insurance, Other financial, Telecommunication and Transportation). The EURO STOXX index offers a breakdown into 18 groupings (i.e., Auto, Bank, Basic resources, Chemical, Construction, Cyclical goods and services, Energy, Financial services, Food and beverages, Healthcare, Industrial goods and services, Insurance, Media, Non-cyclical goods and services, Retail, Technology, Telecommunication and Utilities).
similar manner. At the same time, returns within the technology and the telecommunication sector departed steadily from old economy stock yields. Whereas throughout the 12 months prior to January 1998 correlation between price increases in the telecommunication and the technology sectors on the one hand and the retail sector on the other hand had been almost perfect (0,96 and 0,97), by January 2000 it was virtually zero and became even negative afterwards. Given that from a macroeconomic perspective the most important contribution of new technologies probably consists in the proliferation of productivity gains across the entire economy (instead of higher productivity within the ICT sector itself)24, it is questionable whether such a low degree of
correlation is sustainable.
Apart from increasing more rapidly, new economy stock prices are commonly considered more risky.25 Throughout 1997, however, the standard deviation
within the telecommunication sector had been very similar to that observed within the retail sector. By end 1999, volatility in telecommunication stocks increased very rapidly and decreased again from April 2000 onwards. When adjusting for scale effects, one observes that even in 2001 price volatility within the new economy sectors remained on a very high level.26 Within most old
economy sectors, price adjusted volatility was not subject to systematic acceleration throughout the period considered. But the EURO STOXX new economy sectors did not necessarily behave different from old economy sectors. For example, the implicit “feasibility frontier” between monthly price increases and relative price volatility has been similar throughout the period under consideration.
3.3 Correlation between the United States and the euro area: the industrial
and the telecommunication sector
In order to illustrate whether and to what extent the more intense new economy proliferation in the US is reflected by euro area stock prices we compare the evolution of those two sectors appearing in both the EURO STOXX and the NASDAQ (i.e., industry and telecommunication). The degree of co-movement may vary substantially across sectors and time. For example, monthly rates of return on industrial stocks correlated quite narrowly. The 12-month correlation coefficient was at any time above 0,6, ranged steadily around 0,8 and reached its peak (0,86) from September 1998 to August 1999. Conversely, correlation between US and euro area telecommunication stock returns has been subject to considerable changes. Whereas they hardly correlated at all in 1997 (correlation coefficient: 0,16), correlation increased rapidly reaching its peak from May 1999 to May 2000 (0,91). Although the main direction of rates of return pointed downwards from April 2000 onwards, correlation decreased rather rapidly to 60 % recently.
24. Oliner/Sichel (2000).
25. We follow common textbook theory in defining risk by volatility (see, for example, Baume (1991)). 26. Within the technology sector relative volatility even increased in the aftermath of the stock price reversal
Figure 2: Changes in telecommunication and industrial stock prices: correlation between the euro area and the US
Source: Bloomberg, own calculations.
Closing price volatility and intraday spread in both sectors evolved similarly across the Atlantic though both measures indicate a slightly higher level of volatility for stocks listed at NASDAQ. With respect to the telecommunication sector, relative closing price volatility since end 2000 is very high again (similar to the level observed by the turning point in March 2000) both within NASDAQ and the EURO STOXX. The same holds for the intraday spread. Whereas by early 1998 the telecommunication intraday spread had been below 1 %, it exceeded 4 % (EURO STOXX) and 6 % (NEMAX) by March 2000. And again, a full year after prices peaked, the intraday spread is still very high.
In total, it seems that from mid 1999 until late 2000, the sector property (instead of the country property) had been the overriding factor of the return pattern. This seems to confirm the assumption that specific factors accompanying the new economy (such as globalisation of product markets, ubiquity of ICT and more integrated financial markets) reduced the relevance of country factors in achieving the optimum portfolio diversification through lower dependency on the country’s cyclical position, improved information gathering and better use of cross-border mergers and acquisitions. Since late 2000, however, one observes again large discrepancies between the evolution of the NASDAQ (more volatile and more rapidly decreasing prices) and the EURO STOXX telecommunication sector stock prices possibly indicating a decreasing role for industry factors. 0,0 0,1 0,2 0,3 0,4 0,5 0,6 0,7 0,8 0,9 1,0 1998 1 1998 3 1998 5 1998 7 1998 9 1998 11 1999 1 1999 3 1999 5 1999 7 1999 9 1999 11 2000 1 2000 3 2000 5 2000 7 2000 9 2000 11 2001 1 2001 3 Telecommunication Industrial
3.4 Descriptive evidence from firm-level data
3.4.1 EURO STOXX companies
This section illustrates the level and the volatility of return obtained on new economy and old economy stocks based on firm-level data. In a first step, we present key indicators for 219 firms covered by the EURO STOXX (from April 1998 to April 2001).27
Figure 3: Key indicators of monthly stock returns by EURO STOXX sector
Source: Bloomberg, own calculations.
Contrary to the idea of a crude “high-tech mania”28, the high-tech property has
by no means been a sufficient criterion for high returns throughout the period under consideration. In fact, the TMT segment constitutes the lower bound in terms of the 25 % quartile for monthly returns. Only at the 75 % quartile level have monthly returns been significantly higher within the TMT sector than across the old economy sectors. From April 1998 to late 1999, the fraction of TMT stocks for which positive returns had been recorded was very similar to the corresponding share across the 15 old economy sectors (i.e., around 50 %). Only from then on did the situation change significantly in that almost no negative returns were recorded among the 34 new economy companies until February 2000. A full year after the fall back in prices, the share of new economy firms subject to positive returns fluctuates vehemently indicating very high uncertainty and a rather low degree of transparency.
27. I.e., firms located within the 4 major countries of the euro area (i.e., France, Germany, Italy and Spain). 34 out of these 219 firms are listed within the telecommunication, technology and media sectors, whereas 185 were taken from the remaining 15 old economy sectors of the EURO STOXX.
28. Financial Times, 16 March 2000.
Monthly return (solid, LHS, [%]) and volatility (dotted, [RHS], [%])
-15 -10 -5 0 5 10 15
AUTOBANKBASCHEM CONSTR CYCL ENERGY FIN FOO D HEAL TH INDUINSU NCYCLRETAILUT IL MEDIATECH TEL -30 -20 -10 0 10 20 30 40
25 %pt Median 75 %pt Relative volatility
Share of firms with positive returns by sector groupings [%]
0 10 20 30 40 50 60 70 80 90 100 4 1998 7 1998 10 1998 1 1999 4 1999 7 1999 10 1999 1 2000 4 2000 7 2000 10 2000 1 2001 TMT Other than TMT
Figure 4: Intraday spread and daily returns for TMT and non-TMT stocks
Source: Bloomberg, own calculations.
The intraday spread observed for new economy stocks, too, initially behaved very similarly to the spread observable for old economy firms (below 4 %). Only from late 1999 onwards did the intraday spread on new economy stocks rise quickly and almost doubled. This corresponds to an effective increase in intraday volatility since the rise in daily returns was substantially lower. The intraday spread observed for TMT stocks remained high in the aftermath of the fallback in April 2000.
3.4.2 A comparison with “genuine new economy firms”
Given the inherent character of the EURO STOXX, its TMT sectors predominantly include large companies, which do not necessarily reflect the “true character” of a new economy firm.29 Unfortunately, the data availability and the recent
establishment do not allow for analyses of returns on “genuine new economy stocks” on a broad scale. In order to separate the business model effect from impacts driven by the field of activity we compare two groups of telecommunication firms, i.e. former state-governed monopolists and selected newer privately managed competitors (“genuine new economy firms”). Whereas the choice of the ex-state monopolists is relatively obvious (i.e., Deutsche
29. It is, however, questionable whether size is a characterising element of new economy firms. On the one hand, the bull period has been understood as a “technology-laden NASDAQ bubble” (The Economist (2001b)) and innovating new economy companies are commonly considered – along the lines of the early Schumpeter - rather new and small. On the other hand, within some markets shareholders valued large companies’ stocks more than smaller firms’ stocks by an increasing margin (Kopcke (2000)). Anyway, even the more recent high-tech firms reported important market capitalisations.
Intraday spread (solid, LHS, [%]) and daily return (dotted, RHS, [%])
0 1 2 3 4 5 6 7 8 1 1998 3 1998 5 1998 7 1998 9 1998 11 1998 1 1999 3 1999 5 1999 7 1999 9 1999 11 1999 1 2000 3 2000 5 2000 7 2000 9 2000 11 2000 1 2001 3 2001 -1,0 -0,5 0,0 0,5 1,0 1,5 2,0 2,5 3,0 3,5 4,0 4,5 5,0 5,5 6,0
Telekom, Télécom France, Telecom Italia, Telefónica), the selection of “genuine new economy firms” is based on the assessment of asset management professionals of three major Luxembourg commercial banks.30
Figure 5: Average and standard deviation of monthly returns
Source: Bloomberg, own calculations.
From this comparison one may derive two conclusions: First, “genuine new economy stocks” on average benefited from higher return at the expense of higher volatility. Whereas the “spread” at the 25 % quartile of return has been almost –700 basispoints, at the median it has been 160 basispoints and at the 75 % quartile level it has been 670 basispoints. The higher volatility across “genuine new economy firms” may be understood as a higher fluctuation of returns across firms and throughout time.31 Second, throughout the period
under consideration, stocks of former state-governed monopolist telecom-munication companies, on average, participated in a good deal of the return potential offered by the “genuine new economy firms” and avoided the high return volatility associated to these.
30. The professionals consulted were asked to name firms which, from the perspective of institutional investors, are commonly considered new economy firms, representative of their sector and benefit from a high recognition value. The set of new economy firms includes Nextel Communications, Covad Communications, Vodafone, KPNQ West, Cisco Systems, Ciena, Alcatel, Nokia, Yahoo and CMGI. Though, strictly speaking, these firms belong to different new economy fields of activity, most of them operate within the broader telecommunication business.
31. Vodafone stocks constitute an exception in that they performed better than those of the former state-governed monopolists “in spite of” lower return volatility.
Monthly return (solid line, LHS, [%]) and volatility (dotted line, RHS)
-60 -40 -20 0 20 40 60 4 19985 19986 19987 19988 19989 1998 10 199811 199812 19981 19992 19993 19994 19995 19996 19997 19998 19999 199910 199911 199912 19991 20002 20003 20004 20005 20006 20007 20008 20009 200010 200011 200012 20001 20012 20013 20014 200 1 -0,1 0,1 0,3 0,5 0,7 0,9 1,1 1,3 1,5
Figure 6: The distribution of returns: former state-governed companies (LHS) and “genuine new economy firms” (RHS) in the telecommunication sector [%]
Source: Bloomberg, own calculations.
As it comes to the intraday spread, again, one observes substantial differences between “genuine new economy firms” and former state-governed monopolists operating in the telecommunication sector. Throughout the entire period the spread had been less accentuated among the former state-governed monopolists. Furthermore, whereas among the latter, intraday spreads in the aftermath of the fall back in prices stabilised at around 4 %, they increased among the “genuine new economy firms” exceeding, on average, 10 % by April 2001.
Figure 7: Daily returns and intraday spread: former state-governed companies and “genuine new economy firms” in the telecommunication sector
Source: Bloomberg, own calculations.
To sum up, the common assumption of higher returns on new economy equity bought at the expense of higher risk cannot be confirmed unanimously, but depends on the period considered. This is with respect to the volatility throughout time as well as that across firms. Some indicators were subject to
Intraday spread (solid, LHS, [%]) and daily return (dotted, RHS, [%])
0 2 4 6 8 10 12 4 1998 6 1998 8 1998 10 1998 12 1998 2 1999 4 1999 6 1999 8 1999 10 1999 12 1999 2 2000 4 2000 6 2000 8 2000 10 2000 12 2000 2 2001 4 2001 -2 -1 0 1 2 3 4 5 6
Genuine new economy firms Former state-governed firms
0 10 20 30 40 50 60 70 80 90 100 DTE FTE TI TEF VOD 0 10 20 30 40 50 60 70 80 90 100 NXTL COVD CSCO CIEN CGE NOA3 YHOO CMGI NXTL
breaks already in the last quarter of 1999. Furthermore, whereas some indicators for new economy equity (e.g., return volatility across firms) point towards a return to “normal levels” after spring 2000, others (such as the intraday spread) still reveal a considerable spread.
3.5 On the evolution of price earnings ratios
An important indicator frequently referred to when discussing stock market valuation is the PE ratio.32 PE ratios soared considerably throughout the bull
period of the last four years. For example, the S&P500 PE ratio exceeded the mark of 44 in December 1999, a figure not seen since 1881.33 Since January
1881, the average S&P500 PE ratio has been below 16, its 75 % quartile ranges around 18,5. But PE ratios increased even stronger within new economy sectors. Whereas in early 1995, the aggregate PE ratio for NASDAQ computer stocks was at around 30 (at a time when the S&P500 PE ratio navigated around 20), it reached a stunning 260 in February 2000 (i.e., almost five times the score observed for the S&P500 index). Meaning that, ceteris paribus, one would get into the black only at an implausible point in time, PE ratios for stocks in general and new economy companies in particular have often been considered unreasonable high. Though stock prices decreased substantially since February 2000, high PE ratios are not a matter of the past. It is true that PE ratios crushed in the aftermath of the turning point in spring 2000, but at least the NASDAQ computer sector PE ratio is back again to three-digit levels since mid 2001.34
Figure 8: PE ratios for S&P500 and NASDAQ computer stocks
Source: Bloomberg, R. Shiller.
32. Paine Webber (2000).
33. See R. Shiller’s web site (Harvard University).
34. Obviously, today’s high PE ratios are not fully comparable to those observed prior to April 2000 since a number of non-profitable firms probably will not be part anymore of the PE ratio sample.
S&P500 PE ratio (January 1881 to April 2001)
0 5 10 15 20 25 30 35 40 45 50 1881.01 1887.02 1893.03 1899.04 1905.05 1911.06 1917.07 1923.08 1929.09 1935.1 1941.11 1947.12 1954.01 1960.02 1966.03 1972.04 1978.05 1984.06 1990.07 1996.08 Current Median 25%pt 75%pt 0 50 100 150 200 250 300 1 1997 5 1997 9 1997 1 1998 5 1998 9 1998 1 1999 5 1999 9 1999 1 2000 5 2000 9 2000 1 2001
3.6 The primary market
Throughout 1997 to 2000, the substantial increase in stock prices had been accompanied by comprehensive initial public offerings (IPOs), notably in the new economy sectors. The emission volume of IPOs at the Neuer Markt in Frankfurt increased from €373 m (1997) to €13.066 m (2000). In 2000, almost 9 out of 10 IPOs at the Frankfurt Stock Exchange (FSE)35 concerned the Neuer
Markt, whereas in 1997 the share was only around 36 %. Table 2: IPO activity at the Frankfurt stock exchange
Source: Deutsche Börse AG, own calculations.
In general, IPO activity at the FSE Neuer Markt evolved very similar to secondary markets in a double sense. On the one hand, initial returns correlated positively with NEMAX price increases.36On the other hand, the emission volume mirrored
the pattern of the NEMAX index. This co-play may imply destabilising elements in that during boom periods the incentive to raise capital becomes even stronger, whereas in recessions there is no demand for capital anyway. This is of particular importance for new economy firms, since in funding investment they rely predominantly on investor money. 37
Figure 9: The secondary market versus the primary market
Source: Deutsche Börse AG, Bloomberg, own calculations.
35. Due to issues related to data availability, the section on primary markets mostly refers to the FSE. According to estimated figures, the FSE is among the most important stock exchanges within the euro area in particular in terms of turnover, but also in terms of market capitalisation (The Economist (2001a)). 36. Initial returns, in the following, are defined as the relative difference between the submission price and
the first trading price.
37. This reflects the dilemma between microeconomic and macroeconomic aspects which regulators face and reveals why capital regulation may not bite.
-0,4 -0,3 -0,2 -0,1 0,0 0,1 0,2 0,3 0,4 0,5 3 1997 7 1997 11 1997 3 1998 7 1998 11 1998 3 1999 7 1999 11 1999 3 2000 7 2000 11 2000 3 2001 -0,5 0,0 0,5 1,0 1,5 2,0 2,5 0 500 1.000 1.500 2.000 2.500 3.000 3.500 4.000 3 1997 7 1997 11 1997 3 1998 7 1998 11 1998 3 1999 7 1999 11 1999 3 2000 7 2000 11 2000 3 2001 0 1.000 2.000 3.000 4.000 5.000 6.000 7.000 8.000 9.000 Corr Corr
Period Total Total Average Median vol/ ret/rel
number Number Share [%] volume Volume Share [%] init ret issue price
1997 36 13 36,11 2 538 373 14,68 51,44 42,00 -0,32 0,34
1998 67 41 61,19 3 228 1 561 48,36 78,61 51,11 -0,13 0,15
1999 167 132 79,04 12 964 6 691 51,61 44,34 13,33 -0,03 0,32
2000 152 132 86,84 25 556 13 066 51,12 46,23 15,79 -0,07 0,37
2001Q1 9 5 55,56 1 670 107 6,39 20,78 6,67 -0,20 0,56
Number of IPOs Emission volume [€m] Initial return
Throughout the bull period, initial returns on IPOs had been huge. In a number of cases they ranged above 200 % which by far exceeded the corresponding score for IPOs in other market segments at the FSE. Contrary to new listings on other FSE segments, within the Neuer Markt segment, subscription prices, in general, corresponded to the upper edge of the book building spread. Only from March 2000 onwards, subscription prices were fixed within or at the lower end of the book building spread. Since July 2000, in some cases the subscription price fell even below book building range and initial returns vanished.
Figure 10: Initial returns on IPOs and the relative position of the subscription price
Source: Deutsche Börse AG, Bloomberg, own calculations.
As “aggressive” subscription pricing, in general, coincided with high initial returns (see figure above and table 2), it seems that the fixing of the book building spread did not fully anticipate the genuine supply-demand situation.38 Contrary to the
emission volume, the relative position of subscription prices within the book building spread and initial returns decreased considerably after March 2000. Maximum correlation between average initial returns of IPOs and aggregate emission volume is observed with volume lagging initial returns by 2-3 months, though the general level of correlation is rather weak. In total, initial returns reached their maximum level in 1998 (median: + 50 %), whereas emission volume peaked in 2000 only (i.e., at a time when the median initial return fell to around 15 %). At the individual IPO level, a slightly negative correlation between
38. The sheer magnitude of initial returns observed at the FSE seems to be consistent with figures from other stock exchanges. At present, Wall Street’s leading investment banks, including CSFB, Morgan Stanley, Bear Stearns and Goldman Sachs, are under siege from regularly probes into alleged malpractice in their allocation of shares in IPOs in three areas: first, it is alleged investment bank equity syndicate desks channelled shares to specific investors in exchange for supporting the value of the stock in the after-market. Second, it is alleged equity desks channelled generous IPO allocations to investors in exchange for a proportionate amount of unrelated business. Third, it is alleged banks won business by allocating popular IPO tranches to potential IPO candidates, including chief executives of start-up companies in Silicon Valley (The Economist (2001a)).
-200 -100 0 100 200 300 400 1 14 27 40 53 66 79 92 105 118 131 144 157 170 183 196 209 222 235 248 261 274 287 300 313 326
the size of the IPO and the initial return can be observed. However, one observes large discrepancies across sectors. For example, the return/volume pattern is rather neat in the biotech, media and technology sectors and less so in the telecommunication, software and Internet sectors. Differences across new economy areas were also observable with respect to initial returns and emission volume as well as the point in time at which IPO activity took off. For example, in the Internet sector IPO activity became significant by spring 1999 only when emission volume within the software segment already decreased. Whereas in most cases average monthly initial returns peaked at around 200 %, it exceeded 500 % in the technology field. Interestingly, with respect to the peak period of initial returns, the sectors can be classified into three groups. Initial returns on telecommunication and software IPOs peaked in early 1998, whereas those in the media and Internet sector peaked in early 1999 and initial returns in the biotech and the technology field reached their peak in early 2000.
4
On the plausibility of the recent valuation of equity
4.1 The evolution of earnings and dividends
According to classic portfolio theory, the pricing of equity depends predominantly on the evolution of earnings and dividends.39 In order to assess
the equity price stance observed in recent years, in the following, some key figures on earnings and dividends are provided.
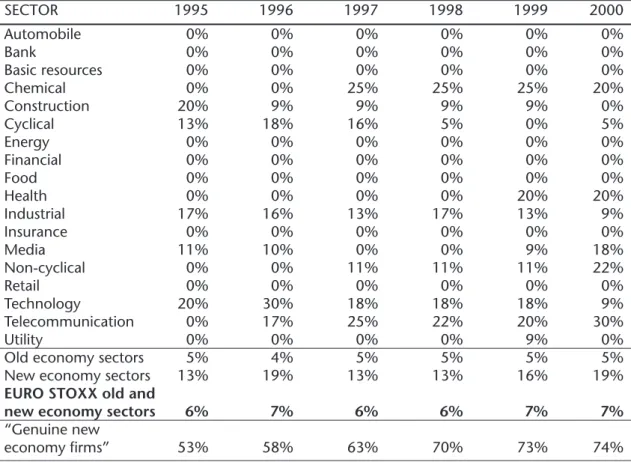
As for earnings, we compiled data for 219 EURO STOXX firms from the major four euro area countries (of which 185 old economy and 34 new economy firms) as well as 1209 “genuine new economy firms” from the following business fields: Web portals, Internet incubators, multimedia, Internet content/info, television, cellular telecommunication, Internet connectivity, telecommunication services, networking products, telecommunication equipment, enterprise software, applications software, computer services, electronic components, computers and memory devices, e-commerce products and e-commerce services.
Table 3: The share of firms reporting negative earnings
SECTOR 1995 1996 1997 1998 1999 2000 Automobile 0% 0% 0% 0% 0% 0% Bank 0% 0% 0% 0% 0% 0% Basic resources 0% 0% 0% 0% 0% 0% Chemical 0% 0% 25% 25% 25% 20% Construction 20% 9% 9% 9% 9% 0% Cyclical 13% 18% 16% 5% 0% 5% Energy 0% 0% 0% 0% 0% 0% Financial 0% 0% 0% 0% 0% 0% Food 0% 0% 0% 0% 0% 0% Health 0% 0% 0% 0% 20% 20% Industrial 17% 16% 13% 17% 13% 9% Insurance 0% 0% 0% 0% 0% 0% Media 11% 10% 0% 0% 9% 18% Non-cyclical 0% 0% 11% 11% 11% 22% Retail 0% 0% 0% 0% 0% 0% Technology 20% 30% 18% 18% 18% 9% Telecommunication 0% 17% 25% 22% 20% 30% Utility 0% 0% 0% 0% 9% 0%
Old economy sectors 5% 4% 5% 5% 5% 5%
New economy sectors 13% 19% 13% 13% 16% 19%
EURO STOXX old and
new economy sectors 6% 7% 6% 6% 7% 7%
“Genuine new
economy firms” 53% 58% 63% 70% 73% 74%
Source: Bloomberg, own calculations. 39. Sharpe/Gordon (1990).
In general, the bright growth assumptions for earnings implicit in the pricing of new economy stocks have only partially been met in the past. Consider, for example, the phenomenon of negative earnings. Across the EURO STOXX old economy sectors, from 1991 to 2000, the share of firms reporting negative earnings ranged between 2 and 5 percent. Within the EURO STOXX TMT sectors, the negative earnings share has been considerably higher (13 to 19 percent). Moreover, apart from the early 90’s when the telecommunication sector had not been as deregulated as today, within new economy sectors the share remained strictly positive.40 This is in sharp contrast
to old economy sectors, where the share of firms reporting negative earnings was frequently zero and a strictly positive share was mostly limited to a period of a few years. Among the 1209 “genuine new economy firms”, the situation seems even more extreme in that the percentage share of firms reporting negative earnings increased from 41 % (1991) to 74 % (2000). The share of firms reporting negative earnings is well reflected by stock prices, in that the running count of stocks whose prices were rising fell behind that for stocks whose prices were dropping. The market seems to have had become more narrow, perhaps signifying cracks in the foundation of the bull market and indicating that already in 1999 for many companies a bear market had begun.41 Furthermore, the share of firms that reported but negative
earnings is about one quarter for a minimum of 8 observations, one third for a minimum of 6 years and more than a half for a minimum of three observations. The share of firms for which accumulated negative earnings exceed accumulated positive earnings throughout the period 1991 to 2000 is approximately 75 %. What is not well reflected by the evolution of new economy stock prices is the evolution of earnings themselves. Consider, for example, the evolution of average earnings for firms reporting positive earnings and those reporting negative earnings. Throughout 1991 to 1998 the average of positive earnings did not change significantly. Given that the share of firms reporting positive earnings shrank during this period and assuming that firms for which earnings became negative already faced lower than average profits before, the strong increase in stock market indices observed in recent years seems implausible.
Given that pay-out ratios may vary throughout time, the exceptionally bullish valuation of new economy stocks could have been more closely related to the pace of dividends rather than that of earnings. Based on figures for 1998 to 200142, however, the pace of dividends within the TMT sectors had been rather
sluggish. On the one hand, in 1998, the dividend yield itself had been rather low among TMT stocks (less than 1% on average) relative to non-TMT stocks (around 1,3 %). On the other hand, the technology sector was the only new economy segment reporting strong dividend growth (though dividend growth within the basic resources sector had been even higher). The media sector and the telecommunication sector reported below average dividend growth.
40. Apart from the media sector in 1997 and 1998.
41. This is also confirmed by evidence from US stock markets. In 1999, the five companies whose market value increased the most accounted for about 42 % of the increase in the total market value of all S&P500 companies and the top 100 companies accounted for 139 % (Kopcke (2000)).
42. Due to limited data availability and the small sample size of “genuine new economy firms” with a proven dividend track record, in the following, we focus on EURO STOXX firms.
Figure 11: Dividend yields (LHS, [%]) and dividend growth from 1998 to 2001 by EURO STOXX sector (RHS, 1998 = 100)
Source: Bloomberg, own calculations.
4.2 On the sensitivity of high growth stocks' price earnings ratios to growth
expectations and inflation
When interpreting PE ratios across old and new economy stocks, one must consider that a couple of variables truly may drive PE ratios of new economy stocks differently from that of old economy stocks.43 This may be shown by
means of different versions of the dividend discount model, such as the constant growth and the multiple growth models.44 According to the constant growth
dividend discount model, the intrinsic value of a stock is given by: 45
(1)
where p, ge, P, rn, rr, π, E, 0, t denote the pay-out ratio, earnings growth, the
stock price, the nominal equity discount rate, the real equity discount rate, the inflation rate, earnings, the start date and the time period identifier respectively. The normal PE ratio reduces to:
(2)
43. In the following, high growth stocks (average growth stocks) are used as synonyms for stocks issued by new economy firms (old economy firms).
44. In spite of the deficiencies of models based on dividends and/or earnings (given that most of the total returns on stocks usually comes from capital gains), dividends and earnings do convey some information about stock valuation. For example, a dividend increase is taken as a signal that sustainable earnings and cash flow, and thus, the value of the firm, have increased. Higher earnings provide more funds from which dividends can be paid to shareholders or which generate more internal growth through reinvestment in the firm (Hannah (2000)). The implications derived within this section, however, apply also to other quantitative evaluation methods (e.g., Discounted Future Earnings, Discounted Portfolio Valuation, Risk-Adjusted Discounted Cash Flow (UBS Warburg (2001)).
45. See, for example, Sharpe/Gordon (1990).
0,0 0,5 1,0 1,5 2,0 2,5 Automobile Bank Chemica l Con struction Foo d Reta il Utility Medi a Tech nology Telecommun ication 04/98-03/99 04/99-03/00 04/00-03/01 0 50 100 150 200 250 Basic resources Technology Cyclicals Automobile Bank Media Industrial Construction
Utility Health Retail Chemical Insurance
Telecommunication Food & beverages
Energy
Non-cyclicals
Financial sevices
In general, thus, lower inflation and higher growth boost PE ratios of both old and new economy companies. But contrary to the implicit assumptions of some financial indicators 46, the relationship between PE ratios on the one hand and
inflation and growth on the other hand is geometric, not linear, and the impact of non-linearity may be substantial. For example, assuming 5 % earnings growth for old economy sectors, a decrease in inflation from an initial 2,5 % to some 2 % would boost the market’s normal PE ratio from 17 to 23 (i.e., + 36 %). For a strong growing new economy environment (e.g., 11 %), the same inflation reduction would bring about an increase in normal PE ratio from 28 to 49 (i.e., + 74 %). Furthermore, high PE ratios may even be justifiable according to the constant growth dividend discount model in case higher earnings growth coincides with proportionally lower pay-out ratios (see white curve in figure 12 below).
Figure 12: Normal market PE ratio according to the constant growth dividend discount model
Source: Own calculations.
Based on the definition of the market’s normal PE ratio, four messages may be retained. First, rapid growth projections may justify very high PE multiples. This may apply in particular to new economy stocks. Second, PE ratios of new economy stocks may react much more sensitive to changes in inflation than PE multiples within old economy sectors. Third, the decrease, which a given stock’s PE multiple would experience, is highly dependent on the level of inflation prevailing. Finally, growth stocks’ PE ratio appreciation, however, is a double-edged sword. Just as high growth stocks are rewarded more in a low inflation environment, they are punished quite severely if the expected high growth rate fails. For example, if it turns out that effective earnings growth is some 20 % below the expected figure, the normal PE ratio for high growth stocks would decrease - e.g., at some 2 % of inflation – by almost 29 %, whereas for average growth stocks the PE ratio would fall by slightly more than 8 % only.
46. Such as the PE to growth ratio, which is defined as the PE ratio divided by the expected rate of growth of earnings over some selected period.
1,6% 1,8% 2,0% 2,2% 2,4% 2,6% 2,8% 3,0% 3,2% 3,4% 3,6% 3,8% 4,0% 0 20 40 60 80 100 120 Inflation rate Normal PE ratio Average growth
Strong growth (identical pay-out) Strong growth (reduced pay-out)
Figure 13: The impact of a 20 % decrease in earnings growth on the normal market PE ratio [%]
Source: Own calculations.
In general, therefore, PE ratios of new economy companies will react much more sensitive to new information of a given quality. If changes in assumptions about sales and profit growth themselves are more important for new economy than for old economy firms 47, this may transmit into much higher volatility of financial
indicators. For purposes of illustration, we consider the multiple growth model. One commonly used idea of multiple growth is based on the view that companies typically evolve through three stages during their lifetime and at some point in time reach their terminal growth rate.48According to the multiple
growth dividend discount model, the intrinsic value of a stock is given by the present value of all dividends up to and including the period T by which the stead-state is attained (VT-) and the present value of all dividends after T (VT+):
(3)
Rearranging yields: (4)
where D denotes dividends (for other variables refer to equation (1)). As a baseline, we use the old and new economy scenarios illustrated in table 4 below.49
47. For evidence on this see, for example, the web site of Deutsche Gesellschaft für Ad hoc-Publizität. 48. These three stages are mostly titled by growth stage, transition stage and maturity stage (see, for
example, Grigoli (1982)). Obviously, the standard three-stage model is not easily applicable to new economy companies, therefore a different lifetime model is used for new economy companies.
49. Obviously, any new economy company scenario is subject to criticism due to the high degree of contingency coming with them. The above scenario serves as an illustration, the impact of modifications to it are presented in the following.
1,6% 1,8% 2,0% 2,2% 2,4% 2,6% 2,8% 3,0% 3,2% 3,4% 3,6% 3,8% 4,0% 4,2% 4,4% 4,6% 4,8% 5,0% 0 5 10 15 20 25 30 35 40 45 50 Inflation rate
Table 4: A baseline scenario for old and new economy firm evolution
OLD ECONOMY FIRMS NEW ECONOMY FIRMS
Stage 1 Growth Stage Stage 1a Start-up Stage
Rapidly expanding sales Rapidly expanding sales
High profit margins No or little earnings
Abnormally high growth Low pay-out ratio
in earnings per share (due to high expected profitability
Low pay-out ratio of investment opportunities)
(due to high expected Stage 1b Warm-up Stage
profitability of investment Still expanding sales
opportunities) Slowly growing earnings
(in absolute terms)
Stage 2 Transition Stage Stage 2 Transition Stage
Increased product saturation Increased product saturation Profit margins under pressure Company begins to increase Increased pay-out (due to fewer pay-out (due to fewer
investment opportunities) investment opportunities)
Stage 3 Maturity Stage (Steady-state Stage)
New investment opportunities offer slightly attractive returns on equity Earnings growth rate, pay-out ratio, and return on equity stabilise around terminal levels
Table 5 below illustrates the sensitivity of new economy stocks’ PE ratio to modifications to various parameters. Hereafter, PE ratios of new economy firms may not only be very high relative to that observed for old economy companies, but may also fluctuate stronger in absolute as well as in relative terms. More specifically, a 30 % reduction in new economy firms’ PE ratio may be perfectly justifiable by a whole brunch of minor assumption modifications (e.g., scenarios B, C, D and F). “Vehement” fluctuations in new economy company PE ratios, thus, as such are by no means an indicator of irrational exuberance. Most contributions focus on the uncertain longer-term projections of corporate earnings in the new economy segment due to a lack of back data, experience, etc.. However, this aspect will become less important through time, whereas the higher sensitivity with respect to macroeconomic assumptions will remain. Thus, in a new economy, central banks are more than ever asked to strengthen the case for well-defined and reliable price acceleration expectations.
Table 5: On the sensitivity of high growth stocks' PE ratio
SCENARIO
A B C D E F G
BENCHMARK GROWTH ENTRY INTO TERMINAL TERMINAL PAY-OUT +0,5 PP
SCENARIO FAILURE BY STAGE 2/1b GROWTH GROWTH FAILURE BY INCREASE
20% AFTER ONE YEAR AFTER FAILURE BY 20% IN
3 YEARS LATER 8 YEARS 20% INFLATION
OE NE OE NE OE NE OE NE OE NE OE NE OE NE Stage 1a: DUR 3 3 3 3 3 3 3 3 3 3 3 3 3 3 PAY 10 0 10 0 10 0 10 0 10 0 10 0 10 0 GRO 15 0 15 0 15 0 15 0 15 0 15 0 15 0 Stage 1b: DUR 2 2 2 2 2 2 2 PAY 15 15 15 15 15 15 15 GRO 50 40 50 50 50 50 50 Stage 2: DUR 7 5 7 5 7 5 7 5 7 5 7 5 7 5 PAY 30 25 30 25 30 25 30 25 30 25 30 25 30 25 GRO 10 30 8 24 10 30 10 30 10 30 10 30 10 30 Stage 3: DUR ∞ ∞ ∞ ∞ ∞ ∞ ∞ ∞ ∞ ∞ ∞ ∞ ∞ ∞ PAY 30 30 30 30 30 30 30 30 30 30 24 20 30 30 GRO 5 5 5 5 5 5 5 5 4 4 5 5 5 5 Inflation rate: 2% 2,5% Normal PE ratio: 27 71 24 49 28 47 25 47 22 58 22 48 21 55
Impact on normal PE ratio:
In absolute terms -3 -22 +1 -24 -2 -24 -5 -13 -5 -23 -6 -16
In relative terms [%] -11 -31 +3 -33 -8 -33 -18 -19 -19 -32 -21 -22
Remarks: DUR: duration of the stage (in years), PAY: pay-out ratio (in percentage terms), GRO: growth rate (in percentage terms); differences result from rounding; source: own calculations.
Note, however, that most of the elements justifying higher PE ratios for new economy stocks (notably higher earnings and dividend growth) had not necessarily been met by new economy companies in recent years.50 One has
also to take into account that the earnings component includes – apart from intrinsic business activity growth – elements such as sector specific inflation (i.e., corporate pricing power) as well as the potential growth due to margin expansion and spending of free cash flow on acquisitions and share buybacks. Furthermore, and apart from the discount multiplier which investors realise by buying future growth expectations at the expense of current earnings, the commitment of new economy firms to investment and intangible assets fuel PE ratios for new economy companies relatively stronger, since the higher fraction of investment into intangible assets immediately and to the full extent shows up as costs in their balance sheets thereby reducing accounted current profits.
A third element possibly justifying higher and more volatile PE ratios for new economy stocks could be lower real equity discount rates. However, given that new economy stocks are commonly considered riskier than old economy ones, this case seems but unrealistic. Thus, in spite of the high growth expectations promised by new economy stocks, according to the IMF, the recent rise in stock valuation had been particularly strong relative to the historical record. Previous technological revolutions, such as the dissemination of electricity-based industries in the 1920’s (which brought about considerable and lasting productivity gains), did not produce the sharp rise in stock valuation similar to that experienced within the IT sector.51 This is although there is still no consensus
on whether the new economy measures up to the great inventions of the past in terms of an acceleration of economy-wide productivity growth.52
Apart from these rather numeric factors, PE ratios, obviously, may also have increased throughout recent years due to common factors. Possible explanations may include financial innovations that help reducing transaction cost and allow for enhanced portfolio diversification (i.e., lower equity risk premium), substantial productivity growth or the tax treatment of corporate profits, but this may neither explain the strong, asymmetric increase in PE ratios for new economy stocks.
4.3 On the plausibility of recent price earnings ratios
4.3.1 Microeconomic aspects
One way of commenting the plausibility of PE ratios for specific market sectors relative to broader market PE ratios is described by the Morgan Stanley Dean Witter Growth Discounter.53 This concept basically consists of two steps. First,
one is to estimate a perpetual growth rate for earnings per share discounted in today’s markets.54 The critical assumption of the Growth Discounter, in the
second step, then is to assume that at a given point in time, all sectors will have a market PE ratio, or put alternatively, identical terminal growth rates.55 With
respect to investment in equities, thus, the following condition holds:
(5) , or,
51. IMF (2000a).
52. For example, according to Gordon, the Internet fails the hurdle test as a great invention on several counts since it involves substitution of existing activities from one medium to another and/or a duplication of existing activities and since much Internet investment involves defense of market share by existing companies, etc. (Gordon (2000)). For a more optimistic view of the importance of the Internet see, for example, Stobbe (2001).
53. For a full description of the Morgan Stanley Dean Witter Growth Discounter idea, see, for example, MSDW (2000).
54. This may be done according to Gordon’s Growth Model (i.e., earnings per share growth rate = bond yield + risk premium - dividend growth).
![Figure 1: The share of high-tech segments in the NEMAX ALL SHARE Index [%]](https://thumb-us.123doks.com/thumbv2/123dok_us/9018525.2799675/11.892.130.766.705.1041/figure-share-high-tech-segments-nemax-share-index.webp)


![Figure 6: The distribution of returns: former state-governed companies (LHS) and “genuine new economy firms” (RHS) in the telecommunication sector [%]](https://thumb-us.123doks.com/thumbv2/123dok_us/9018525.2799675/22.892.267.750.186.450/figure-distribution-returns-governed-companies-genuine-economy-telecommunication.webp)