Sample for the Dutch FADN 2016
R.W. van der Meer, L. Ge and H.B. van der Veen
This study was carried out by Wageningen Economic Research and was commissioned and financed by the Dutch Ministry of Agriculture, Nature and Food Quality within the context of the Statutory Research Tasks
(WOT-06-001-006).
Wageningen Economic Research Wageningen, March 2019
REPORT 2019-020
ISBN 978-94-6343-443-0
Van der Meer, R.W., L. Ge and H.B. van der Veen, 2019. Sample for the Dutch FADN 2016. Wageningen, Wageningen Economic Research, Report 2019-020. 28 pp.; 2 fig.; 8 tab.; 15 ref.
De bedrijven die zijn opgenomen in het Nederlandse FADN (Farm Accountancy Data Network) vormen een steekproef van land- en tuinbouwbedrijven uit de Landbouwtelling. Het Europese FADN is een instrument om het agrarische inkomen en de invloed van het Europese landbouwbeleid te evalueren. Dit rapport beschrijft de achtergronden van de steekproef en de ontwikkelingen aangaande de
populatie en de steekproef in 2016. Alle stappen van het bepalen van het selectieplan, het werven van bedrijven en de kwaliteit van de steekproef worden beschreven.
The farms included in the Dutch FADN (Farm Accountancy Data Network) are a sample of agricultural and horticultural companies from the Agricultural Census. The FADN is a European instrument for evaluating the income of agricultural holdings and the impacts of the Common Agricultural Policy. This report explains the background of the sample and the developments concerning the population and sample of 2016. All phases – from the determination of the selection plan, the recruitment of farms to the quality control of the final sample – are described in this report.
Key words: FADN, sample, population, agriculture, horticulture
This report can be downloaded for free at https://doi.org/10.18174/471865 or at www.wur.eu/economic-research (under Wageningen Economic Research publications).
© 2019 Wageningen Economic Research
P.O. Box 29703, 2502 LS The Hague, The Netherlands, T +31 (0)70 335 83 30,
E communications.ssg@wur.nl, http://www.wur.eu/economic-research. Wageningen Economic Research is part of Wageningen University & Research.
For its reports, Wageningen Economic Research utilises a Creative Commons Attributions 3.0 Netherlands license.
© Wageningen Economic Research, part of Stichting Wageningen Research, 2019
The user may reproduce, distribute and share this work and make derivative works from it. Material by third parties which is used in the work and which are subject to intellectual property rights may not be used without prior permission from the relevant third party. The user must attribute the work by stating the name indicated by the author or licensor but may not do this in such a way as to create the impression that the author/licensor endorses the use of the work or the work of the user. The user may not use the work for commercial purposes.
Wageningen Economic Research accepts no liability for any damage resulting from the use of the results of this study or the application of the advice contained in it.
Wageningen Economic Research is ISO 9001:2008 certified.
Wageningen Economic Research Report 2019-020 | Project code 2282200374
Contents
Preface 5
Summary 6
Samenvatting 7
1 Introduction 8
2 Population of the Dutch FADN 9
2.1 Overview 9
2.2 Coverage 10
3 Selection plan 11
3.1 Introduction 11
3.2 Stratification scheme 11
3.3 Sample farms per stratum 12
4 Evaluation of the sample 15
4.1 Statistical reliability 15
4.2 Response rate 16
4.3 Actions taken to improve the response rate 17
4.4 Comparison sample and target population 17
References and websites 18
Sampling Theory and Methodology 19
Design principles and requirements 22
Number of farms per stratum 24
Sampling fractions 25
Preface
The Farm Accountancy Data Network (FADN) is a European system of sample surveys conducted every year to collect financial, economic, physical and structural data from farms. The purpose of the FADN is to monitor the income of agricultural holdings and to evaluate the impact of the Common Agricultural Policy (CAP). The Netherlands is required to send data relating to a sample of 1,500 farms to the European Commission annually as its contribution to the European FADN. This task is carried out by Wageningen Economic Research on behalf of the Centre for Economic Information (in Dutch, the Centrum voor Economische Informatievoorziening, CEI). This report describes all phases of the Dutch FADN for the accounting year 2016 – from the determination of the selection plan and the recruitment of farms to the quality control of the final sample.
Prof.dr.ir. J.G.A.J. (Jack) van der Vorst Dr H.C.J. Vrolijk General Director Social Sciences Group (SSG) Head of the CEI Wageningen University & Research
6 |
Wageningen Economic Research Report 2019-020Summary
The Farm Accountancy Data Network (FADN) is a European system of sample surveys conducted every year to collect financial, economic, physical and structural data from farms.This report
describes the Dutch FADN for the accounting year 2016 – from the determination of the selection plan and the recruitment of farms to the quality control of the final sample.
The farms included in the Dutch FADN are a sample of agricultural and horticultural holdings from the Dutch Agricultural Census. A selection plan is created in order to make sure that the sample is a good representation of the different farming types and farm sizes in The Netherlands. In 2016, the financial and other results of 1,506 companies were delivered to the European Commission for the purposes of the FADN. This implies that the statutory obligation of delivering data for at least 1,500 farms has been met.
Population
The Dutch Agricultural Census was used as the source for determining the sampling frame. Two features of the sampling frame are relevant to the selection plan and the recruitment: 1) the number of agricultural and horticultural companies is falling annually; 2) increasing numbers of agricultural and horticultural farms are missing in the Agricultural Census.
Sampling plan
The sampling plan has been developed primarily on the basis of Neyman allocation (see Appendix 1 for explanation) across strata that are defined by farm type and farm size to obtain best estimates for the mean farm size for the population. The plan was then adjusted to reflect the heterogeneity of farms in other aspects such as species grown. In general, the greater heterogeneity of farms results in a larger number of sample farms. For example, the number of sample farms was increased for tree nurseries and field vegetables farms which are very heterogeneous in the species grown. Goat farms were included as a separate type in the sampling plan for the first time in 2016. This decision was taken because of the growth in the sector and the relevance to policy (mainly because of public health interests).
Recruitment
The response rate among companies that were approached to take part in the FADN is around 15%. This response rate is slowly falling. A low response rate can result in certain strata no longer
containing enough sample farms and in a potential selection bias in the sample. Various actions have therefore been taken to improve the response. For example, the information material that is sent to potential participants has been improved and a script has been drawn up for the initial interview in collaboration with behavioural economists.
Samenvatting
Het Farm Accountancy Data Network (FADN) is een Europees systeem met een steekproef van agrarische bedrijven waarvoor elk jaar financiële, economische, fysieke en structuur data worden verzameld. Dit rapport beschrijft het Nederlandse FADN voor het boekjaar 2016 – van de vaststelling van het selectieplan, de werving van bedrijven tot de kwaliteitscontrole van de uiteindelijke
steekproef.
De bedrijven die zijn opgenomen in het Nederlandse FADN zijn een steekproef van land- en
tuinbouwbedrijven uit de Landbouwtelling. Er wordt een selectieplan opgesteld om te garanderen dat de steekproef een goede afspiegeling is van de verschillende bedrijfstypen en grootteklassen in Nederland. In 2016 zijn de financiële en andere kengetallen van 1.506 bedrijven aangeleverd aan de Europese Commissie ten behoeve van het FADN. Dit betekent dat aan de wettelijke verplichting van het aanleveren van minimaal 1.500 bedrijven is voldaan.
Populatie
De Nederlandse Landbouwtelling is gebruikt als de bron voor het vaststellen van het steekproefkader. Twee aspecten van het steekproefkader zijn van belang voor het selectieplan en de werving: 1) Het aantal land- en tuinbouwbedrijven neemt jaarlijks af; 2) een toenemend aantal bedrijven zijn niet opgenomen in de Landbouwtelling.
Steekproefplan
Een steekproefplan wordt in eerste instantie gemaakt op basis van de Neyman allocatie over strata van bedrijfstype en bedrijfsomvang om het populatiegemiddelde zo nauwkeurig mogelijk te schatten. Het plan werd daarna nog aangepast om rekening te houden met de heterogeniteit van de bedrijven op andere gebieden zoals type gewassen. In het algemeen geldt hoe heterogener de bedrijven in deze opzichten, hoe hoger het aantal steekproefbedrijven. Het aantal steekproefbedrijven van
boomkwekerijen en de opengrondsgroentebedrijven is bijvoorbeeld verhoogd in 2016 vanwege de hoge diversiteit van de gewassen. Geitenbedrijven zijn in 2016 voor het eerst als apart bedrijfstype opgenomen in het steekproefplan. Hiertoe is besloten vanwege de groei van de sector en de beleidsrelevantie (met name vanwege de volksgezondheid).
Werving
De respons van bedrijven die worden benaderd om deel te nemen aan het FADN is ongeveer 15%. De respons daalt langzaam. Een lage respons kan ertoe leiden dat in sommige strata onvoldoende steekproefbedrijven aanwezig zijn en mogelijk leiden tot een selectie bias in de steekproef. Meerdere acties zijn daarom ondernomen om de respons te verhogen. Bijvoorbeeld het informatiemateriaal dat naar potentiele deelnemers wordt gestuurd is verbeterd en in samenwerking met gedragseconomen is een script ontwikkeld voor het eerste gesprek.
8 |
Wageningen Economic Research Report 2019-0201
Introduction
The Farm Accountancy Data Network (FADN) is a European system of sample surveys conducted every year to collect financial, economic, physical and structural data from farms, with the aim of monitoring the income and business activities of EU agricultural holdings
(https://ec.europa.eu/agriculture/fadn_en). The data are collected by Wageningen Economic Research on behalf of the Centre for Economic Information (in Dutch, the Centrum voor Economische
Informatievoorziening, CEI). The Netherlands are required to provide information on at least 1,500 farms to the European Commission as its contribution to the FADN. The 1,500 farms are a sample of the farms in the Agricultural Census.
This report describes the process of making a sampling plan and evaluating the quality of the sample and the recruitment of new sample farms. First, the relationship between the population and the target population is described in Chapter 2. Chapter 3 presents the selection plan. Chapter 4 describes the developments concerning the recruitment of farms for the FADN and the evaluation of the quality of the sample. Appendix 1 provides an overview of the methodology of sampling used for the FADN. In Appendix 2, the design principles of the FADN are described. Appendices 3-5 comprise more detailed background information tables.
2
Population of the Dutch FADN
2.1
Overview
All agricultural companies considered together form the agricultural population. Theoretically, all agricultural companies in the Netherlands are registered in the trade register of the Chamber of Commerce. On the basis of this database, companies are approached for the Agricultural Census, where additional information on the agricultural activities is collected to describe the structure of the Dutch agricultural sector (data on farms, livestock, crops and special subjects). The Agricultural Census is the data source upon which the sample will be based. Theoretically, the Agricultural Census includes all Dutch farms with more than €3,000 of Standard Output. The Standard Output (SO)1 is
used to determine the economic size of a farm, and refers to the standard value of gross production.
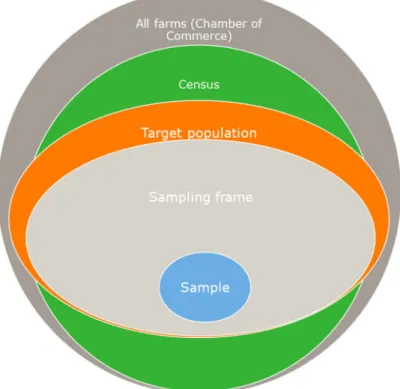
Not all of the farms in the population are represented by the sample (see Figure 1.1), three criteria exist. Only farms with more than €25,000 of Standard of Output are represented. This is the target population. When a farm meets two additional criteria, it becomes part of the sampling frame (see Appendix 1 and 2). These criteria are: share of income from primary activities (>25% in total income) and share of agricultural turnover (50% in total turnover).
Figure 1.1 Relationship between target population, sampling frame and sample
1 The SO of an agricultural product (crop or livestock) is the average monetary value of the agricultural output at farm gate
prices, in euros per hectare or per head of livestock. The sum of all the SOs per hectare of crops and per head of livestock in a farm is a measure of its overall economic size, expressed in euros.
10 |
Wageningen Economic Research Report 2019-0202.2
Coverage
For the Dutch FADN, a minimum economic size of €25,000 of SO has been applied for the target population (see Appendix 2). In 2016, this lower threshold meant that almost 9,000 farms were not covered by the FADN sample. Although this is a large number of farms, they only account for less than 1% of the total production capacity expressed in SO (see Table 1.1).
Table 1.1 Number of farms and their relative economic importance (measured in Standard Output -
SO) in the 2016 Agricultural Census compared to the target population
Number of farms Percentage of farms (%) Percentage of SO (%) All farms in the Agricultural Census (a) 55,680 100.00 100.00 Farms with less than €25,000 of SO (b) 8,733 15.68 0.48
Target population (a) - (b) 46,947 84.32 99.52
Source: Agricultural Census, Statistics Netherlands, calculations by Wageningen Economic Research.
Quality of the sampling frame
Although the Agricultural Census is intended to include all Dutch farms, this is not the case in practice. There are several possible reasons for this. On the one hand, not all farms receive an invitation to participate in the Agricultural Census, for instance because the business is registered with the Chamber of Commerce as a trading company rather than as a farming company. On the other hand, there are farms that do not respond to the request, despite it being obligatory. Table 1.2 illustrates the number of farms recruited for the FADN sample (see Chapter 3) for a certain accounting year but missing from the Census for the accounting years later on. An increasing number of sample farms included in the FADN were not included in the Agricultural Census. These kinds of problems are an example of sampling frame errors. The Ministry of Agriculture is looking into this issue of non-compliance of farmers to register in the census.
Table 1.2 Number of FADN sample farms not included in the Agricultural Census
Accounting year Number of farms missing
2013 0
2014 6
2015 38
3
Selection plan
3.1
Introduction
The determination of the selection plan for the Dutch FADN consists of the following steps (Vrolijk, 2007):
1. Determination of the optimum stratification scheme. This implies specifying the farm types and size classes (3.2)
2. The total number of 1,500 sample farms are distributed over the farm types (3.3) 3. The sample farms are distributed over the size classes (3.4)
3.2
Stratification scheme
The FADN is a stratified random sample. Farms within the target population are stratified based on farm type and farm size measured in euros of SO (see Appendix 1 for the methodological background to random sampling and Appendix 2 for the background to the design principles).
Farm type
Dutch FADN farm types differ in some cases from the European FADN. Some farm types are not present in Dutch agriculture (e.g. olives, citrus fruit) and some types are further detailed because they are of substantial importance for Dutch agriculture in terms of economic size or their relevance for policy makers (such as starch potatoes within arable farming). For a number of farming types – dairy farms and field crops – a distinction is made between organic farming and non-organic farming (see Vrolijk and Lodder, 2002). The latter consists of organic field crop farms, field vegetables farms and combined crop farms. Goat farms were included as a separate subtype for the first time in 2016. They had previously been part of the category ‘other grazing livestock’. The increased number of goat farms in the Netherlands allows analyses to be performed for this type of farm. In addition, the sector is relevant to policy makers because of the possible effects on public health.
Farm size
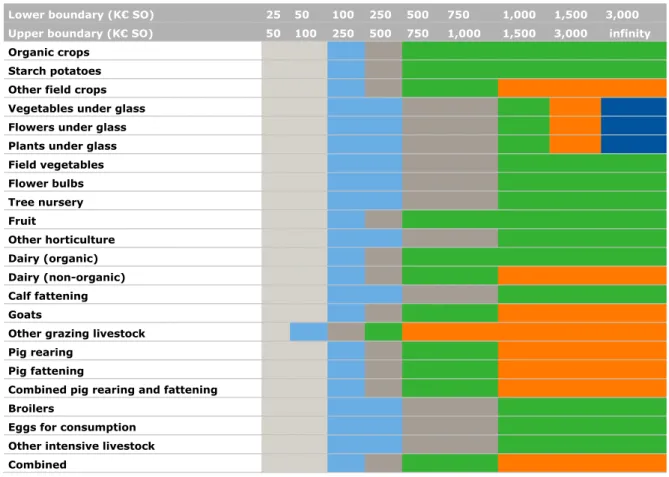
EU Regulation 2015/220 specifies the size classes and puts restrictions on the clustering of size classes. Based on the Standard Output, the variance of strata in these different clustering schemes is calculated and used to determine the optimum clustering scheme (Appendix 1 Neyman Allocation). Table 3.1 shows the optimum clustering scheme for each type of farming for the 2016 target population. Size classes for the strata vary between the types of farming. This is because the size distribution of farms differs greatly between farm types (Ge et al., 2017). For example, field crop farms are in general much smaller in terms of SO than greenhouse horticulture farms.
12 |
Wageningen Economic Research Report 2019-020Table 3.1 Clustering scheme 2016 (size classes in a single colour in one row represent one
stratum)
Lower boundary (K€ SO) 25 50 100 250 500 750 1,000 1,500 3,000 Upper boundary (K€ SO) 50 100 250 500 750 1,000 1,500 3,000 infinity
Organic crops Starch potatoes Other field crops Vegetables under glass Flowers under glass Plants under glass Field vegetables Flower bulbs Tree nursery Fruit Other horticulture Dairy (organic) Dairy (non-organic) Calf fattening Goats
Other grazing livestock Pig rearing
Pig fattening
Combined pig rearing and fattening Broilers
Eggs for consumption Other intensive livestock Combined
3.3
Sample farms per stratum
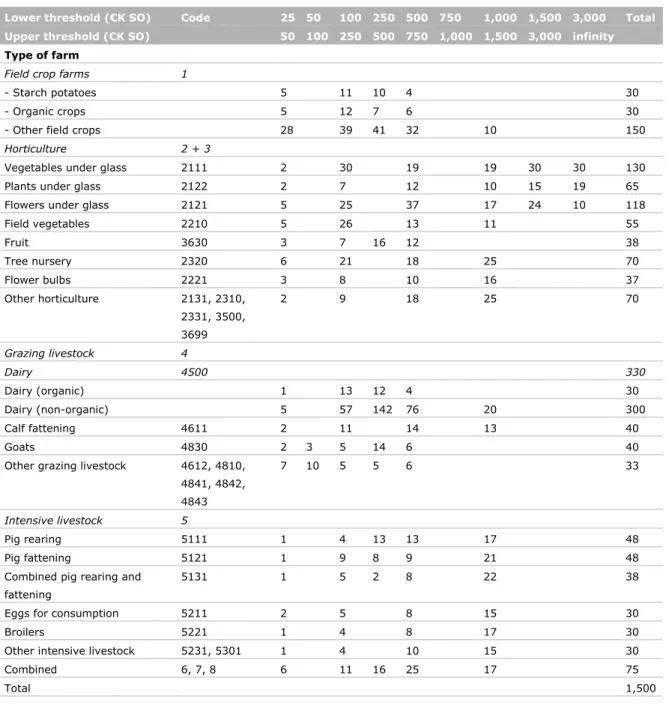
Table 3.2 presents the optimum selection plan for 2016, based on the design principles described in Appendix 2. The distribution of the sample farms across the size classes has remained broadly the same and is mainly determined by the further increase in the scale of farming activities. However, in some cases, the absolute number of farms in the population in the largest stratum has decreased. For practical reasons, the number of sample farms per stratum is limited to a maximum of 10% of the population, and the number of sample farms in that stratum therefore needs to be reduced.
Table 3.2 Selection plan per stratum 2016
Lower threshold (€K SO) Code 25 50 100 250 500 750 1,000 1,500 3,000 Total Upper threshold (€K SO) 50 100 250 500 750 1,000 1,500 3,000 infinity
Type of farm
Field crop farms 1
- Starch potatoes 5 11 10 4 30
- Organic crops 5 12 7 6 30
- Other field crops 28 39 41 32 10 150
Horticulture 2 + 3
Vegetables under glass 2111 2 30 19 19 30 30 130
Plants under glass 2122 2 7 12 10 15 19 65
Flowers under glass 2121 5 25 37 17 24 10 118
Field vegetables 2210 5 26 13 11 55 Fruit 3630 3 7 16 12 38 Tree nursery 2320 6 21 18 25 70 Flower bulbs 2221 3 8 10 16 37 Other horticulture 2131, 2310, 2331, 3500, 3699 2 9 18 25 70 Grazing livestock 4 Dairy 4500 330 Dairy (organic) 1 13 12 4 30 Dairy (non-organic) 5 57 142 76 20 300 Calf fattening 4611 2 11 14 13 40 Goats 4830 2 3 5 14 6 40
Other grazing livestock 4612, 4810, 4841, 4842, 4843 7 10 5 5 6 33 Intensive livestock 5 Pig rearing 5111 1 4 13 13 17 48 Pig fattening 5121 1 9 8 9 21 48
Combined pig rearing and fattening
5131 1 5 2 8 22 38
Eggs for consumption 5211 2 5 8 15 30
Broilers 5221 1 4 8 17 30
Other intensive livestock 5231, 5301 1 4 10 15 30
Combined 6, 7, 8 6 11 16 25 17 75
Total 1,500
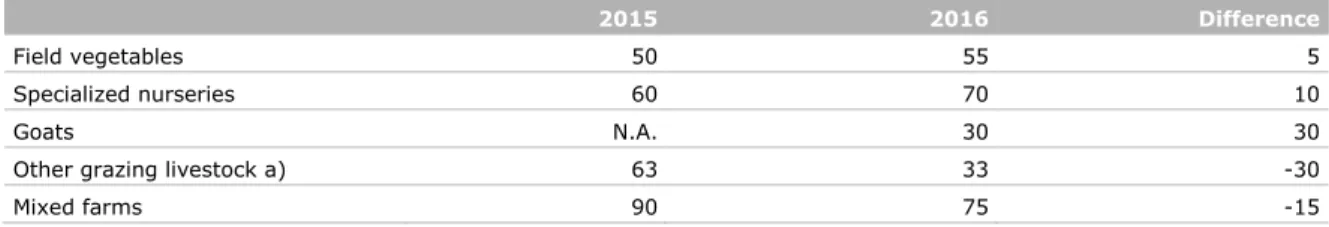
Goat farms were included for the first time in 2016 as a separate type in the sampling plan (see Table 3.3). Compared to the 2015 selection plan, the number of field vegetable farms and tree nurseries has been increased. The numbers of combined farms and those with other grazing livestock have been reduced. The total number of farms in the selection plan remains at 1,500 (the minimum required number of Dutch sample farms according to EU regulations).
The sampling plan was based primarily on the method of Neyman Allocation, a method for stratified sampling to maximise the precision of estimated population statistics given a fixed sample size (Appendix 1). This allocation is adjusted to take the heterogeneity of the farms in other aspects into account. For example: crops are not a stratification variable, but in order to be able to take the great heterogeneity of crops grown on tree nurseries and field vegetable farms into account, the number of sample farms has been increased.
14 |
Wageningen Economic Research Report 2019-020Table 3.3 Number of FADN sample farms 2016 compared to 2015 for farm types with major
changes
2015 2016 Difference
Field vegetables 50 55 5
Specialized nurseries 60 70 10
Goats N.A. 30 30
Other grazing livestock a) 63 33 -30
Mixed farms 90 75 -15
a) Including goats in 2015.
Appendix 4 presents an overview of the sampling fractions (number of farms in the sample compared to the number of farms in the target population). A sampling fraction is the ratio of the size of the sample to that of the population (Cochran, 1977). The sampling fractions differ between strata. This is a result of the disproportionate sampling technique used for the FADN sample. Sampling fractions gives an indication of the number of farms available for recruitment in a stratum. In strata with a high sampling fraction, only a limited number of farms are available for recruitment.
4
Evaluation of the sample
4.1
Statistical reliability
The accuracy of estimates can be measured using the standard error of the estimate of a variable to calculate the confidence interval (see Appendix 1). This confidence interval describes the range
between which the true population value will be, given a certain level of certainty. The 95% confidence interval (with a critical t-value of 1.96) ranges from the calculated average minus 1.96 times the standard error to the calculated average plus 1.96 times the standard error. For example, the standard error of 4,792 for field crop farms signals that the average farm income on such farms can vary within the confidence interval 47,716 +/- 1.96 * 4,792, i.e. (€38,300 - €57,100) (Table 4.1). A higher coefficient of variation implies less reliable estimates, but the value is greatly affected by the absolute value of the average. If the average value approaches zero, the coefficient of variation can become very large.
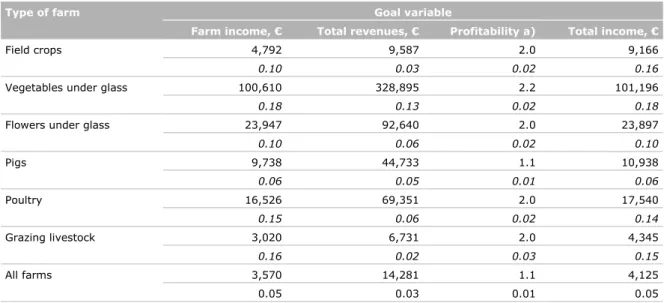
Table 4.1 Reliability of estimates: standard error and coefficient of variation (in italics) of important goal variables per main type of farm, based on CSP2 variant (2016)
Type of farm Goal variable
Farm income, € Total revenues, € Profitability a) Total income, €
Field crops 4,792 9,587 2.0 9,166
0.10 0.03 0.02 0.16
Vegetables under glass 100,610 328,895 2.2 101,196
0.18 0.13 0.02 0.18
Flowers under glass 23,947 92,640 2.0 23,897
0.10 0.06 0.02 0.10 Pigs 9,738 44,733 1.1 10,938 0.06 0.05 0.01 0.06 Poultry 16,526 69,351 2.0 17,540 0.15 0.06 0.02 0.14 Grazing livestock 3,020 6,731 2.0 4,345 0.16 0.02 0.03 0.15 All farms 3,570 14,281 1.1 4,125 0.05 0.03 0.01 0.05
a) Revenues per €100 in costs.
There are clear differences in the reliability of estimates between different types of farm. The
estimates for grazing livestock are among the most reliable estimates (the lowest standard error). This is due to the relatively large number of farms included in the sample, which reflects the importance of the dairy sector in particular in Dutch agriculture. The field crop farms have a low standard error as well. The reliability of estimates is used to evaluate the allocation of sampling capacity to the different types of farm. The European Commission has no requirements regarding the reliability. However, it is one of the factors that is taken into account when determining the distribution of farms over both the farm types and size classes.
2 CSP: Corporate Social Performance: the variant of data collection in which a wide range of data is collected for EU and
national policies. It covers all the topics that are today considered relevant in a report on the sustainability of a farm. About 80% of the farms included in the sample are in the CSP variant.
16 |
Wageningen Economic Research Report 2019-0204.2
Response rate
Long-term response
A minimum of 1,500 farms need to be included in the sample for the Dutch FADN. In 2016, farm reports for 1,506 farms were delivered to the European Commission for the FADN. The target number of 1,500 farms was therefore reached.
Sample farms are retained as far as possible (see Vrolijk and Cotteleer, 2005). Nevertheless, new farms have to be recruited every year to compensate for the farms that are lost or because of changes in the selection plan. In order to meet the required number of farms for delivery to the European Commission, a successful recruitment process is important.
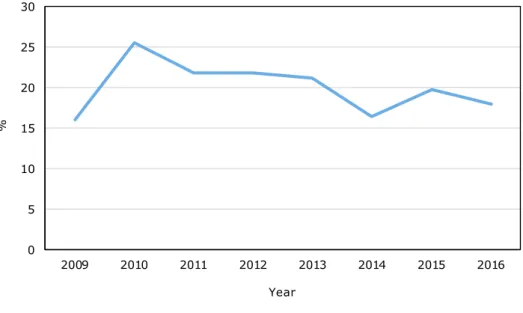
The Agricultural Census is used to select farms that meet the criteria for inclusion in the sample. Addresses for the selected farms are requested from the Ministry of Agriculture, Nature and Food Quality. The farms are then approached to ask if they would be interested in taking part in the Farm Accountancy Data Network. Almost 700 farms were approached for the sample for 2016. Some of these farms (15%) were unsuitable for inclusion in the sample, for example because the entrepreneur has stopped their farm operations or will be stopping in the near future, or the farm forms part of a larger company without the possibility of making a distinction between the accountancy data of the farm and other parts of the concern. Ultimately, 104 farms were recruited. As can be seen from Figure 4.1, the response rate (number of recruited farms / (number of farms approached – unsuitable farms) * 100) has been between 15% and 25% for a number of years. The low response rate is related to the fact that recruitment primarily takes place in sectors with below-average response rates (see Appendix 5).
Figure 4.1 Response rates 2009 – 2016
A response rate of 15% in 2016 is not exceptionally low compared to preceding years, although the graph shows that the response rate is slowly declining. A low response rate combined with a declining number of farms in the population can lead to strata with fewer sample farms available than the optimum according to the selection plan. One problem is that a low response rate can lead to a selection bias if non-responsive farms systematically differ from the recruited farms (see Appendix 1).
Response and size
Table 4.2 shows the response rate for the period 2011-2015 by stratum size. The average response rate was 19%. Appendix 5 gives the response rate and percentage of unsuitable farms per type of farm for the period 2011-2015 as well, showing that on average the response rate of livestock farms is higher than in arable farming and horticulture.
0 5 10 15 20 25 30 2009 2010 2011 2012 2013 2014 2015 2016 % Year
Table 4.2 Response to recruitment drive 2011-2015 by stratum size
Lower threshold for stratum (SO) Farms Unsuitable (%) Response rate (%)
€25,000 - €100,000 290 12% 14% €100,000 - €250,000 595 5% 17% €250,000 - €500,000 95 8% 32% €500,000 - €1,000,000 396 3% 27% €1,000,000 - €1,500,000 388 1% 18% €1,500,000 - €1,500,000 101 3% 19% > €3,000,000 176 3% 16% Total 2,041 5% 19%
4.3
Actions taken to improve the response rate
Various types of actions have been taken to increase the response rate:
• A script has been developed for the initial interview by the staff of Wageningen Economic Research with a potential participant. The script has been developed in collaboration with behavioural
economists. During an initial interview about potential participation, the discussion relates primarily to the outcomes of taking part, such as the benchmarking tools, and reporting about various sustainability effects on the farm.
• The information material explaining the FADN has been improved by the communication department.
• A personal note has been added on the envelope containing the letter in which the entrepreneur is invited to take part in the FADN.
4.4
Comparison sample and target population
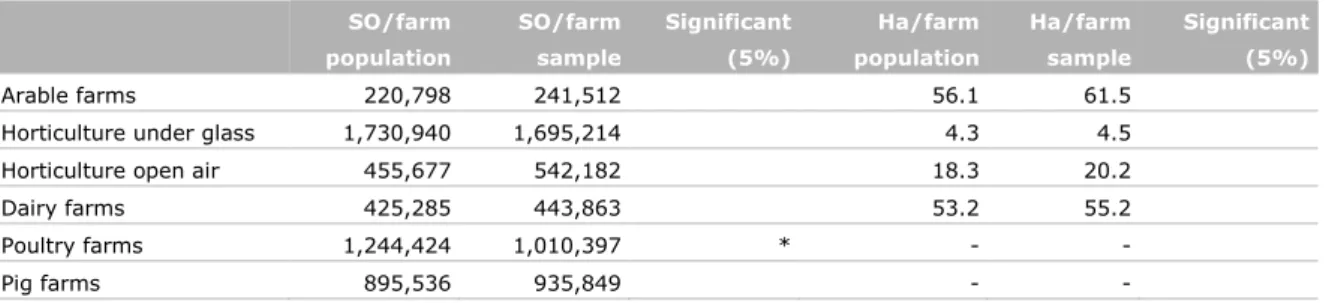
The representativeness (interpreted as there being no systematic differences between the sample and the target population, Van der Veen et al., 2014, see also Appendix 1) of certain specialist types of farms are shown in Table 4.3. For most of the main farm types, there are no significant differences in the acreage per farm and the SO per farm between the sample and the total population. Poultry farms were an exception to this rule in 2016; a significant difference can be seen in the average SO per farm. More laying-hen farms will be including in the sampling plan from 2018 onwards.
Table 4.3 Comparison of farms in the target population and farms in the sample
SO/farm population SO/farm sample Significant (5%) Ha/farm population Ha/farm sample Significant (5%) Arable farms 220,798 241,512 56.1 61.5
Horticulture under glass 1,730,940 1,695,214 4.3 4.5 Horticulture open air 455,677 542,182 18.3 20.2
Dairy farms 425,285 443,863 53.2 55.2
Poultry farms 1,244,424 1,010,397 * - -
Pig farms 895,536 935,849 - -
The sampling plan is based on farm types (e.g. open-air vegetable growers) and not on the underlying crop or animal (e.g. cauliflower or broccoli). This can result in certain crops or animals being
underrepresented or overrepresented in the sample, particularly types that are less common. To obtain an impression of the extent to which this is the case, a comparison was made between the weighted totals in euros of SO for the crops and animals in the sample against the totals from the Agricultural Census. Although the analysis has shown that differences do arise, they are in general not significant.
18 |
Wageningen Economic Research Report 2019-020References and websites
Bethlehem, J. (2008). Wegen als correctie voor non-respons. Centraal Bureau voor de Statistiek (CBS). Statistische methoden (08005), Voorburg/Heerlen, Nederland.
Cochran, W.G. (1977). Sampling Techniques. New York: John Wiley & Sons.
EUR-LEX: https://eur-lex.europa.eu/legal-content/EN/TXT/?uri=celex%3A32015R0220
Everitt, B. S. (2003). The Cambridge Dictionary of Statistics. CUP. ISBN 978-0-521-81099-9.
FADN: http://ec.europa.eu/agriculture/rica/
Ge, L., R.W. van der Meer, H.B. van der Veen and H.C.J. Vrolijk (2017). Design principles and quality of the sample of agricultural and horticultural holdings. Report 2017-016 Wageningen Economic Research 2017
Kruskal, W. and F. Mosteller (1979a). Representative sampling, I: Nonscientific literature. International Statistical Review, 47, 13–24.
Kruskal, W. and F. Mosteller (1979b). Representative sampling, II: Scientific literature, excluding statistics. International Statistical Review, 47, 113–127.
Kruskal, W. and F. Mosteller (1979c). Representative sampling, III: the current statistical literature. International Statistical Review, 47, 245–265.
Kruskal, W. and F. Mosteller (1980). Representative sampling, IV: the history of the concept in statistics, 1895 - 1939. International Statistical Review, 48, 169–195.
Neyman, J. (1934). On the two different aspects of the representative method: The method of stratified sampling and the method of purposive selection. Jour. Roy. Stat. Soc., 97, 558-606.
Veen, H.B. van der, I. Bezlepkina, P. de Hek, R. van der Meer and H.C.J. Vrolijk (2012). Sample of Dutch FADN 2009-2010. Design principles and quality of agricultural and horticultural holdings. LEI-report 2012-061 November 2012, LEI Wageningen UR, The Hague
Veen, H.B. van der, L. Ge, R. van der Meer and H.C.J. Vrolijk (2014). Sample of Dutch FADN 2012. Design principles and quality of agricultural and horticultural holdings. LEI-report 2014-027 December 2014, LEI Wageningen UR, The Hague
Vrolijk, H.C.J. and K. Lodder (2002). Voorstel tot vernieuwing van het steekproefplan voor het Bedrijven-Informatienet. Report 1.02.02. LEI, The Hague, 2002.
Vrolijk, H.C.J. and G. Cotteleer (2005). Non-respons en rotatie in het Bedrijven-Informatienet. Kwantitatieve en kwalitatieve analyse van de effecten. Report 1.05.01 LEI, The Hague, 2005.
Sampling Theory and
Methodology
Key concepts
Population
According to Cochran (1977), the definition of the population is: “The aggregate from which the sample is chosen”. A population is thus an aggregate of creatures, things, cases, etc.
Target population
Cochran (1977) defined the target population as the population about which information is desired. The population to be sampled (the sampled population) should coincide with the target population.
Sampling frame
The sampling frame is the source material or device from which a sample is drawn. It is a list of all those within a population who can be sampled, and may include individuals, households or
institutions.
Sampling
Sampling is a statistical procedure that relates to the selection of the individual sampling units. Sampling helps to make statistical inferences about the population.
Sample
In statistics, a sample refers to a set of observations drawn from a population. A sample is a subset of a population. A sample can be collected either at random or through systematic methods.
Sampling method used for FADN disproportionate stratified sampling
Sampling units from the population that meet certain criteria form the target population. Estimates are made for the target population based on these sample farms. This might raise the question of how conclusions can be drawn for the target population if only a limited number of farms are observed. The answer to this question can be found in sampling techniques such as stratified random sampling (Cochran, 1977). Sampling units that are included in the sample must be representative for the whole target population (no systematic differences between the sample and the population, Van der Veen et al., 2014).
One important issue is how to ensure that the sampling units are representative for the whole target population. This can be achieved through a disproportionate stratified random sample. A stratified sample implies that the target population is divided into a number of groups (strata). Subsequently, the sampling units are randomly selected from each of the groups. The variables that define these groups must be chosen in such a way that the sampling units within any one group are similar (at least in terms of the important aspects). Sampling from each group ensures that the sample includes sampling units from all groups consistently with different characteristics. Stratification ensures that all groups are properly represented, thereby allowing separate estimates for all groups. All groups combined make up the whole target population. This method of sampling allows unbiased estimates to be made for the whole target population of farms.
Disproportionate means that not all farms have the same chance of being included in the sample. Groups that are relatively homogeneous, i.e. containing farms that show a high degree of similarity, will have a lower chance of being included in the sample. In cases of less homogeneous groups, it is important to have a larger number of observations if reliable estimates are to be made.
20 |
Wageningen Economic Research Report 2019-020Random sampling
Random selection is an application of probability sampling in which each unit in the population has an equal chance of being included in the sample (Cochran, 1977). In the case of stratified sampling, each unit in a stratum has the same chance of being included.
Neyman allocation
Optimum allocation refers to a method of sample allocation based on stratified sampling. This allocation is sometimes called Neyman allocation, after Neyman (1934). The purpose of Neyman allocation is to maximise survey precision given a fixed sample size. According to Neyman allocation, the ‘best’ sample size for stratum h would be:
𝑛𝑛ℎ= n∑𝑁𝑁ℎ𝜎𝜎𝑁𝑁ℎ 𝑖𝑖𝜎𝜎𝑖𝑖 𝐿𝐿 𝑖𝑖=1
where 𝑛𝑛ℎ is the sample size for stratum h, 𝑛𝑛𝑖𝑖 is the sample size for stratum i, n is the total sample size, Nh is the stratum size in the population,𝜎𝜎ℎ is the standard deviation of the stratum within the population and L represents the number of strata.
Quality of survey samples
Representativeness
Representativeness is a well-known concept in the context of sampling. Nevertheless, depending on the context, there are different definitions and interpretations. Kruskal and Mosteller (1979a, 1979b, 1979c, 1980) distinguish the following interpretations (among others):
1. Random without a selective mechanism.
2. The sample as a miniature representation of the target population: all subpopulations in the sample are in the same proportions as in the total population.
3. No significant difference between the estimated value of the target value and the actual value of the target population (compare Van der Veen et al., 2014).
4. Coverage of the sample of certain farm types or farms in certain size classes.
An indication of the representativeness for a random sample without selection (interpretation 1) is the R indicator. This indicator gives an indication of the possible non-response bias (Bethlehem et al., 2008). To be able to calculate the R-indicator, the response chance of a farm is estimated on the basis of a number of variables available in the Agricultural Census (Appendix 2).
Interpretation 2 is intuitively the most logical and the most used interpretation in survey research. It is of less importance for the FADN because the FADN is a disproportionate stratified sample. To be able to determine whether a sample is representative according to interpretations 3 and 4, it is necessary to indicate which characteristics of the population should be included in the sample. This is the target variable for research. Talking about representativeness in broad terms is therefore not very meaningful. The sampling method used for the FADN is in line with interpretation 3. However, other aspects are taken into account where relevant.
Non-response
Not all farms approached for participation in the FADN are willing to participate, leading to a non-response factor in the recruitment process. Non-non-response is the failure to measure some of the units in the selected sample (Cochran, 1977). A low response rate does not necessarily provides incorrect results (Bethlehem 2008). However, if the non-response is biased, certain groups can be
overrepresented or underrepresented.
Standard error
The standard error of a statistic (i.e. usually an estimate of a parameter) is the standard deviation of its sampling distribution or an estimate of that standard deviation (Everitt, 2003). If the parameter or the statistic is the mean, it is called the standard error of the mean.
Coefficient of variation
The coefficient of variation is defined as the standard deviation divided by the group mean. The coefficient of variation gives an indication of the dispersion (i.e. variability) of the observations.
22 |
Wageningen Economic Research Report 2019-020Design principles and
requirements
EU regulations
EU Regulation 2015/220 sets out rules for the target population, such as definitions for farming types and size classes. The regulation prescribes several size classes and options for the clustering of size classes, the threshold (€25,000 of SO for the Netherlands) and the minimum number of sample farms for every EU country (1,500 for the Netherlands).
Target population
The EU Regulation describes that, for the Dutch FADN, a minimum economic size of €25,000 of SO should be applied to the target population. This minimum was introduced after the introduction of the Standard Output in 2010 and it was required to fit in with the existing EU size classes. Moreover, the coverage of the sample should remain at least 77% (Van der Veen, 2012). The minimum size exists to be able to select the commercial farms only, which is required by the European Commission.
Sampling frame
For practical and methodological reasons, a limitation on ‘other income of the farm’ is used for sample farms. A farm should gain at least 25% of its turnover from primary agricultural activities.
Furthermore, agricultural activities (in the broadest sense including other gainful activities) should comprise the largest share of the turnover of the farm (see Figure 2.1).
Number of sample farms per farm type
When determining the number of sample farms per type of farm, the number of farms in the target population, the economic significance of a type of farm, the amount of land used, and the
heterogeneity within a type (the dispersion in size measured in Standard Output) are important considerations.
If the amount of land used were adopted strictly as the criterion, the sample would consist largely of arable and dairy farms. Farm types can be heterogeneous in terms of scale (measured as the SO) or crops. The selection plan largely matches the numbers of farms that would be expected based on the criteria of economic importance, heterogeneity and number. A few observations are presented below: • The number of arable and dairy cattle farms is greater than would be expected on the basis of
heterogeneity. This is because these sectors are particularly relevant for policy.
• There are fewer mixed farms and other grazing livestock farms. These sectors are less important for research and policy, but they are important for reporting several characteristics of the total target population.
• More horticultural companies have been included than would be expected given the number of such farms in the target population. This is primarily due to the wide variation in crops that are
cultivated, particularly at tree nurseries and flower bulb farms.
• For the majority of open-field types, there are relatively more farms in the sampling plan than would be optimum given the numbers of companies. This is due to the greater heterogeneity in crops grown on horticultural farms. This also applies to greenhouse horticulture; in addition, these businesses are highly relevant to policy in terms of energy issues in particular.
The total number of farms in one farming type should be at least 30. A reduced number of farms would make it very difficult to perform useful analyses on such farm types (Vrolijk and Lodder, 2002).
Stratification scheme and sample farms per stratum
The FADN sample distinguishes groups based on economic size and type of farming. Within a type of farm, the principles of optimum allocation (see Appendix 1) determine both the stratification scheme and the distribution of farms over the size classes. The variance of strata in different clustering schemes (as described in the EU Regulation) is calculated on the basis of the Standard Output. These variances are used to calculate the standard error. The optimum clustering scheme is chosen on the basis of the standard error. As the number of strata increases, the variance of the target variable will gradually decrease. If the reduction in the variance of adding an extra stratum is less than 5%, no more strata are added. For more details, see Vrolijk and Lodder (2002). Given this optimised
stratification scheme, more sample farms are assigned to a stratum in the event that farms are shown to be more heterogeneous. In the extreme example that all farms were exactly alike, one observation is sufficient to make reliable estimates.
Besides the abovementioned statistical criteria, some practical criteria exist too:
• The maximum number of farms within a stratum is 10% of the total number of farms of the target population within that stratum. A larger number would lead to problems in recruiting farms. • The minimum number of farms within in a stratum is five to avoid a situation in which the selection
plan comprised mainly large farms. For research purposes, small farms are relevant too. For many of the smallest strata, the minimum of five is not feasible given the small numbers of farms in the target population and the maximum proportion of 10% (see Table A3.1).
Weighting system
The purpose of the weighting system is to take account of different sampling fractions for different strata. In the production of FADN results, weighted averages are calculated using these weightings applied to each individual farm recorded in the sample. The individual weighting is equal to the ratio between the numbers of farms of the same classification stratum (type of farming x economic size class) in the population and in the sample. The farms in the target population within a stratum are continually changing. These changes could influence the inclusion probability of farms in one particular stratum at the time of recruitment. In theory, these differences in inclusion probabilities should be taken into account in the estimation process in order to ensure unbiased estimators. This would lead to a very complicated system with many different substrata with different inclusion probabilities. This procedure is not applied in the FADN. The theoretical assumption of a strictly random sample cannot be validated. Still, the assumption of a random sample is made (Ge et al., 2017).
Recruitment
Farms are randomly selected from the Agricultural Census on the basis of the selection plan. Farmers from a selected farm are approached and asked whether they would be willing to participate. If the farmer declines, another farm from the same strata will be approached.
The likelihood of being included within a stratum should theoretically be the same for every farm within that stratum. However, this is not the case in practice. Although the selection plan is
determined afresh each year, the farms for the sample are not drawn from the target population from scratch each year. For practical reasons, the farms currently in the sample are retained wherever possible. Farms can shift between strata from one year to the next (different type of farm and/or different size class). This means that the inclusion probability may be different from the original probability.
24 |
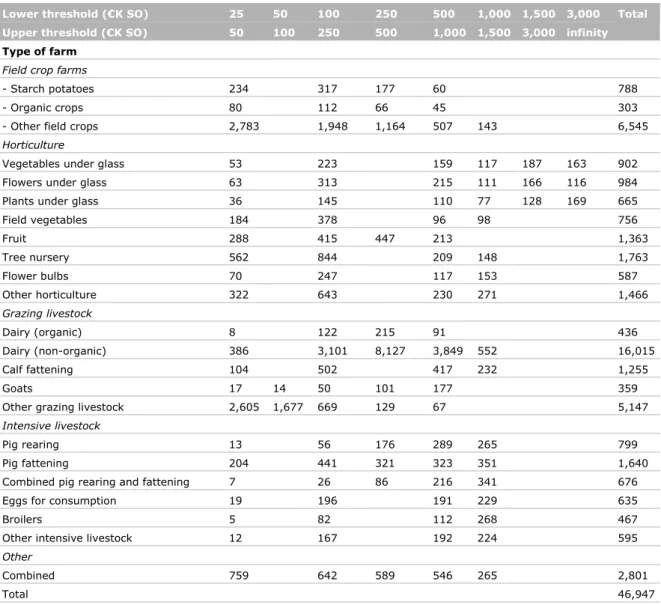
Wageningen Economic Research Report 2019-020Number of farms per stratum
Table A3.1 Number of farms per stratum (target population)
Lower threshold (€K SO) 25 50 100 250 500 1,000 1,500 3,000 Total
Upper threshold (€K SO) 50 100 250 500 1,000 1,500 3,000 infinity
Type of farm
Field crop farms
- Starch potatoes 234 317 177 60 788
- Organic crops 80 112 66 45 303
- Other field crops 2,783 1,948 1,164 507 143 6,545 Horticulture
Vegetables under glass 53 223 159 117 187 163 902
Flowers under glass 63 313 215 111 166 116 984
Plants under glass 36 145 110 77 128 169 665
Field vegetables 184 378 96 98 756 Fruit 288 415 447 213 1,363 Tree nursery 562 844 209 148 1,763 Flower bulbs 70 247 117 153 587 Other horticulture 322 643 230 271 1,466 Grazing livestock Dairy (organic) 8 122 215 91 436 Dairy (non-organic) 386 3,101 8,127 3,849 552 16,015 Calf fattening 104 502 417 232 1,255 Goats 17 14 50 101 177 359
Other grazing livestock 2,605 1,677 669 129 67 5,147 Intensive livestock
Pig rearing 13 56 176 289 265 799
Pig fattening 204 441 321 323 351 1,640
Combined pig rearing and fattening 7 26 86 216 341 676
Eggs for consumption 19 196 191 229 635
Broilers 5 82 112 268 467
Other intensive livestock 12 167 192 224 595
Other
Combined 759 642 589 546 265 2,801
Total 46,947
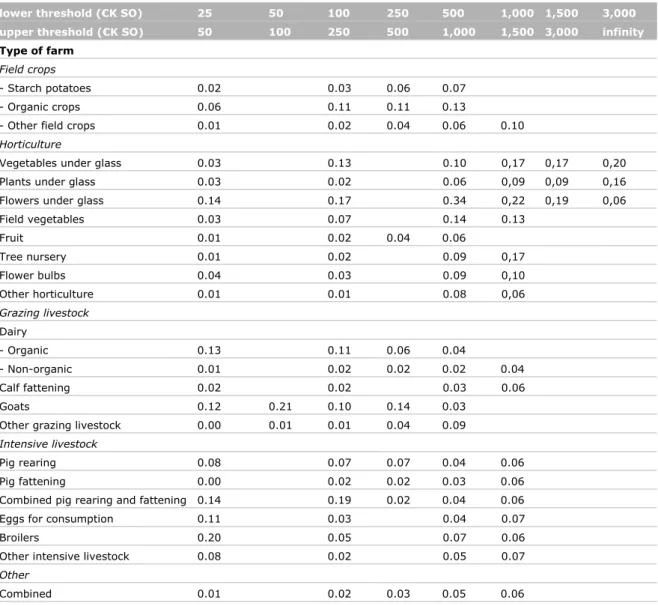
Sampling fractions
The sample is a disproportionate stratified sample. The term ‘disproportionate’ means that the chances of being included can vary between the strata. The chance of being included is calculated as the number of sample farms divided by the total number of farms in the target population. Table A4.1 shows that the sampling fractions are higher for greenhouse horticulture companies than they are for other sectors. Sampling fractions are higher in certain strata because the heterogeneity of farms in a particular stratum are high.
Table A4.1 Sampling fraction according to the 2016 Agricultural Census by stratum
lower threshold (€K SO) 25 50 100 250 500 1,000 1,500 3,000
upper threshold (€K SO) 50 100 250 500 1,000 1,500 3,000 infinity
Type of farm
Field crops
- Starch potatoes 0.02 0.03 0.06 0.07 - Organic crops 0.06 0.11 0.11 0.13
- Other field crops 0.01 0.02 0.04 0.06 0.10 Horticulture
Vegetables under glass 0.03 0.13 0.10 0,17 0,17 0,20 Plants under glass 0.03 0.02 0.06 0,09 0,09 0,16 Flowers under glass 0.14 0.17 0.34 0,22 0,19 0,06
Field vegetables 0.03 0.07 0.14 0.13 Fruit 0.01 0.02 0.04 0.06 Tree nursery 0.01 0.02 0.09 0,17 Flower bulbs 0.04 0.03 0.09 0,10 Other horticulture 0.01 0.01 0.08 0,06 Grazing livestock Dairy - Organic 0.13 0.11 0.06 0.04 - Non-organic 0.01 0.02 0.02 0.02 0.04 Calf fattening 0.02 0.02 0.03 0.06 Goats 0.12 0.21 0.10 0.14 0.03
Other grazing livestock 0.00 0.01 0.01 0.04 0.09 Intensive livestock
Pig rearing 0.08 0.07 0.07 0.04 0.06
Pig fattening 0.00 0.02 0.02 0.03 0.06
Combined pig rearing and fattening 0.14 0.19 0.02 0.04 0.06 Eggs for consumption 0.11 0.03 0.04 0.07
Broilers 0.20 0.05 0.07 0.06
Other intensive livestock 0.08 0.02 0.05 0.07 Other
26 |
Wageningen Economic Research Report 2019-020Response rate by type of
farm
Table A5.1 Response rate in different types of farm, recruitment for CSP variant, 2016
Farm types a) Total farms Unsuitable farms (%) Response rate (%)
Organic crops 20 25 20
Other field crops 33 33 6
Tomato 43 23 9
Sweet pepper 15 0 27
Other vegetables under glass 35 11 11
Plants under glass 25 24 16
Flowers under glass 89 20 4
Field vegetables 117 14 10 Flower bulbs 15 27 7 Tree nurseries 48 17 6 Fruit growing 18 28 11 Dairy farms 63 5 44 Veal calves 32 0 34 Goat farms 24 25 21 Pig rearing 50 12 16 Pig fattening 46 9 11 Broiler farms 12 8 25 Total 685 16 15
a) Only farm types with recruiting activities are displayed.
Table A5.2 Response rate by type of farm 2011-2015
Total farms Unsuitable farms (%) Response rate (%)
Organic crops 48 23 16
Starch potatoes 54 4 17
Other field crops 232 8 20
Vegetables under glass 266 10 17
Plants under glass 80 4 16
Flowers under glass 349 4 23
Field vegetables 231 5 7 Flower bulbs 140 4 19 Tree nurseries 119 1 14 Fruit 34 0 18 Dairy (organic) 2 0 100 Dairy (non-organic) 22 0 50 Calf fattening 89 0 26
Other grazing livestock 63 0 37
Pig rearing 79 5 31
Pig fattening 110 5 14
Combined pig rearing and fattening 94 1 22
Eggs for consumption 16 0 38
Broilers 13 0 38
Wageningen Economic Research P.O. Box 29703 2502 LS The Hague The Netherlands T +31 (0)70 335 83 30 E communications.ssg@wur.nl www.wur.eu/economic-research
Wageningen Economic Research REPORT
2019-020
The mission of Wageningen University & Research is “To explore the potential of nature to improve the quality of life”. Under the banner Wageningen University & Research, Wageningen University and the specialised research institutes of the Wageningen Research Foundation have joined forces in contributing to finding solutions to important questions in the domain of healthy food and living environment. With its roughly 30 branches, 5,000 employees and 10,000 students, Wageningen University & Research is one of the leading organisations in its domain. The unique Wageningen approach lies in its integrated approach to issues and the collaboration between different disciplines.