Title
The Healing Touch: Tools and Challenges for Smart Grid
Restoration
Author(s)
Liu, S; Hou, Y; Liu, C; Podmore, R
Citation
IEEE Power and Energy Magazine, 2014, v. 12 n. 1, p. 54-63
Issued Date
2014
URL
http://hdl.handle.net/10722/197839
54 ieee power & energy magazine 1540-7977/14/$31.00©2014IEEE january/february 2014 Digital Object Identifier 10.1109/MPE.2013.2285609
Date of publication: 17 December 2013
M
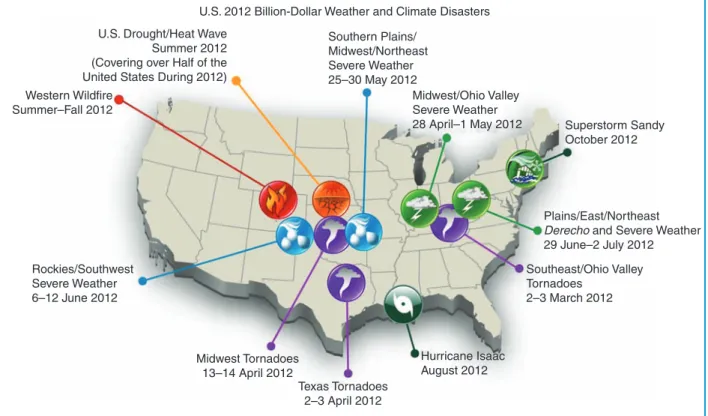
Major electric power disturbances can be triggeredby storms, heat waves, solar flares, and many other sources, but all have their roots in the mechanical, cyber, and human vulnerabilities of existing power grids. as shown in Figure 1, 2012 was a particularly bad year for extreme weather in the united states. an aging grid infrastructure only exac-erbates this problem by creating new concerns over energy reliability and grid resiliency. a single storm can cost billions of u.s. dollars in terms of direct damage to the grid, and it can cause significant power outage-related costs, including lost productivity.
it has been argued based on historical data and computer modeling that power grids are self-organized critical systems. these systems experience unavoidable disturbances that result in the loss of portions of the system or the entire system. this phenomenon has been attributed to steadily increasing load, reduced operating budgets and lower capital investment by power companies, and the technical limits of modern engineering.
“power delivery systems have a lot of parts, wires, transformers, and other components all nicely tied together—which means there are a lot of things that can go wrong,” explains clark gellings of the nonprofit electric power research institute (epri). “pieces break down, and people make errors. a system is designed to tolerate a certain amount of disruption, but past a certain point it’s simply gone too far, and it falls apart.”
epri has estimated that “across all business sectors, the u.s. economy is losing between us$104 billion and us$164 billion a year to outages.” by minimizing or eliminating interruptions, the self-healing grid could dramatically reduce this cost. widespread blackouts, such as the 2003 out-ages in the united states and italy, the 2006 outage in europe, or the mas-sive 2012 blackouts in india, are powerful reminders of the catastrophic consequences of power system outages.
Figure 2 shows the amount of load lost due to major blackout events in the united states for the years 1965 through 2003. all these blackouts had large adverse effects. For example, the great northeast blackout of 1965, which began when a power surge in new York near the ontario border set off a chain of failures across new York state and beyond, covered 80,000 mi2. “within four minutes, the line of darkness had plunged across Massachusetts all the way to boston,” The New York Times reported on the day of the outage. “it was like a pattern of falling dominoes—dark-ness sped southward through connecticut, northward into Vermont, new Hampshire, Maine, and canada.”
the need for an automated, self-healing grid has grown in recent years as the complexity and vulnerabilities of the interconnected grid increase. at present, system operators “manually” perform power system recovery or restoration following a major outage based on guidelines from a restoration plan prepared off-line that may or may not accurately address the scenario actually taking place. Further, such restoration work is time-consuming and highly stressful for system operators. the complex tasks of emergency
The Healing Touch
By Shanshan Liu,
Yunhe Hou,
Chen-Ching Liu,
and Robin Podmore
©Ey E wir E
Tools and
Challenges
for Smart
Grid
Restoration
56 ieee power & energy magazine january/february 2014 recovery require advanced decision-support tools to enhance
the resilience and, ultimately, the self-healing capabilities of a smart grid.
The Need for Smart Restoration
as shown in Figure 3, existing energy management systems (eMss) have been designed to operate the power system in three states: normal, emergency, and restoration. in the normal secure state, all equipment is operating within limits and no crit-ical contingency will cause real-time operating limit violations. in the normal insecure state, all equipment is operating within real-time limits, but one or more contingencies will cause oper-ating limit violations. in the emergency state, some equipment is operating outside of real-time operating limits. the restoration state is in effect when there has been a major outage.
the restoration state may be entered either as a result of con-tingencies that cause loss of customer load or as a result of delib-erate control actions taken to shed load in a portion of the system. control actions in the restoration state should be designed to steer the system back to the normal state but could inadvertently transition the system to an emergency state. current eMs appli-cations focus on providing operator decision-making tools for the normal secure and normal insecure states. there are few real-time tools that have been designed to support operator deci-sion making when the power system is undergoing a restoration process in the restoration state.
the development of smart grid technologies has been rapid as regards phasor measurement units (pMus), special
protection schemes, and wide-area situational awareness. it is time to further advance system restoration efforts so as to realize a self-healing grid with the aid of these technologies.
Large-Scale Restoration Drills
since the 2003 northeast u.s. blackout, a number of north american electric reliability corporation (nerc) reliabil-ity coordinators and transmission operators have been stag-ing comprehensive restoration drills. to support these drills, customer-specific models of individual power systems are built that include models of substation breakers; switch and bus configurations; models of the transmission system lines, transformers, and relays; models of the generators and prime movers; and models of the system loads. Models can be built by importing standard ciM/XMl or psse data formats.
the customer’s supervisory control and data acquisition (scada) and automatic generation control (agc) functions are emulated (rather than replicated) using the custom simu-lator software. the custom simusimu-lator’s scada one-line displays can use the same symbols, conventions, and layout as the real displays. the full model for a customer’s system often has several thousand buses and several hundred station one-line displays. this model can be set up and accessed by either a portable server or a web server over the internet.
restoration drills are highly realistic and designed so that the reliability coordinators, transmission operators, and balanc-ing operators can work with the substation operators, genera-tor operagenera-tors, and distribution operagenera-tors to resgenera-tore the system
U.S. 2012 Billion-Dollar Weather and Climate Disasters
Western Wildfire Summer–Fall 2012
U.S. Drought/Heat Wave Summer 2012 (Covering over Half of the United States During 2012)
Southern Plains/ Midwest/Northeast Severe Weather 25–30 May 2012 Midwest/Ohio Valley Severe Weather
28 April–1 May 2012 Superstorm Sandy October 2012
Plains/East/Northeast
Derecho and Severe Weather
29 June–2 July 2012 Southeast/Ohio Valley Tornadoes 2–3 March 2012 Hurricane Isaac August 2012 Texas Tornadoes 2–3 April 2012 Midwest Tornadoes 13–14 April 2012 Rockies/Southwest Severe Weather 6–12 June 2012
from a complete or partial blackout. the lessons learned from these drills have demonstrated the difficult challenges of man-aging electric islands. this has served as a catalyst for new ideas about how smart grid technologies may be able to auto-mate and expedite future system restoration procedures.
Smart Restoration
“decision support tools must be highly flexible and adaptive to allow ever-changing power grid conditions to be reflected through seamless collaboration between human operators and computer-based optimization tools,” says chen-ching liu, of washington state university. power system restoration follow-ing a widespread outage is a highly complex task for both plan-ners and operators. decision-making or decision support tools are therefore in great need for both online and off-line purposes. decision making for power system restoration was among the earliest applications of intelligent system techniques. the prog-ress of such tools has been slow, however, particularly for the online environment. one major hurdle is that the decision-mak-ing tools may not have sufficient information about the status of power grid elements as system restoration progresses. as a result, the recommendations from the decision-making tools may be inaccurate or obsolete. a simple example is the status of unmonitored manual switches or breakers. dispatchers are in contact with field crews, so the status of these devices is known to them—but there is no mechanism for updating the status for the software decision-making tools in a timely man-ner. it is important that software tools play the role of decision support while the decisions themselves are made by dispatch-ers. in other words, software tools provide computational and logic-reasoning information for
the various options dispatchers are considering. Making this adjust-ment requires closer collaborations among dispatchers, restoration plan-ners, and smart restoration tools.
the other challenge of designing smart restoration tools is including the capability to adapt to different power systems and their respective system restoration strategies. even for the same power grid, the out-age conditions and the availability of power system facilities can vary significantly. a smart restoration decision support tool must be able to meet the needs of different power systems and various grid operating conditions. based on the results of recent epri projects, the concept of generic restoration milestones (grMs) has been developed, and the corresponding software mod-ules have been tested with scenar-ios from large power grids. these
decision support tools relieve the dispatchers from tedious tasks and ensure that detailed simulations are performed before deci-sions are made. we believe that the grM decision support soft-ware tools represent a breakthrough in concept and technology development for smart restoration.
the grM concept provides a methodology for develop-ing smart software tools for decision support durdevelop-ing power system restoration. the actual implementation will be enabled by emerging smart grid technologies. although power system restoration involves a large number of generators, transmis-sion and distribution facilities, loads, and system constraints, the actual restoration process can be broken down into a num-ber of distinct phases. each of the phases and the associated technologies that enable smart restoration is reviewed below.
Secure Normal State Insecure Normal State Corrective Control Preventive Control Emergency Control Restorative Control Restoration State Emergency State Cascade Events
Transition Due to Control Action Transition Due to a Disturbance
figure 3. The operation states of a power system.
2003 NE 1996 WSCC 1965 NE 1982 WSCC 1996 WSCC 1977 NYC 70 60 50 40 30 20 10 0 0 10 20 30 40 50 60 Duration (h) Load Lost (GW)
figure 2. Major blackout events in the United States and their associated impacts in terms of load lost. NE = Northeast; NYC = New York City; WSCC = West Coast; MW = Midwest.
58 ieee power & energy magazine january/february 2014 Assessment of Power System Conditions
Following a major power system disturbance, the first prior-ity is to assess system conditions. this critical task involves answering several questions:
✔ what are the statuses and characteristics of all gener-ating units online or tripped off-line?
✔ what are the statuses of neighboring power systems and tie lines?
✔ what, if any, system load is still being served?
✔ if portions of the system are still energized, are fre-quency, voltage, and equipment loadings within accept-able limits?
✔ what are the boundaries of any islanded systems? Identifying Electrical Islands
Methods are needed to accurately and reliably identify the extent of electrical islands. the identification can be accom-plished using a combination of breaker and switch statuses with phasor measurements.
in the first pass, the electrical islands can be determined by running a conventional network topology program on the measured breaker and switch positions. in the second pass, dynamic pMu quantities can be compared over time and the buses that are in the same electrical island can be identified.
eMs overview displays have the ability to show differ-ent islands in differdiffer-ent colors. warnings can be provided in the event that a system operator selects a breaker that will connect two islands. summary displays can also show the amount of generation capacity, which generators are con-nected, and the load that is connected in each island. Topology and State Estimation
a successful restoration plan relies on accurately tracking net-work topology. topology error identification has historically been performed manually as a post processing step following the convergence or nonconvergence of the state estimator. the errors in breaker and switch status can be detected by means of highly reliable pMu data. as a result, operators can avoid mistakes that may lead to another outage event.
Preparation of Subsystems
before starting the actual restoration of the power system it is necessary to take several preliminary steps. For genera-tion that has remained online, operators must
✔ adjust the voltage and frequency of online generators so they are within acceptable limits
✔ place agc control in manual mode if it has not auto-matically tripped to manual mode
✔ address any power system overloads quickly, so that all equipment is operating within acceptable limits
✔ establish appropriate levels of operating reserve as soon as possible.
For generators that have recently tripped, operators must
✔ establish, if possible, a source of on-site power for each generator’s auxiliary loads
✔ ensure that the generator has safely shut down (a list of items to check for each generator should be included in the generator’s restoration plan)
✔ review any generator alarms for relevant information
✔ determine whether the generator is available for restart.
For generators with black-start capability, operators must
✔ review any generator alarms for relevant information
✔ check that the generator is available for restart
✔ start any necessary on-site emergency generation for the generator’s auxiliary equipment
✔ prepare the generator for a black start.
For generating units that are not in service, operators must
✔ review any generator alarms for relevant information
✔ check the availability of the generator for start-up. Dead Bus Clearing
in the dead bus-clearing phase, the circuit breakers connect-ing two dead buses are “all opened,” with the goal of ensur-ing that equipment can later be energized without any risk of inadvertently connecting unplanned load or line charging. For a large system, this phase may take several hours. some utilities have implemented special relays in the substations or group control procedures on their eMss to minimize the time and operator involvement for this step.
Restoration Building Blocks
a restoration building block is a minimal configuration with a stable source of power. one example is a black-start unit or an energized interconnection point with some associ-ated transmission that can serve as a viable subsystem for rebuilding the overall power system.
a restoration building block should have the following characteristics:
✔ a black-start capability sufficient to restore light and power to critical equipment
✔ the ability to match generation to load within fre-quency limits
With the implementation of such decision support tools,
the power grid will be better prepared and equipped
to handle extreme events.
✔ adequate voltage controls and ability to dynamically provide megavars (Mvars) to maintain voltages within limits
✔ the capability of being monitored at the system control center.
the capacity of a restoration building block to affect the overall restoration plan can be measured in two ways:
✔ the total Mw capacity of the generating units will determine the amount of load that can be energized.
✔ the total Mvar absorption capability and the source impedance of the generating units will determine the length of the eHV transmission lines that can be energized.
restoration building blocks have always been formed by using a single generating unit or power plant. the amount of transmission that can be energized is then limited by the Mvar absorption capacity of the black-start generating units as well as the minimum source impedance required to prevent transient over voltages. with phasor measurements and advanced governing control systems, it is feasible that a more extensive transmission corridor could be energized by simultaneously synchronizing generating units at multiple locations. the multiple generators would be able to combine their Mvar absorption capability so that a greater span of transmission circuits could be energized. Expansion of Electrical Islands
once one or more stable restoration building blocks are built, these can be expanded as electrical islands. the number of generation-load islands that can be built in parallel is usu-ally matched to the number of control desks that are involved in the restoration. the expansion of each island requires the focused attention and supervision of one or two power system operators. the size of the islands can be determined in the planning stage, or they can evolve based upon the progress made by the crew at each operating console.
current restoration methods use a manual approach to con-trolling the frequency of electrical islands. a single isochronous unit is designated for each electrical island. the unit operator monitors the unit frequency and manually controls the gover-nor reference motor to maintain the island at the designated frequency. automatic island frequency-control programs can be developed to control multiple units in an island to ensure that frequency deviations following the addition of load blocks are minimized. prior to adding load blocks, the automatic island frequency-control program may direct the units to preposition frequency to a value greater than 60 Hz. this will increase the minimum frequency value that occurs after the load is added and thus limit damage to steam unit turbine blades.
Combine Electrical Islands
electrical islands are currently tied together using breakers with synch-check relays. the frequency difference between the islands needs to be minimized in order to control the synchroniz-ing angle and limit the flow between the islands after synchro-nization. some utilities prefer to perform the synchronization at
generating stations since the operators at these stations are more familiar with the operation of synch-check relays.
a virtual synchroscope could be developed based on phasor measurements and power and angle calculations to remotely monitor any breaker in the system. the virtual synchroscope would allow synchronization operations to be performed manually or under program control from a remote location using any breaker in the system.
Reintegrate with Neighboring Systems
integration with neighboring utility systems offers the oppor-tunity to significantly increase the amount of online generat-ing capacity and system inertia. this may greatly increase the overall stability of the system and its ability to withstand major contingencies, such as the trip of a large generating unit.
integration with neighboring systems requires coordination between different transmission operators and often requires review and approval by a regional transmission organization. the frequency difference between the systems also needs to be minimized in order to control the synchronizing angle and limit the flow between the systems after synchronization.
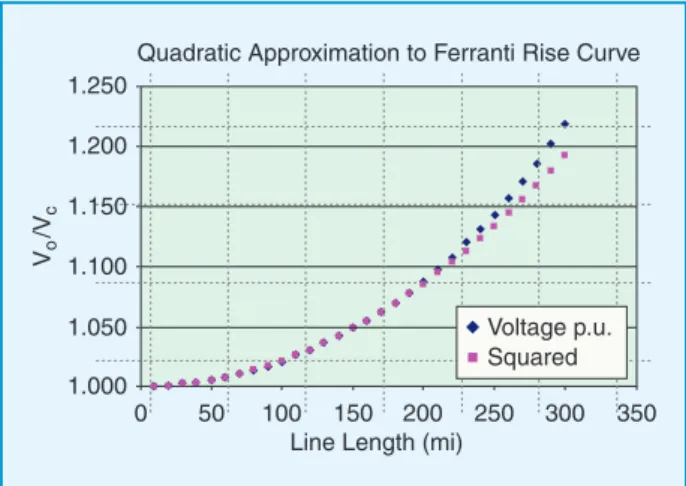
Ferranti rise is a function of line length. Figure 4 shows the voltage at the open end divided by the voltage at the close end. a quadratic approximation provides a useful rule of thumb. a Ferranti rise of 5% occurs for lines of 150 mi. a Ferranti rise of around 20% occurs for lines of 300 mi. if a line is simul-taneously energized from both ends, the Ferranti rise at the midpoint will be 25% of the Ferranti rise when energized from just one end. by arming breaker operations to occur simulta-neously and by adding a synchroscope to measure the angle difference between buses at the ends of the line, it is possible to synchronize islands with very long lines while limiting the Ferranti rise at the midpoint.
Complete Restoration of Customer Loads load is typically restored based on the technical needs of the power system. initial load restoration is focused on pro-viding load to online generators, dampening voltage tran-sients, and consuming excess Mvars. the loads restored are
1.250 1.200 1.150 1.100 1.050 1.000 0 50 100 150 200 Line Length (mi)
Quadratic Approximation to Ferranti Rise Curve
Vo /Vc
250 300 350
Voltage p.u. Squared
60 ieee power & energy magazine january/february 2014 selected based on size, ability to be quickly switched, and
location in the energized system.
Higher-priority customer loads are typically energized once system conditions are such that they can be accommo-dated. care must be taken to ensure that in the haste to restore high-priority loads the energized system is not placed in jeop-ardy of another shutdown. as the restoration progresses, addi-tional loads are picked up based on their relative priority. as more substations are energized, larger blocks of load can be reliably picked up by online generating units. Frequently, a gradual transition occurs from picking up load based on tech-nical needs to picking up load based on load priority. there may be a need to strip some of the load from heavily loaded feeders before they can be restored to service. eventually, cus-tomer loads are picked up based exclusively on load priority.
The Road to a Future Self-Healing Grid
global positioning satellite (gps) technology needed decades to become commercially utilized in navigation sys-tems. similarly, advanced technologies will be applied to system restoration applications in a gradual manner.Developing Decision Support Tools for Restoration Planning
this first stage is to develop an off-line decision support tool for restoration planning. the major task is to develop tools for finding the sequence of generating units, transmission lines,
and loads to be put online during a system restoration. For instance, the well-known node-branch-based power system model can be employed. Many widely used power system analysis tools are built on this model, which can describe the topology of a power grid. as a multistage and multiobjective problem, it is difficult to establish a uniform model to cover all constraints and objectives, however. an alternative methodol-ogy is to separate the problem into a series of subproblems. by integrating the results of each subproblem, an optimal strategy for a system restoration may be constructed with an acceptable outlay of computing time. during this process, the various characteristics of generating units, loads, and branches should be carefully modeled and reflected in analyses so as to meet steady-state requirements and both electromechanical and electromagnetic transient constraints.
prototype off-line decision tools have been devel-oped. For instance, with support from epri, a toolbox called system restoration navigator (srn) has been developed based on the grM algorithms. currently, the main objective of srn is to establish a feasible sequence, with acceptable duration, for cranking all non-black-start (nbs) generating units and picking up all critical loads. there are three running modes of the srn core algorithm:
automatic mode, which tries to find a feasible restoration sequence; iterative mode, which tries to crank one gen-erating unit or critical load assigned by the user (srn figures out the whole restoration sequence step by step,
SCADA
Power Grid Data
Node-Branch-Based Power Grid Model
Decision Support Toolboxes SRN Restoration Dispatch Actions OTS Steady-State Constraints Detailed Physical Model of Power Grid Electromechanical Transient Constraints Restoration Strategy
with iteration input from the user); and advisory mode, in which, as in iterative mode, the restoration sequence is calculated step by step. the enhancement offered by this last mode is that srn will provide an optional set of nbs units and critical loads. the components in this set can be restored successfully in the next step. this helps the user filter out infeasible restoration actions in the coming step. For all these modes, srn checks the steady-state constraints and the electromechanical transient stability constraints for each step.
Updating Decision Support Tool for System Operators
once restoration tools are available for planning, the next stage is to bring the decision support system for the planner closer to real-time online application. with a sufficiently detailed physical power grid model including breakers, switches, busbars, and so on, the established restoration strategies can be used by system operators after an outage. in this stage, more realistic system models and more con-straints are to be taken into account in the dispatchers’ point of view.
epri has a two-phase effort to integrate the srn algorithms with an operator training simulator (ots). in the first phase, the minimum path search algorithm has been implemented to find feasible and direct paths between black-start units and secondary units and to find the nearest load to bring gener-ating units up to their minimum opergener-ating limits. the srn algorithm can be used with the ots in an operator advisory mode for training purposes. it can also be used with the ots in automatic restoration mode—for example, to develop and verify restoration plans and build partially energized islands for training scenarios. in the automatic restoration mode, srn can reduce the labor needed to verify restoration plans and cre-ate training scenarios by a factor of ten. in the second phase, the srn optimal power flow algorithm will be used to mitigate overloads and voltage stability issues that may tend to occur in the later phases of a system restoration plan, where the loads are higher but all the transmission is not yet in service. the effort is shown in Figure 5.
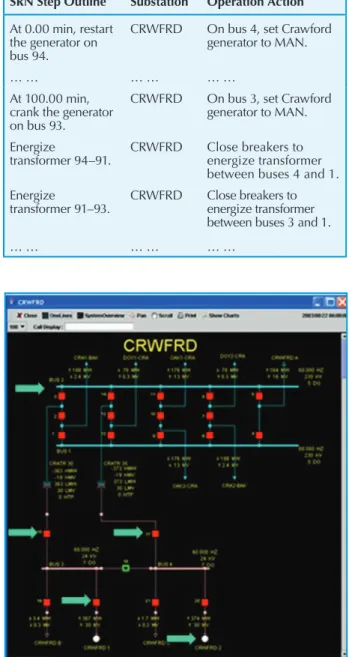
the power and light company test system is used as an example. table 1 shows a part of the sequence generated by srn and the mapping to the simulator actions.
Following the instructions in table 1, the dispatchers can execute dispatch actions via the one-line diagram in ots and observe the consequence of each action (see Figures 6 and 7). Developing a Real-Time System
Restoration Navigator
the final stage is to develop a real-time system restora-tion navigator for online dispatch in response to extreme events. such a navigator would have the ability to identify system status, efficiently compute the restoration action sequence, execute restoration actions automatically or under the instruction from dispatchers, acquire the system’s state
following each restoration action, and so on. in other words, this navigator would serve as a core application: a closed-loop control in the system restoration process.
Benefits and Challenges
What Are the Costs and the Cost Savings?
the decision support system for power system restoration serves as the essential component for the future self-healing smart grid. as an extension of traditional power monitor-ing and control, it will integrate more advanced theory and technology. part of the cost of the self-healing grid will be incurred in modernizing the grid infrastructure to support
figure 6. Operation actions in OTS.
table 1. The sequence generated by SRN and OTS. SRN Step Outline Substation Operation Action
At 0.00 min, restart the generator on bus 94.
CRWFRD On bus 4, set Crawford
generator to MAN.
… … … …
At 100.00 min, crank the generator on bus 93.
CRWFRD On bus 3, set Crawford
generator to MAN. Energize
transformer 94–91. CRWFRD Close breakers to energize transformer
between buses 4 and 1. Energize
transformer 91–93. CRWFRD Close breakers to energize transformer
between buses 3 and 1.
62 ieee power & energy magazine january/february 2014 self-healing. the benefits of the self-healing grid to
soci-ety, utilities, consumers, and employers are likely to exceed the investments, however. these benefits are summarized briefly below.
Economics
✔ improved system reliability can reduce the economic losses incurred by consumers when power is lost.
✔ utilities can avoid the large lost revenues caused by high congestion or unplanned outages.
✔ More efficient operation makes the system more flex-ible, leading to reductions in electrical losses and maintenance costs.
Security
the self-healing characteristics of the smart grid can decrease the threat of unexpected attack due to self-healing technologies and the distribution of sources.
✔ More advanced monitoring, distributed energy resources, and demand response all contribute to a more robust system that is more resilient to cyber attack
✔ the weaknesses of the smart grid can be identified by modern analytical tools and then integrated into the security plan.
Safety
the grid’s self-healing characteristics can enhance public safety. For example, quick restoration can provide the neces-sary electricity to critical loads like hospitals.
Environmental
smart grids can support more green resources, which can reduce emissions substantially. in addition, the environmen-tal impact of accidents like transformer fires and oil spills can be avoided by means of accurate equipment failure pre-diction and prevention.
The Challenge of Variable Renewable Resources
to accommodate higher penetrations of variable renewable energy resources, changes to traditional system restoration methodologies will be required. Fundamentally, conventional generation resources have relatively predictable operating per-formance. as a result, restoration strategies in the traditional energy paradigm are based on the assumption that the output of each generating unit is controllable or predictable. this assumption is questionable in systems with a high percentage of variable renewable energy resources. according to nerc, two major attributes of renewable energy resources will affect power system planning and operation: variability and uncer-tainty. generally, however, a generating unit, whether conven-tional or renewable, should present several benefits to system restoration. these are summarized below.
Black-Start Capacity
compared with the normal operating condition, the system is weaker during the beginning stage of system restoration, with less control over frequency and voltage. at present, vari-able energy resources are not recommended as black-start
capacity. some standards do not allow the reconnection of variable energy resources at the beginning of system restora-tion. disconnection of wind generation units connected to the distribution grid is usually less strict than for units con-nected to the transmission grid, i.e., units on the transmission grid are disconnected at a smaller frequency deviation. when the frequency deviation reaches the threshold values of the units’ protection, they are automatically disconnected from the grid. smart grid technologies, however, may permit utili-ties to use variable renewable resources for black starts. Load Restoration
after the system is restored with sufficient strength, vari-able renewvari-able energy resources can be used for load pickup. Variable energy resources could provide power to restore load as long as they satisfy all general requirements, i.e., those regarding voltage regulation, low- and high-voltage ride-through, effective inertia, controllability for ramping and curtailing output, and frequency control.
a sophisticated operating methodology should be estab-lished to meet the recent dramatic development of variable renewable generation, mainly in the form of wind farms. otherwise, the integration of uncontrollable wind generation may have a negative impact on system restoration under the current system operation methodology. a european union report on the coordination of transmission of an electricity disturbance on 4 november 2006 shows that the unexpected reconnection of uncontrollable wind capacity had a very negative impact, preventing the dispatchers in both areas from managing the situation effectively.
the following two suggestions therefore make sense from the point of view of power system restoration after a major outage.
✔ sophisticated control methods should be used to improve the frequency and voltage response perfor-mance of renewable energy resources before they can be used in system restoration.
✔ since the system is much weaker during system res-toration, standards that are different from the regular operating conditions should be established to meet these critical requirements.
Other Considerations
the growing interconnections among different elements of the infrastructure (e.g., communications, economic mar-kets, and transportation) and their complex interdependen-cies could cause a blackout and affect more than one critical
infrastructure. addressing this interconnected nature of infra-structure requires an even more integrated approach than is presently possible. a good example is the dependencies that exist among power, communications, and it infrastructures.
Conclusions
effective system restoration is an important step toward a self-healing smart grid. in the future energy paradigm, with a high penetration of renewable resources and responsive demands, variability and uncertainty will affect power sys-tem operating and recovery technologies. smart restoration provides an adaptive and optimized strategy with which to make restoration decisions, one that will reduce restoration time while maintaining system integrity.
with the implementation of such decision support tools, the power grid will be better prepared and equipped to handle extreme events. they enable the streamlining of communication among all stakeholders, and they preserve knowledge and experience for future engineers.
For Further Reading
ergeg Final report. (2007). the lessons to be learned from the large disturbance in the european power system on the 4th of november 2006. [online]. available: http://www. energy-regulators.eu/portal/page/portal/eer_HoMe/ eer_publications/ceer_papers/electricity/2007/ e06-bag-01-06_blackout-Finalreport_2007-02-06.pdf
c.-c. liu, w. sun, Y. Hou, and s. liu. (2011). putting into practice the dream of a self-healing smart grid. [online]. available: http://smartgrid.ieee.org/september-2011/53-putting- into-practice-the-dream-of-a-self-healing-smart-grid
r. podmore. smart grid restoration concepts. presented at 2010 ieee power and energy society general Meet-ing, Minneapolis, Mn, pp. 25–29, july 2010. [online]. available: http://ieeexplore.ieee.org/xpl/mostrecentissue. jsp?punumber=5577387
Biographies
Shanshan Liu is with the electric power research institute
(epri), palo alto, california.
Yunhe Hou is with the university of Hong Kong. Chen-Ching Liu is with washington state university,
pullman, washington.
Robin Podmore is with incremental systems
corpora-tion, washington.
p&e