Downloaded from: http://researchonline.lshtm.ac.uk/4645575/ DOI:10.1002/cncr.31025
Usage Guidelines
Please refer to usage guidelines at http://researchonline.lshtm.ac.uk/policies.html or alterna-tively contactresearchonline@lshtm.ac.uk.
Population-based cancer survival in the US: data, quality control and statistical methods
Journal: Cancer
Manuscript ID CNCR-17-0468.R1
Wiley - Manuscript type: Supplement Article
Date Submitted by the Author: 16-May-2017
Complete List of Authors: Allemani, Claudia; London School of Hygiene and Tropical Medicine, NCDEU Harewood , Rhea; London School of Hygiene and Tropical Medicine
Spika , Devon; London School of Hygiene and Tropical Medicine Johnson, Christopher; Cancer Data Registry of Idaho,
Bonaventure, Audrey; London School of Hygiene and Tropical Medicine, NCDEU
Ward, Kevin; Emory University,
Carreira, Helena; London School of Hygiene and Tropical Medicine
Weir, H.K.; Centers for Disease Control and Prevention, National Center for Chronic Disease Prevention and Health Promotion
Coleman, Michel; London School of Hygiene and Tropical Medicine, NCDEU
Keywords: cancer, population-based, survival, statistical methods, NPCR, SEER
1
Population-based cancer survival in the US: data, quality control and statistical methods
Claudia Allemani,1 Rhea Harewood,1 Chris Johnson,2 Helena Carreira,1 Devon Spika,1 Audrey Bonaventure,1 Kevin Ward,3 Hannah K Weir,4 Michel P Coleman1
Running title: Data, quality control and statistical methods
Keywords: cancer, population-based, survival, statistical methods, NPCR, SEER
1
Cancer Survival Group, Department of Non-Communicable Disease Epidemiology, London School of Hygiene and Tropical Medicine, Keppel Street, London WC1E 7HT, UK
2
Cancer Data Registry of Idaho, Boise, ID, USA
3
Georgia Center for Cancer Statistics, Emory University, Atlanta, GA, USA
4
Division of Cancer Prevention and Control, National Center for Chronic Disease Prevention and Health Promotion, Centers for Disease Control and Prevention, 4770 Buford Highway, Atlanta, GA 30341, USA
Correspondence: Claudia Allemani, Cancer Survival Group, Department of Non-Communicable Disease Epidemiology, London School of Hygiene and Tropical Medicine, Keppel Street, London WC1E 7HT, UK. Tel +44 20 7927 2855
Claudia.Allemani@lshtm.ac.uk
Abstract Words:248 Now 253 to address reviewers’ concerns. Text Words:
Text pages Tables: 3 Figures: 2
DISCLAIMER: The findings and conclusions in this report are those of the authors and do not necessarily represent the official position of the Centers for Disease Control and Prevention. 3 4 5 6 7 8 9 10 11 12 13 14 15 16 17 18 19 20 21 22 23 24 25 26 27 28 29 30 31 32 33 34 35 36 37 38 39 40 41 42 43 44 45 46 47 48 49 50 51 52 53 54 55 56 57 58 59 60
2
FUNDING SUPPORT: US Centers for Disease Control and Prevention (CDC; 12FED03123, ACO12036).
CONFLICT OF INTEREST DISCLOSURES: None
Precis for use in the Table of Contents: Population-based cancer survival is a key measure of the overall effectiveness of health systems in managing the cancer burden. The high quality of US cancer registry data, 80% population coverage in the CONCORD-2 study and the use of an unbiased estimator of net survival ensure that the survival trends we report are robustly comparable by race and state. These results can be used to plan and evaluate cancer control strategy, in each state and for the US nationally.
3 4 5 6 7 8 9 10 11 12 13 14 15 16 17 18 19 20 21 22 23 24 25 26 27 28 29 30 31 32 33 34 35 36 37 38 39 40 41 42 43 44 45 46 47 48 49 50 51 52 53 54 55 56 57 58 59 60
3
Abstract
Background: Robust comparisons of population-based cancer survival estimates require tight adherence to study protocol, standardized quality control, appropriate life tables of background mortality, and centralized analysis. The CONCORD program established worldwide surveillance of population-based cancer survival in 2015, analyzing individual data on 26 million patients (10 million US patients) diagnosed 1995-2009 with one of 10 common malignancies.
Methods: In this Supplement, we analyzed data from 37 state cancer registries covering approximately 80% of the U.S. population that participated in CONCORD-2. We performed data quality checks in three consecutive phases: protocol adherence, exclusions, and editorial checks. We estimated 1-, 3- and 5-year age-standardized net survival using the Pohar Perme estimator and state- and race-specific life tables of all-cause mortality for each year. We adopted the cohort approach for patients diagnosed 2001-2003 and the complete approach for patients diagnosed 2004-2009.
Results Articles in this Supplement report population coverage, data quality indicators and age-standardized 5-year net survival by state, race and stage at diagnosis. Examples of tables, bar-charts and funnel plots are provided in this article.
Conclusions Population-based cancer survival is a key measure of the overall effectiveness of services in providing equitable health care. The high quality of US cancer registry data, 80% population coverage and use of an unbiased net survival estimator ensure that the survival trends reported in this Supplement are robustly comparable by race and state. The results can be used by policy-makers to identify and address inequities in cancer survival, in each state and for the US nationally.
3 4 5 6 7 8 9 10 11 12 13 14 15 16 17 18 19 20 21 22 23 24 25 26 27 28 29 30 31 32 33 34 35 36 37 38 39 40 41 42 43 44 45 46 47 48 49 50 51 52 53 54 55 56 57 58 59 60
4
INTRODUCTION
Population-based cancer survival is a measure of the overall effectiveness of the health system in in dealing with cancer.1 Comparisons of population-based cancer survival require adherence to a well-designed protocol, standardized quality-control procedures, appropriate life tables of background mortality and centralized analysis with the latest statistical methods.2, 3
CONCORD-2 established world-wide surveillance of cancer survival in 2015, with estimates of 5-year net survival based on individual data for more than 25 million cancer patients (about 10 million patients in the US) diagnosed during 1995-2009 with one of ten common cancers: stomach, colon, rectum, liver, lung, breast (female), cervix, ovary, prostate and leukemia in adults (15-99 years), and acute lymphoblastic leukemia in children (0-14 years).3 Patients were followed up to Dec 31, 2009.
For the articles in this Supplement, we analyzed data from 37 statewide cancer registries (27 funded by the National Program for Cancer Registries (NPCR) program, 5 funded by the Surveillance, Epidemiology and End Results (SEER) program and 5 funded by both NPCR and SEER) that participated in CONCORD-2, covering approximately 80% of the U.S. population, and which agreed to the inclusion of their data in more detailed analyses by stage at diagnosis and by race. The CONCORD protocol required data on stage only for patients diagnosed from Jan 1, 2001, therefore these analyses, focused mainly on survival by stage, were restricted to patients diagnosed during 2001-2009.
Public health surveillance using the data from population-based cancer registries is a key component of cancer control.4 The North American Association of Central Cancer Registries (NAACCR)a develops and promotes uniform data standards for all cancer registries in North America. Participating US registries had to meet the NAACCR certification criteria and to have conducted record linkage with both the state vital records and the National Death Index (NDI) to update the vital status of registered patients. NAACCR members developed a detailed SAS program to map the NAACCR database record structure to the CONCORD protocol and thus to enable all North American registries to exclude cases that would not have been considered reportable primaries according to the International Association of Cancer Registries (IACR) multiple primary rules,5 before their datasets for 1995–2009 were extracted for CONCORD-2. This was necessary because North American registries define
a http://www.naaccr.org/standardsandregistryoperations/volumeii.aspx 3 4 5 6 7 8 9 10 11 12 13 14 15 16 17 18 19 20 21 22 23 24 25 26 27 28 29 30 31 32 33 34 35 36 37 38 39 40 41 42 43 44 45 46 47 48 49 50 51 52 53 54 55 56 57 58 59 60
5
multiple primary cancers under the rules of the Surveillance, Epidemiology and End Results (SEER) program,6 whereas registries in the European Network of Cancer Registries (ENCR) and in other continents generally use the rules of the IACR,5 which are more conservative. Topography and morphology were coded according to the International Classification of Diseases for Oncology (3rd edition; ICD-O-37). Solid tumors were defined by anatomical site (Table 1). For ovarian cancer, we included the fallopian tube, uterine ligaments, and adnexa, and the peritoneum and retroperitoneum, where high-grade serous ovarian carcinomas are often detected; this was done to improve international comparability of the data sets. Kaposi’s sarcoma and solid tumors with lymphoma morphology were excluded from analysis.
Leukemias were defined by morphology. In this Supplement we cover only precursor-cell acute lymphoblastic leukemia in children (ICD-O-3 morphology codes 9727, 9728, 9729, 9835, 9836, 9837). Estimates of survival by race, state and sub-type of adult leukemia will be presented in other publications.
Only primary invasive cancers (ICD-O-3 behavior code 3) were included in survival analyses. We included cancers at a given site regardless of whether the patient had had a previous cancer. If a patient was diagnosed with two or more cancers of a given organ, including paired organs, during 2001-2009, only the first was considered in survival analyses. Follow-up
US registries were asked to submit follow-up data (vital status and date of last known vital status) as at Dec 31, 2009, after conducting linkages of all cancer registrations with both state vital records systems and the NDI. Patients whose cancer registration could not be linked to a death record were considered to be alive on Dec 31, 2009 (passive follow-up, also known as the “presumed alive” method).
SEER registries are required to meet a specific standard for the completeness and recency of follow-up. At least 90% of registered patients not known to be deceased were required to have a date of last known vital status on or after Jan 1, 2010. These follow-up dates could have been obtained from either passive or active follow-up.8
Patients whose survival time was unknown were excluded from analyses. This group comprised patients registered solely from a death certificate or diagnosed at autopsy.
3 4 5 6 7 8 9 10 11 12 13 14 15 16 17 18 19 20 21 22 23 24 25 26 27 28 29 30 31 32 33 34 35 36 37 38 39 40 41 42 43 44 45 46 47 48 49 50 51 52 53 54 55 56 57 58 59 60
6
CONCORD-2 data quality control: three phases
We performed data quality checks in three consecutive phases: protocol adherence, exclusions, and editorial checks. After each phase a detailed report was sent to each cancer registry.
Phase 1: Protocol adherence
We first checked the compliance with the CONCORD-2 protocol of each of 37 variables (demographic characteristics, basis of diagnosis, date of diagnosis, topography, morphology, behavior, stage, vital status, date of last known vital status) in each tumor record in each data set. Any value not specified in the protocol was considered non-compliant. Each registry was sent a table of the number of records and the percentage compliance for each variable, and for each cancer. Minor issues were corrected by the CONCORD Central Analytic Team, after discussion with the registry. For major structural issues, 5 registries corrected and re-submitted their data.
Phase 2: Exclusions
Next, we checked for logical inconsistencies between the variables in each tumor record, for each cancer site. Exclusion criteria were defined a priori, based on the experience within the Cancer Survival Group, the checks performed in the first CONCORD study, the EUROCARE (EUROpean CAncer REgistry based study on survival and care of cancer patients) data quality checks, the checks proposed by the International Agency for Research on Cancer (IARC), the descriptions of morphology in the World Health Organization (WHO)/IARC Classification of Tumors for each cancer and, finally, clinical expertise.3
We produced “exclusion tables” summarizing the quality of each data set. Data quality indicators were tabulated separately for patients diagnosed in 1995-99, 2000-04 and 2005-09, to enable evaluation of trends in data quality over time. We defined three broad categories for exclusion: ineligible (e.g., in situ neoplasm), definite error (e.g., sex-site mismatch) and possible error (e.g., apparent inconsistency between site and morphology). We had requested records of in situ neoplasms to assess the intensity of diagnostic activity, particularly for cancers of the breast and cervix, but in situ neoplasms were not included in survival analyses. The number and percentage of patients excluded from analysis are shown in Table 2.
3 4 5 6 7 8 9 10 11 12 13 14 15 16 17 18 19 20 21 22 23 24 25 26 27 28 29 30 31 32 33 34 35 36 37 38 39 40 41 42 43 44 45 46 47 48 49 50 51 52 53 54 55 56 57 58 59 60
7
The majority (99.6%) of patients only had a single tumor record for any one cancer during 1995-2009. However, since a small proportion of patients had more than one tumor record for a given cancer (“multiple tumor, same site”), it was necessary to apply the quality control checks to every tumor record independently before selecting the single tumor record to be included in survival analyses. For example, if a woman had an in situ neoplasm of the breast diagnosed in 2001 followed by an invasive primary breast cancer in 2007, the invasive cancer record was selected for inclusion in the analyses, provided it was free of error.
Phase 3: Editorial tables
We evaluated the distribution of key data quality indicators for each cancer and for each registry. These indicators included the proportion of cancers in the final data set that had been microscopically verified and the proportion of patients who had been lost to follow-up. We also checked the distributions of the day and the month of the dates of birth, diagnosis and last known vital status. These distributions should be flat, since one would expect about 8% of births, diagnoses and deaths to occur in each month, and about 3% on each day of a given month, except days 28-31: spikes in these distributions, often on the 1st, 15th or 16th day of the month, or for June or July, help to identify where registries had imputed missing elements of each date.
Table 2 provides a summary of the exclusions and data quality indicators for adults (15-99 years) diagnosed during 1995-2009 with one of 9 common cancers (all solid cancers), by US state. The calendar periods within which survival analyses could be performed by stage at diagnosis were constrained by the availability of data on stage only from 2001, and the change in coding from 2004 (see below). Therefore, the periods for which data quality indicators are presented do not exactly match the periods used for survival analysis. However, data quality has generally been very high in all US registries, and it tended to improve over the 15 years from 1995 to 2009. Only about 2% of tumors were registered from a death certificate only (DCO) or detected solely at autopsy. These records must be excluded from survival analyses because the follow-up time for these patients is unknown. However, the proportion of DCO registrations in the US was low overall (1.9%) and in all states (range: <0.1-3.5%). The proportion of other errors was very low (0.2%). Therefore, about 98% of the eligible patients were included in survival analyses. Practically all tumors (99.7%) were microscopically verified: this proportion was over 95% in almost all US states.
3 4 5 6 7 8 9 10 11 12 13 14 15 16 17 18 19 20 21 22 23 24 25 26 27 28 29 30 31 32 33 34 35 36 37 38 39 40 41 42 43 44 45 46 47 48 49 50 51 52 53 54 55 56 57 58 59 60
8
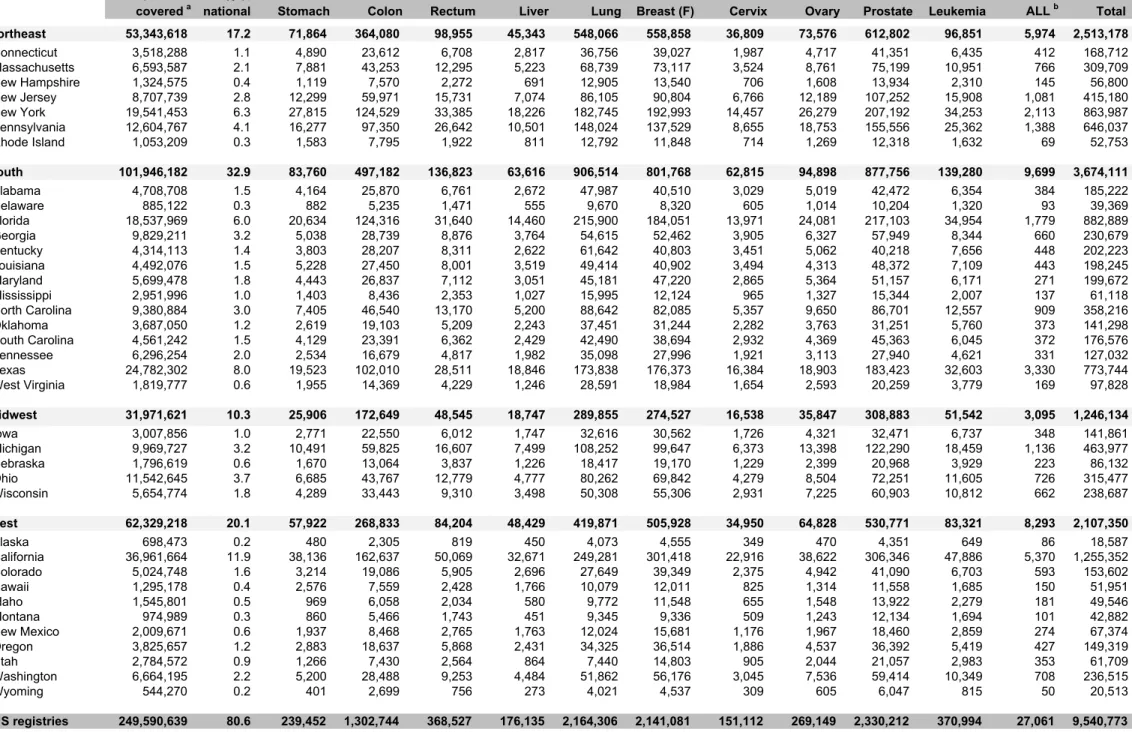
The proportion of the US population covered by this study is 80.6%. Table 3 shows the population coverage by US state, as well as the number of patients diagnosed during 1995– 2009 and included in the analyses.
Study design
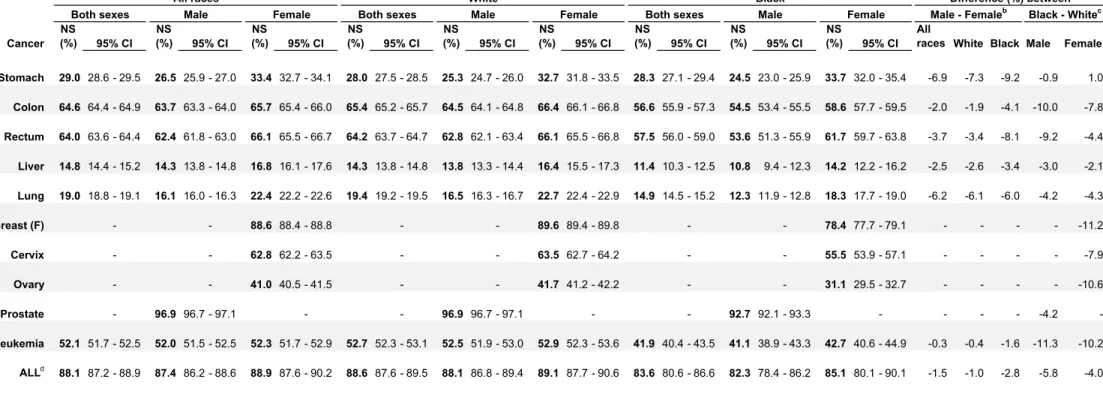
The focus of this monograph is on the striking differences in survival by race and stage at diagnosis. Since differences in survival between men and women were generally very small, compared to the differences in survival between blacks and whites (Table 4), we do not show survival estimates by sex in the articles on each cancer.
The CONCORD protocol required information on stage at diagnosis only for patients diagnosed from 2001 onward, because the completeness of data on stage in the US and many other countries was known to be much lower before 2001. For the analyses of survival by stage at diagnosis, patients were grouped by year of diagnosis into two calendar periods (2001-2003 and 2004-2009) to reflect changes in the methods used by US registries to collect data on stage at diagnosis. From 2001, most registries coded stage directly from the source data to SEER Summary Stage (SS) 2000.9 From 2004, all registries began to derive Summary Stage 2000 from 15 pathological and clinical data items, using the Collaborative Staging System.10 Data on stage at diagnosis were not available for Maryland or Wisconsin, or for cases diagnosed during 2004-2009 in Rhode Island.
We estimated net survival using the cohort approach for patients diagnosed in 2001-2003, since all patients had been followed up for at least five years by Dec 31, 2009. We used the complete approach to estimate net survival for patients diagnosed from 2004-2009, because five years of follow-up data were not available for all patients.
Cohort approach
The cohort approach is the classical approach to survival analysis, in which all patients who are included in the analyses have had the opportunity to be followed for the full duration of survival analysis, in this case, five years. The cohort of patients is defined by the year or calendar period during which they were diagnosed, and each patient is followed up for the same length of time. In our analyses, at least 5 years of follow-up for vital status were available by the end of 2009 for all patients diagnosed during 2001-2003. Each patient, 3 4 5 6 7 8 9 10 11 12 13 14 15 16 17 18 19 20 21 22 23 24 25 26 27 28 29 30 31 32 33 34 35 36 37 38 39 40 41 42 43 44 45 46 47 48 49 50 51 52 53 54 55 56 57 58 59 60
9
irrespective of their actual year of diagnosis, contributes survival information at each point in follow-up time that, taken cumulatively, make up the survival estimate at 5 years.
The cohort approach11, 12 is considered the gold standard,11, 12 because it provides a survival estimate for a group of patients who were diagnosed during the same year or period, who are likely to have been treated in similar fashion, and who have all been followed up for at least the duration of survival required. It is the natural approach to estimation of outcome, and is easy to interpret, but other approaches may be required if sufficient data are not available. Complete approach
The complete approach can be applied to estimate survival for patients who were diagnosed more recently, and for whom 5 full years of follow-up data may not be available at the closing date of the study. For example, some patients diagnosed 2004-2009 were followed up for less than 5 years. The ‘cohort’ approach can be used to estimate five-year survival for patients diagnosed in 2004, but 5-year survival can be estimated for the whole calendar period with the ‘complete’ approach, in which all the available follow-up data for patients diagnosed during 2004-2009 are used. The potential follow-up time for these patients varies between 1 year and 5 years.
Age standardization
We compared survival estimates between US states, between blacks and whites, and between calendar periods of diagnosis. For age-specific survival estimates, comparison between populations or over time is straightforward, but if we want to compare overall (all-ages) survival estimates, age standardization is required. This is essentially for the same reasons as in comparison of overall incidence or mortality rates, namely that net survival may also vary widely with age at diagnosis, and the age profile of cancer patients may differ between the populations or change between the calendar periods among which we wish to compare overall survival.
For age-standardization of incidence or mortality rates, what matters is the age structure of the general population at risk of cancer. With cancer survival, however, what matters is the age profile of cancer patients, which is very different from the age profile of the general population. The weights used for age standardization of cancer survival estimates are thus completely different from those required for standardizing incidence or mortality rates. The 3 4 5 6 7 8 9 10 11 12 13 14 15 16 17 18 19 20 21 22 23 24 25 26 27 28 29 30 31 32 33 34 35 36 37 38 39 40 41 42 43 44 45 46 47 48 49 50 51 52 53 54 55 56 57 58 59 60
10
weight for each age group is provided by the proportion of cancer patients in that age group in a standard population of cancer patients.
The International Cancer Survival Standard (ICSS) weights13 are strongly recommended for international comparisons of cancer survival. They comprise three sets of standard age weights, derived from discriminant analysis to find the smallest number of sets of weights that enable adequate standardization of survival. Each standard is applicable to a range of different cancers, and provides age-standardized survival estimates that are not too different from the unstandardized estimates. The same age weights can be used for men and women, and for direct comparisons of age-standardized net survival between patient groups defined by sex and race.
Statistical methods
We estimated net survival up to 5 years after diagnosis, with 95% confidence intervals (CI), using the Pohar Perme estimator,14 implemented in the Stata15 algorithm stns.16 We analyzed survival by state, race, stage at diagnosis and calendar period of diagnosis. Net survival is the probability of surviving up to a given time since diagnosis after controlling for other causes of death (background mortality). To control for the wide differences in background mortality among participating states and racial/ethnic groups, we constructed life tables of all-cause mortality in the general population of each state from the number of deaths and the population, by single year of age, sex, calendar year and, where possible, by race (black, white).
Net survival in adults was estimated for five age groups (15-44, 45-54, 55-64, 65-74, and 75-99 years; except for prostate cancer 15–54, 55–64, 65–74, 75–84 and 85–75-99 years). We obtained age-standardized survival estimates using the International Cancer Survival Standard (ICSS) weights. For children, survival was estimated for the age groups 0–4, 5–9 and 10–14 years. We obtained age-standardized estimates by assigning equal weights to the three age-specific estimates.17
We derived standard errors for both unstandardized and age-standardized survival estimates using the Greenwood method,18 assuming a normal distribution, and truncated to the range 0– 100. We did not estimate survival if fewer than ten patients were available for analysis. Age-standardization was only performed if there were at least 10 patients in each of the age 3 4 5 6 7 8 9 10 11 12 13 14 15 16 17 18 19 20 21 22 23 24 25 26 27 28 29 30 31 32 33 34 35 36 37 38 39 40 41 42 43 44 45 46 47 48 49 50 51 52 53 54 55 56 57 58 59 60
11
categories specified above. If an age-specific estimate could not be obtained, we merged data for adjacent age groups and assigned the combined estimate to both age groups. If two or more age-specific estimates could not be obtained, we present only the pooled, unstandardized estimate for all ages combined: these estimates are italicized in Tables 2 and 3 of the Appendix.
For each of the 37 states, we present estimates of age-standardized net survival for each cancer up to 5 years after diagnosis. For convenience, we report cumulative survival probabilities (in the range 0-1) as percentages in the range 0-100%.
Life tables
For the analyses presented in this Supplement, we used the life tables for background mortality that were constructed for the CONCORD-2 study.19
To control for variation between US states in background mortality by age, sex, race and calendar year while estimating net survival, we used life tables of all-cause mortality rates by single year of age (0-99 years), for each state, race, calendar year (2001-2010) and sex. For a few states in which the black population is small, it was not possible to construct adequately robust life tables of all-cause mortality by single year of age and sex for blacks, so net survival estimates for blacks in those states are not presented separately. These life tables can be downloaded from the CONCORD library of over 12,000 life tables.20 The library includes detailed statistical and graphical reports on the robustness of the life tables for each US state. We received raw data on death counts and populations for each US state. To produce life tables for each US state by race, sex and calendar year (state- and race-specific life tables) we used a flexible Poisson model21 that enables creation of single-year-of-age life tables even when the raw data are sparse. We checked the life tables by examination of semi-log plots of age-sex-mortality rates, life expectancy at birth, the probability of death in the age bands 15– 59, 60–84 and 85–99 years and, where necessary, the model residuals, to examine the goodness of fit of the models by age and sex.
Graphical representation 3 4 5 6 7 8 9 10 11 12 13 14 15 16 17 18 19 20 21 22 23 24 25 26 27 28 29 30 31 32 33 34 35 36 37 38 39 40 41 42 43 44 45 46 47 48 49 50 51 52 53 54 55 56 57 58 59 60
12
In each cancer-specific article in this Supplement, trends, geographic variations and differences in age-standardized survival by race are presented graphically in bar-charts and funnel plots.22
Bar-charts
Results were summarized in bar-charts of 5-year age-standardized net survival by calendar period (2001-2003 and 2004-2009), for each state, grouped within the four US geographic Census Regions (Northeast, South, Midwest, West). The results for each Region are presented with a different color. Within each Region, darker shades indicate NPCR registries, while lighter shades indicate SEER registries. Five registries funded by both SEER and NPCR were grouped with SEER because they use both passive and active follow-up; they are indicated with an asterisk “*”.
The survival estimates for each state in 2004-2009 are ranked from high to low within each US Census Region. The same ranking is then applied to the results for 2001-2003, to facilitate examination of changes in survival from 2001-2003 to 2004-2009 within each state. The absolute difference (%) in 5-year net survival between the two periods is also shown for each state.
Each graphic includes the pooled survival estimates for all 37 participating states combined. Funnel plots
Funnel plots are graphical representations designed to detect excessive variation in performance indicators by simple visual inspection of the data.23 They can be used to provide a simple and informative display of geographical variation or time trends in population-based cancer survival measures (e.g. age-standardized net survival).
A funnel plot comprises four elements:22 the target (or reference) value for the outcome, a set of control limits (the funnel), data points for the outcome variable (indicator) and the associated precision parameter for each data point. Data points outside the control limits (the funnel) indicate variation in the indicator beyond what would be expected by chance, while taking account of precision.23
The funnel plot in Figure 1 shows, as an example, 5-year age-standardized net survival for breast cancer in the US during 2004-2009, by race and state. It is constructed by plotting the 37 state-specific survival estimates for breast cancer during 2004-2009, on the y-axis, against 3 4 5 6 7 8 9 10 11 12 13 14 15 16 17 18 19 20 21 22 23 24 25 26 27 28 29 30 31 32 33 34 35 36 37 38 39 40 41 42 43 44 45 46 47 48 49 50 51 52 53 54 55 56 57 58 59 60
13
their associated precision, on the x-axis, forming a scatter plot. Fewer data points are available for blacks (28 states) than for whites (37 states), because of the difficulty in constructing robust life tables for blacks in every state. The precision parameter in this example is in fact the precision of each age-standardized net survival estimate (the inverse of its variance). This is a natural choice to represent the statistical precision of each estimate, but it could be any function that is proportional to the inverse of the variance.
The target (the solid horizontal line in Figure 1) is then superimposed. This is a constant value, considered independent of the observations, and it specifies the expected value for the outcome. The target shown in Figure 1 is the 5-year age-standardized net survival estimate for the pooled US data for women diagnosed with breast cancer during 2004-2009. The pooled US estimate was selected as the target to show the extent to which survival for blacks and whites in each state varies around the overall survival estimate for the US.
The control limits (the dashed lines in Figure 1) are also independent of the individual survival estimates. They depend only on the target value, and their correct formulation depends on the underlying theoretical distribution of the target value. The control limits for a given level of significance (α) are drawn around the target value across the entire observed range of precision of the individual estimates. The most common levels of significance are α=5% and α=0.2%, so that the resulting 95% and 99.8% control limits represent approximately two and three standard deviations, respectively, on either side of the target value, at each level of precision. An estimate that appears outside the control limits is identified as diverging from the target value, and is an “out-of-control” estimate, in other words a probable outlier that may need to be investigated further.
In Figure 1, as with all the funnel plots reported in this Supplement, 5-year age-standardized net survival is represented by open circles for white patients and by solid circles for black patients. Funnel plots are extremely powerful tools for visual examination of variation in an indicator: we can perceive at first glance that 5-year survival in blacks is persistently lower than would be expected (the pooled US survival estimate, the "target") and that survival for blacks is generally lower than for whites.
DISCUSSION 3 4 5 6 7 8 9 10 11 12 13 14 15 16 17 18 19 20 21 22 23 24 25 26 27 28 29 30 31 32 33 34 35 36 37 38 39 40 41 42 43 44 45 46 47 48 49 50 51 52 53 54 55 56 57 58 59 60
14
This article summarizes the data quality control procedures, analytic methods and graphical presentations that have been deployed for all the data sets reported in this Supplement. The quality of population-based data from the 37 participating US cancer registries was impressively high (Table 2). More details about the quality indicators for each cancer can be found in the web-appendixb to the CONCORD-2 article.3
For NPCR registries that use only passive follow-up to determine the vital status of registered cancer patients (the “presumed alive” method), survival estimates may be inflated if the cancer registrations for some patients who have in fact died could not be successfully linked to the data from their death certificate. The vital statistics offices in each state have reported all death certificate information to the National Death Index (NDI) since 1979. Passive methods of follow-up are known to be efficient because of the completeness and accuracy of the National Death Index, which tends to capture 1-3% more deaths than if the registry can only link its data to the state death index24. Most of the extra deaths captured in this way will be those of patients who migrated to a different state following their cancer diagnosis. However, the registries included in these analyses had all matched their data against the National Death Index before data submission, so the completeness of vital status ascertainment is expected to be extremely high, although it may not capture out-of-country deaths.
A major strength of this study is the use of life tables that are specific for each state, each race (white, black) and each calendar year, to control for differences and changes in background mortality by single year of age, sex, race and single calendar year. This approach provided the tightest possible control of background mortality with the available data. More specific life tables may be considered in future studies, subject to the availability of high-quality data on death and population counts for Hispanics or other major racial or ethnic groups.
The CONCORD-2 protocol required registries to provide information on stage at diagnosis for patients diagnosed in 2001 or later. Calendar years of diagnosis were then grouped for analysis of survival by stage into 2001-2003 and 2004-2009, to reflect a change in the US stage coding system from 2004.
This choice of calendar periods imposed the following selection of analytic approach. We were able to estimate 5-year net survival with the cohort approach for patients diagnosed in 2001-2003, since all patients had at least 5 years of potential follow-up. However, the period
b http://www.thelancet.com/journals/lancet/article/PIIS0140-6736(14)62038-9/supplemental 3 4 5 6 7 8 9 10 11 12 13 14 15 16 17 18 19 20 21 22 23 24 25 26 27 28 29 30 31 32 33 34 35 36 37 38 39 40 41 42 43 44 45 46 47 48 49 50 51 52 53 54 55 56 57 58 59 60
15
approach25 that was adopted to estimate 5-year survival for patients diagnosed 2005-2009 in the CONCORD-2 study3 could only have been used to estimate 5-year survival by stage for patients diagnosed during 2004-2009 if stage data had also been available for patients diagnosed in 2000. We therefore adopted the complete approach. In this approach, more information is available to estimate survival in the early years of follow-up than later years. Only patients diagnosed in 2004 had the potential to be followed up for 5 years by Dec 31, 2009; only patients diagnosed during 2004 and 2005 had the potential to contribute to the conditional survival probabilities between 4 and 5 years after diagnosis; and so on. This leads to some increased variation around the 5-year survival estimates for 2004-2009 compared with those for 2001-2003. This is reflected in the confidence intervals, and slightly lower precision, seen in the funnel plots for 2004-2009 in some of the site-specific articles.
This is the most extensive analysis of 5-year population-based cancer survival in the US to date, with survival trends for 10 common cancers in 37 states that include 80% of the US population. Here, we have focused on variations in survival by race and stage at diagnosis for patients diagnosed during 2001-2009.
Population-based cancer survival is a key measure of the overall effectiveness of the health system in in dealing with cancer. The high quality of the data from the US cancer registries, implementation of the most up-to-date and unbiased estimator of net survival, combined with the use of state- and race-specific life tables, all help to ensure that these cancer survival estimates are robust and comparable. We believe they can be confidently used by policy-makers to identify inequities in cancer survival by race in each state and for the US as a whole, and to plan cancer control strategies that promote equal opportunity for the best possible outcomes after a cancer diagnosis.
3 4 5 6 7 8 9 10 11 12 13 14 15 16 17 18 19 20 21 22 23 24 25 26 27 28 29 30 31 32 33 34 35 36 37 38 39 40 41 42 43 44 45 46 47 48 49 50 51 52 53 54 55 56 57 58 59 60
16
Legends for Tables and Figures Table 1 Definition of malignancies
Table 2 Data quality indicators for patients diagnosed during 1995–2009, by US state (all solid cancers combined)
Table 2 footnotes:
a In situ malignancy (ICD-O-3 behavior code 2): some registries do not register in situ
cancers; other registries did not submit them. Other: records with incomplete data, or for tumors that are benign (behavior code 0), of uncertain behavior (1), metastatic from another organ (6), or unknown if primary or metastatic (9); or for patients with age outside the range 15-99 years (adults).
b
DCO: tumors registered from a death certificate only (DCO), or detected solely at autopsy. Other: vital status or sex unknown; invalid sequence of dates; inconsistency of sex-site, site-morphology, age-site, age-site-morphology, or age-site-morphology.
c
MV: microscopically verified. Non-specific morphology (solid tumors only): ICD-O-3 morphology code in the range 8000-8005. Censored: patients diagnosed during 1995-2004, with last known vital status "alive", but less than five years of follow-up.
d
P=Passive (“presumed alive”) method; P&A=Passive and Active (“reported alive”) methods; see text.
Table 3: Population coverage and number of patients diagnosed during 1995–2009, by US state
Table 3 footnotes:
a
Data are from the UN Population Division for 2009
b
Acute lymphoblastic leukemia, children (0-14 years) only
Table 4: Age-standardized 5-year net survival (NS, %) for adults (15-99 years) diagnosed with one of 10 common malignancies and children (0-14 years) diagnosed with acute lymphoblastic leukemia (ALL) during 2004-2009, by race and sex: United Statesa
Table 4 footnotes:
a
Population coverage represents 80.6 % of the US population in 2009 (UN Population Division)
b
A negative value means that males have lower survival than females
c
A negative value means that blacks have lower survival than whites
d
Acute lymphoblastic leukemia, children (0-14 years) only
Figure 1: 5-year age-standardized net survival for women (15-99 years) diagnosed with breast cancer in 2004-2009, by state and race
Figure 1 footnote: Each data point represents the survival estimate for a US state, either for blacks (28 states) or whites (37 states; see text).
3 4 5 6 7 8 9 10 11 12 13 14 15 16 17 18 19 20 21 22 23 24 25 26 27 28 29 30 31 32 33 34 35 36 37 38 39 40 41 42 43 44 45 46 47 48 49 50 51 52 53 54 55 56 57 58 59 60
17
References
1. Coleman MP. Cancer survival: global surveillance will stimulate health policy and improve equity. The Lancet. 2014;383: 564-573.
2. Coleman MP, Quaresma M, Berrino F, et al. Cancer survival in five continents: a worldwide population-based study (CONCORD). The Lancet Oncology. 2008;9: 730-756.
3. Allemani C, Weir HK, Carreira H, et al. Global surveillance of cancer survival 1995-2009: analysis of individual data for 25,676,887 patients from 279 population-based registries in 67 countries (CONCORD-2). The Lancet. 2015;385: 977–1010.
4. White MC, Babcock F, Hayes NS, et al. The evolution of cancer registry data and public health cancer control programs in the United States. Cancer (this Supplement). 2017.
5. IARC Working Group. International Rules for Multiple Primary Cancers (ICD-O Third Edition). European Journal of Cancer Prevention. 2005;14: 307-308.
6. Surveillance Epidemiology and End Results program. Multiple Primary and Histology Coding Rules Manual. Available from URL: http://seer.cancer.gov/tools/mphrules/download.html [accessed 24 Sept 2016.
7. Fritz AG, Percy C, Jack A, et al. International Classification of Diseases for Oncology (ICD-O). Geneva: World Health Organisation, 2013.
8. Johnson CJ, Weir HK, Mariotto AB, Nishri D, Wilson R. Cancer in North America: 2008-2012 Volume Four: Cancer Survival in the United States and Canada 2005-2011. The NAACCR Narrative. Springfield, IL, 2016.
9. Young JL, Roffers SD, Ries LAG, Fritz AG, Hurlbut AA.SEER Summary Staging Manual - 2000: Codes and Coding Instructions. NIH Pub. No. 01-4969. Bethesda, MD: National Cancer Institute, 2001. 10. Cronin KA, Ries LAG, Edwards BK. Preface [Collaborative staging and its impact on cancer registry data: information for data users on analysis and interpretation of registry data]. Cancer. 2014;120: 3755-3757.
11. Estève J, Benhamou E, Raymond L.Statistical methods in cancer research, volume IV. Descriptive epidemiology. (IARC Scientific Publications No. 128). Lyon: International Agency for Research on Cancer, 1994.
12. Cutler SJ, Ederer F. Maximum utilisation of the life table method in analyzing survival. Journal of Chronic Diseases. 1958;8: 699-712.
13. Corazziari I, Quinn MJ, Capocaccia R. Standard cancer patient population for age standardising survival ratios. European Journal of Cancer. 2004;40: 2307-2316.
14. Pohar Perme M, Stare J, Estève J. On estimation in relative survival. Biometrics. 2012;68: 113-120.
15. StataCorp. STATA statistical software. College Station TX: Stata Corporation, 2015.
16. Clerc-Urmès I, Grzebyk M, Hédelin G. Net survival estimation with stns. Stata Journal. 2014;14: 87-102.
17. Stiller CA, Bunch KJ. Trends in survival for childhood cancer in Britain diagnosed 1971-85. British Journal of Cancer. 1990;62: 806-815.
18. Greenwood M. The natural duration of cancer. (Report on Public Health and Medical Subjects No. 33). London: HMSO, 1926.
19. Spika D, Bannon F, Bonaventure A, et al. Life tables for global surveillance of cancer survival (the CONCORD programme): data sources and methods. BMC Cancer. 2017;17: 159.
20. Spika D, Rachet B, Bannon F, et al. Life tables for the CONCORD-2 study. Available from URL:
http://csg.lshtm.ac.uk/tools-analysis/ [accessed 24 Sept 2016.
21. Rachet B, Maringe C, Woods LM, Ellis L, Spika D, Allemani C. Multivariable flexible modelling for estimating complete, smoothed life tables for sub-national populations. BMC Public Health. 2015;15: 1240.
22. Quaresma M, Coleman MP, Rachet B. Funnel plots for population-based cancer survival: principles, methods and applications. Statistics in Medicine. 2014;33: 1070-1080.
3 4 5 6 7 8 9 10 11 12 13 14 15 16 17 18 19 20 21 22 23 24 25 26 27 28 29 30 31 32 33 34 35 36 37 38 39 40 41 42 43 44 45 46 47 48 49 50 51 52 53 54 55 56 57 58 59 60
18
23. Spiegelhalter DJ. Funnel plots for comparing institutional performance. Statistics in Medicine. 2005;24: 1185-1202.
24. Johnson CJ, Weir HK, Fink AK, et al. The impact of National Death Index linkages on population-based cancer survival rates in the United States. Cancer Epidemiology. 2013;37: 20-28.
25. Brenner H, Gefeller O. An alternative approach to monitoring cancer patient survival. Cancer. 1996;78: 2004-2010. 3 4 5 6 7 8 9 10 11 12 13 14 15 16 17 18 19 20 21 22 23 24 25 26 27 28 29 30 31 32 33 34 35 36 37 38 39 40 41 42 43 44 45 46 47 48 49 50 51 52 53 54 55 56 57 58 59 60
Figure 1 261x196mm (300 x 300 DPI) 3 4 5 6 7 8 9 10 11 12 13 14 15 16 17 18 19 20 21 22 23 24 25 26 27 28 29 30 31 32 33 34 35 36 37 38 39 40 41 42 43 44 45 46 47 48 49 50 51 52 53 54 55 56 57 58 59 60
190x142mm (300 x 300 DPI) 3 4 5 6 7 8 9 10 11 12 13 14 15 16 17 18 19 20 21 22 23 24 25 26 27 28 29 30 31 32 33 34 35 36 37 38 39 40 41 42 43 44 45 46 47 48 49 50 51 52 53 54 55 56 57 58 59 60
Table 1 Definition of malignancies
Malignancy Topography or morphology codes Description
Stomach C16.0-C16.6; C16.8-C16.9 Stomach
Colon C18.0-C18.9; C19.9 Colon and rectosigmoid junction Rectum C20.9; C21.0-C21.2, C21.8 Rectum, anus and anal canal
Liver C22.0-C22.1 Liver and intrahepatic bile ducts
Lung C34.0-C34.3; C34.8-C34.9 Lung and bronchus Breast (women) C50.0-C50.6; C50.8-C50.9 Breast
Cervix C53.0-C53.1; C53.8-C53.9 Cervix uteri Ovary C48.0-C48.2; C56.9; C57.0-C57.4;
C57.7-C57.9
Ovary, fallopian tube and uterine ligaments, other and unspecified female genital organs, peritoneum and retroperitoneum
Prostate C61.9 Prostate gland
Leukaemia (children) 9727; 9728; 9729; 9835; 9836; 9837 Precursor-cell acute lymphoblastic leukaemia (ALL) 3 4 5 6 7 8 9 10 11 12 13 14 15 16 17 18 19 20 21 22 23 24 25 26 27 28 29 30 31 32 33 34 35 36 37 38 39 40 41 42 43 44 45 46 47 48 49 50 51 52 53 54 55 56 57 58 59 60
Calendar period
Patients
submitted In situ Other
Eligible
patients DCO Other
Available for analyses MV Non-specific morphology Lost to follow-up Censored Type of follow upd US registries 1995 - 2009 10,115,271 6.4 1.4 9,325,815 1.9 0.2 9,142,718 99.7 1.3 1.0 <0.1 Alabama 1996 - 2009 184,581 0.0 1.3 182,156 1.9 0.2 178,484 95.9 1.1 0.0 0.0 P Alaska 1996 - 2009 19,959 6.9 2.9 18,002 0.7 0.2 17,852 95.8 1.7 0.0 0.0 P California 1995 - 2009 1,326,462 6.1 2.1 1,218,053 1.2 0.2 1,202,096 95.8 0.8 3.2 0.0 P & A Colorado 1995 - 2009 162,405 6.4 1.4 149,860 2.4 0.2 146,306 95.8 0.8 0.0 0.0 P Connecticut 1995 - 2009 180,154 7.8 1.1 164,128 1.3 0.2 161,865 97.0 0.7 4.5 0.0 P & A Delaware 1995 - 2009 41,768 6.1 1.2 38,717 2.0 0.2 37,956 96.1 0.7 0.0 0.0 P Florida 1995 - 2009 928,713 5.0 0.8 874,825 3.3 0.2 846,156 97.2 1.5 0.0 <0.1 P Georgia 2000 - 2009 241,967 6.0 0.6 225,831 1.8 0.2 221,675 96.2 0.7 2.1 0.0 P & A Hawaii 1995 - 2009 55,510 7.6 1.0 50,774 1.2 0.2 50,116 96.6 0.3 4.1 0.0 P & A Idaho 1995 - 2009 51,319 4.6 1.3 48,277 2.5 0.2 47,086 95.8 0.4 0.0 0.0 P Iowa 1995 - 2009 146,231 5.0 1.3 136,938 1.5 0.2 134,776 95.2 0.5 1.4 0.0 P Kentucky 1995 - 2009 208,365 4.7 0.8 197,074 1.4 0.2 194,119 93.7 1.4 1.1 0.0 P & A Louisiana 1995 - 2009 205,149 4.4 1.1 193,856 1.5 0.2 190,693 95.2 0.4 2.2 0.0 P & A Maryland 1996 - 2009 225,540 10.6 1.1 199,088 2.9 0.3 193,230 94.8 1.8 0.0 0.0 P Massachusetts 1995 - 2009 336,858 9.1 0.8 303,282 1.7 0.2 297,992 95.8 1.4 0.0 <0.1 P Michigan 1995 - 2009 522,531 12.9 1.0 449,914 1.1 0.2 444,382 94.7 3.0 0.0 0.1 P & A Mississippi 2003 - 2009 64,396 4.7 0.9 60,833 3.1 0.2 58,974 96.7 0.4 0.0 0.0 P Montana 1995 - 2009 48,221 10.1 1.7 42,512 3.5 0.2 41,087 95.8 0.3 9.8 0.0 P & A Nebraska 1995 - 2009 88,971 4.9 1.5 83,231 1.5 0.2 81,980 96.1 1.2 0.0 <0.1 P New Hampshire 1995 - 2009 60,507 7.6 0.9 55,347 1.7 0.2 54,345 95.1 1.1 0.0 0.0 P
New Jersey 1995 - 2009 440,395 6.7 1.6 403,724 1.3 0.2 398,191 96.2 1.0 2.8 0.0 P & A
New Mexico 1995 - 2009 70,628 5.4 0.8 66,269 3.1 0.2 64,241 94.8 1.1 5.1 0.0 P & A
New York 1995 - 2009 940,361 7.7 2.6 842,888 1.7 0.2 827,621 94.8 0.9 0.0 0.0 P North Carolina 1995 - 2009 375,205 5.9 0.7 350,656 1.7 0.1 344,750 96.3 0.7 0.0 0.0 P Ohio 2001 - 2009 334,006 6.1 0.7 311,520 2.8 0.2 303,146 96.3 2.0 0.0 0.0 P Oklahoma 1997 - 2009 147,158 4.3 1.0 139,322 2.9 0.2 135,165 93.1 1.6 0.0 0.0 P Oregon 1996 - 2009 155,767 5.3 0.8 146,145 1.8 0.2 143,473 94.2 1.4 0.0 <0.1 P Pennsylvania 1995 - 2009 682,922 6.5 1.5 628,121 1.3 0.2 619,287 95.7 0.7 0.0 0.0 P Rhode Island 1995 - 2009 55,914 6.3 0.8 51,937 1.6 0.2 51,052 96.0 2.7 0.0 0.0 P South Carolina 1996 - 2009 184,660 5.3 0.6 173,791 2.0 0.2 170,159 94.8 2.0 0.0 0.0 P Tennessee 2003 - 2009 133,826 5.1 0.9 125,694 2.9 0.2 122,080 96.7 0.4 0.0 <0.1 P Texas 1995 - 2009 814,295 5.0 1.4 762,429 3.2 0.2 737,811 94.0 2.5 0.0 0.0 P Utah 1995 - 2009 63,227 5.9 1.2 58,729 0.4 0.2 58,373 97.0 0.4 3.0 0.0 P & A Washington 1995 - 2008 246,015 5.9 1.3 228,416 1.2 0.2 225,458 95.1 0.8 1.9 <0.1 P & A West Virginia 1995 - 2009 101,396 4.6 1.1 95,644 1.8 0.2 93,880 93.6 0.9 0.0 0.0 P Wisconsin 1995 - 2009 248,955 7.1 1.3 228,035 <0.1 0.3 227,213 96.4 2.3 0.0 0.0 P Wyoming 1995 - 2009 20,934 4.7 0.8 19,797 0.6 0.2 19,648 95.6 0.6 0.0 0.0 P & A
Table 1 [All solid cancers ] page 1 of 1 Produced 29 July 2016
3 4 5 6 7 8 9 10 11 12 13 14 15 16 17 18 19 20 21 22 23 24 25 26 27 28 29 30 31 32 33 34 35 36 37 38 39 40 41 42 43 44 45 46 47 48 49 50 51 52 53 54 55 56 57 58 59 60
Northeast 53,343,618 17.2 71,864 364,080 98,955 45,343 548,066 558,858 36,809 73,576 612,802 96,851 5,974 2,513,178 Connecticut 3,518,288 1.1 4,890 23,612 6,708 2,817 36,756 39,027 1,987 4,717 41,351 6,435 412 168,712 Massachusetts 6,593,587 2.1 7,881 43,253 12,295 5,223 68,739 73,117 3,524 8,761 75,199 10,951 766 309,709 New Hampshire 1,324,575 0.4 1,119 7,570 2,272 691 12,905 13,540 706 1,608 13,934 2,310 145 56,800 New Jersey 8,707,739 2.8 12,299 59,971 15,731 7,074 86,105 90,804 6,766 12,189 107,252 15,908 1,081 415,180 New York 19,541,453 6.3 27,815 124,529 33,385 18,226 182,745 192,993 14,457 26,279 207,192 34,253 2,113 863,987 Pennsylvania 12,604,767 4.1 16,277 97,350 26,642 10,501 148,024 137,529 8,655 18,753 155,556 25,362 1,388 646,037 Rhode Island 1,053,209 0.3 1,583 7,795 1,922 811 12,792 11,848 714 1,269 12,318 1,632 69 52,753 South 101,946,182 32.9 83,760 497,182 136,823 63,616 906,514 801,768 62,815 94,898 877,756 139,280 9,699 3,674,111 Alabama 4,708,708 1.5 4,164 25,870 6,761 2,672 47,987 40,510 3,029 5,019 42,472 6,354 384 185,222 Delaware 885,122 0.3 882 5,235 1,471 555 9,670 8,320 605 1,014 10,204 1,320 93 39,369 Florida 18,537,969 6.0 20,634 124,316 31,640 14,460 215,900 184,051 13,971 24,081 217,103 34,954 1,779 882,889 Georgia 9,829,211 3.2 5,038 28,739 8,876 3,764 54,615 52,462 3,905 6,327 57,949 8,344 660 230,679 Kentucky 4,314,113 1.4 3,803 28,207 8,311 2,622 61,642 40,803 3,451 5,062 40,218 7,656 448 202,223 Louisiana 4,492,076 1.5 5,228 27,450 8,001 3,519 49,414 40,902 3,494 4,313 48,372 7,109 443 198,245 Maryland 5,699,478 1.8 4,443 26,837 7,112 3,051 45,181 47,220 2,865 5,364 51,157 6,171 271 199,672 Mississippi 2,951,996 1.0 1,403 8,436 2,353 1,027 15,995 12,124 965 1,327 15,344 2,007 137 61,118 North Carolina 9,380,884 3.0 7,405 46,540 13,170 5,200 88,642 82,085 5,357 9,650 86,701 12,557 909 358,216 Oklahoma 3,687,050 1.2 2,619 19,103 5,209 2,243 37,451 31,244 2,282 3,763 31,251 5,760 373 141,298 South Carolina 4,561,242 1.5 4,129 23,391 6,362 2,429 42,490 38,694 2,932 4,369 45,363 6,045 372 176,576 Tennessee 6,296,254 2.0 2,534 16,679 4,817 1,982 35,098 27,996 1,921 3,113 27,940 4,621 331 127,032 Texas 24,782,302 8.0 19,523 102,010 28,511 18,846 173,838 176,373 16,384 18,903 183,423 32,603 3,330 773,744 West Virginia 1,819,777 0.6 1,955 14,369 4,229 1,246 28,591 18,984 1,654 2,593 20,259 3,779 169 97,828 Midwest 31,971,621 10.3 25,906 172,649 48,545 18,747 289,855 274,527 16,538 35,847 308,883 51,542 3,095 1,246,134 Iowa 3,007,856 1.0 2,771 22,550 6,012 1,747 32,616 30,562 1,726 4,321 32,471 6,737 348 141,861 Michigan 9,969,727 3.2 10,491 59,825 16,607 7,499 108,252 99,647 6,373 13,398 122,290 18,459 1,136 463,977 Nebraska 1,796,619 0.6 1,670 13,064 3,837 1,226 18,417 19,170 1,229 2,399 20,968 3,929 223 86,132 Ohio 11,542,645 3.7 6,685 43,767 12,779 4,777 80,262 69,842 4,279 8,504 72,251 11,605 726 315,477 Wisconsin 5,654,774 1.8 4,289 33,443 9,310 3,498 50,308 55,306 2,931 7,225 60,903 10,812 662 238,687 West 62,329,218 20.1 57,922 268,833 84,204 48,429 419,871 505,928 34,950 64,828 530,771 83,321 8,293 2,107,350 Alaska 698,473 0.2 480 2,305 819 450 4,073 4,555 349 470 4,351 649 86 18,587 California 36,961,664 11.9 38,136 162,637 50,069 32,671 249,281 301,418 22,916 38,622 306,346 47,886 5,370 1,255,352 Colorado 5,024,748 1.6 3,214 19,086 5,905 2,696 27,649 39,349 2,375 4,942 41,090 6,703 593 153,602 Hawaii 1,295,178 0.4 2,576 7,559 2,428 1,766 10,079 12,011 825 1,314 11,558 1,685 150 51,951 Idaho 1,545,801 0.5 969 6,058 2,034 580 9,772 11,548 655 1,548 13,922 2,279 181 49,546 Montana 974,989 0.3 860 5,466 1,743 451 9,345 9,336 509 1,243 12,134 1,694 101 42,882 New Mexico 2,009,671 0.6 1,937 8,468 2,765 1,763 12,024 15,681 1,176 1,967 18,460 2,859 274 67,374 Oregon 3,825,657 1.2 2,883 18,637 5,868 2,431 34,325 36,514 1,886 4,537 36,392 5,419 427 149,319 Utah 2,784,572 0.9 1,266 7,430 2,564 864 7,440 14,803 905 2,044 21,057 2,983 353 61,709 Washington 6,664,195 2.2 5,200 28,488 9,253 4,484 51,862 56,176 3,045 7,536 59,414 10,349 708 236,515 Wyoming 544,270 0.2 401 2,699 756 273 4,021 4,537 309 605 6,047 815 50 20,513 US registries 249,590,639 80.6 239,452 1,302,744 368,527 176,135 2,164,306 2,141,081 151,112 269,149 2,330,212 370,994 27,061 9,540,773
Table 2 - population coverage 1 of 1 Produced 29 July 2016
3 4 5 6 7 8 9 10 11 12 13 14 15 16 17 18 19 20 21 22 23 24 25 26 27 28 29 30 31 32 33 34 35 36 37 38 39 40 41 42 43 44 45 46 47 48 49 50 51 52 53 54 55 56 57 58 59 60
(%) (%) (%) (%) (%) (%) (%) (%) (%) races White Black Male Female Stomach 29.0 28.6 - 29.5 26.5 25.9 - 27.0 33.4 32.7 - 34.1 28.0 27.5 - 28.5 25.3 24.7 - 26.0 32.7 31.8 - 33.5 28.3 27.1 - 29.4 24.5 23.0 - 25.9 33.7 32.0 - 35.4 -6.9 -7.3 -9.2 -0.9 1.0 Colon 64.6 64.4 - 64.9 63.7 63.3 - 64.0 65.7 65.4 - 66.0 65.4 65.2 - 65.7 64.5 64.1 - 64.8 66.4 66.1 - 66.8 56.6 55.9 - 57.3 54.5 53.4 - 55.5 58.6 57.7 - 59.5 -2.0 -1.9 -4.1 -10.0 -7.8 Rectum 64.0 63.6 - 64.4 62.4 61.8 - 63.0 66.1 65.5 - 66.7 64.2 63.7 - 64.7 62.8 62.1 - 63.4 66.1 65.5 - 66.8 57.5 56.0 - 59.0 53.6 51.3 - 55.9 61.7 59.7 - 63.8 -3.7 -3.4 -8.1 -9.2 -4.4 Liver 14.8 14.4 - 15.2 14.3 13.8 - 14.8 16.8 16.1 - 17.6 14.3 13.8 - 14.8 13.8 13.3 - 14.4 16.4 15.5 - 17.3 11.4 10.3 - 12.5 10.8 9.4 - 12.3 14.2 12.2 - 16.2 -2.5 -2.6 -3.4 -3.0 -2.1 Lung 19.0 18.8 - 19.1 16.1 16.0 - 16.3 22.4 22.2 - 22.6 19.4 19.2 - 19.5 16.5 16.3 - 16.7 22.7 22.4 - 22.9 14.9 14.5 - 15.2 12.3 11.9 - 12.8 18.3 17.7 - 19.0 -6.2 -6.1 -6.0 -4.2 -4.3 Breast (F) - - 88.6 88.4 - 88.8 - - 89.6 89.4 - 89.8 - - 78.4 77.7 - 79.1 - - - - -11.2 Cervix - - 62.8 62.2 - 63.5 - - 63.5 62.7 - 64.2 - - 55.5 53.9 - 57.1 - - - - -7.9 Ovary - - 41.0 40.5 - 41.5 - - 41.7 41.2 - 42.2 - - 31.1 29.5 - 32.7 - - - - -10.6 Prostate - 96.9 96.7 - 97.1 - - 96.9 96.7 - 97.1 - - 92.7 92.1 - 93.3 - - - - -4.2 -Leukemia 52.1 51.7 - 52.5 52.0 51.5 - 52.5 52.3 51.7 - 52.9 52.7 52.3 - 53.1 52.5 51.9 - 53.0 52.9 52.3 - 53.6 41.9 40.4 - 43.5 41.1 38.9 - 43.3 42.7 40.6 - 44.9 -0.3 -0.4 -1.6 -11.3 -10.2 ALLd 88.1 87.2 - 88.9 87.4 86.2 - 88.6 88.9 87.6 - 90.2 88.6 87.6 - 89.5 88.1 86.8 - 89.4 89.1 87.7 - 90.6 83.6 80.6 - 86.6 82.3 78.4 - 86.2 85.1 80.1 - 90.1 -1.5 -1.0 -2.8 -5.8 -4.0 Cancer 95% CI 95% CI 95% CI 95% CI 95% CI 95% CI 95% CI 95% CI 95% CI
Table 1 - Age-std net survival by race and sex – US Page 1 of 1 Produced 29 July 2016
3 4 5 6 7 8 9 10 11 12 13 14 15 16 17 18 19 20 21 22 23 24 25 26 27 28 29 30 31 32 33 34 35 36 37 38 39 40 41 42 43 44 45 46 47 48 49 50 51 52 53 54 55 56 57 58 59 60
1
Population-based cancer survival in the US: data, quality control and statistical methods
Claudia Allemani,1 Rhea Harewood,1 Chris Johnson,2 Helena Carreira,1 Devon Spika,1 Audrey Bonaventure,1 Kevin Ward,3 Hannah K Weir,4 Michel P Coleman1
Running title: Data, quality control and statistical methods
Keywords: cancer, population-based, survival, statistical methods, NPCR, SEER
1
Cancer Survival Group, Department of Non-Communicable Disease Epidemiology, London School of Hygiene and Tropical Medicine, Keppel Street, London WC1E 7HT, UK
2
Cancer Data Registry of Idaho, Boise, ID, USA
3
Georgia Center for Cancer Statistics, Emory University, Atlanta, GA, USA
4
Division of Cancer Prevention and Control, National Center for Chronic Disease Prevention and Health Promotion, Centers for Disease Control and Prevention, 4770 Buford Highway, Atlanta, GA 30341, USA
Correspondence: Claudia Allemani, Cancer Survival Group, Department of Non-Communicable Disease Epidemiology, London School of Hygiene and Tropical Medicine, Keppel Street, London WC1E 7HT, UK. Tel +44 20 7927 2855
Claudia.Allemani@lshtm.ac.uk
Abstract Words:248 Now 253 to address reviewers’ concerns. Text Words:
Text pages Tables: 3 Figures: 2
DISCLAIMER: The findings and conclusions in this report are those of the authors and do not necessarily represent the official position of the Centers for Disease Control and Prevention. 3 4 5 6 7 8 9 10 11 12 13 14 15 16 17 18 19 20 21 22 23 24 25 26 27 28 29 30 31 32 33 34 35 36 37 38 39 40 41 42 43 44 45 46 47 48 49 50 51 52 53 54 55 56 57 58 59 60
2
FUNDING SUPPORT: US Centers for Disease Control and Prevention (CDC; 12FED03123, ACO12036).
CONFLICT OF INTEREST DISCLOSURES: None
Precis for use in the Table of Contents: Population-based cancer survival is a key measure of the overall effectiveness of health systems in managing the cancer burden. The high quality of US cancer registry data, 80% population coverage in the CONCORD-2 study and the use of an unbiased estimator of net survival ensure that the survival trends we report are robustly comparable by race and state. These results can be used to plan and evaluate cancer control strategy, in each state and for the US nationally.
3 4 5 6 7 8 9 10 11 12 13 14 15 16 17 18 19 20 21 22 23 24 25 26 27 28 29 30 31 32 33 34 35 36 37 38 39 40 41 42 43 44 45 46 47 48 49 50 51 52 53 54 55 56 57 58 59 60
3
Abstract
Background: Robust comparisons of population-based cancer survival estimates require tight adherence to study protocol, standardized quality control, appropriate life tables of background mortality, and centralized analysis. The CONCORD program established worldwide surveillance of population-based cancer survival in 2015, analyzing individual data on 26 million patients (10 million US patients) diagnosed 1995-2009 with one of 10 common malignancies.
Methods: In this Supplement, we analyzed data from 37 state cancer registries covering approximately 80% of the U.S. population that participated in CONCORD-2. We performed data quality checks in three consecutive phases: protocol adherence, exclusions, and editorial checks. We estimated 1-, 3- and 5-year age-standardized net survival using the Pohar Perme estimator and state- and race-specific life tables of all-cause mortality for each year. We adopted the cohort approach for patients diagnosed 2001-2003 and the complete approach for patients diagnosed 2004-2009.
Results Articles in this Supplement report population coverage, data quality indicators and age-standardized 5-year net survival by state, race and stage at diagnosis. Examples of tables, bar-charts and funnel plots are provided in this article.
Conclusions Population-based cancer survival is a key measure of the overall effectiveness of services in providing equitable health care. The high quality of US cancer registry data, 80% population coverage and use of an unbiased net survival estimator ensure that the survival trends reported in this Supplement are robustly comparable by race and state. The results can be used by policy-makers to identify and address inequities in cancer survival, in each state and for the US nationally.
3 4 5 6 7 8 9 10 11 12 13 14 15 16 17 18 19 20 21 22 23 24 25 26 27 28 29 30 31 32 33 34 35 36 37 38 39 40 41 42 43 44 45 46 47 48 49 50 51 52 53 54 55 56 57 58 59 60
4
INTRODUCTION
Population-based cancer survival is a measure of the overall effectiveness of the health system in in dealing with cancer.1 Comparisons of population-based cancer survival require adherence to a well-designed protocol, standardized quality-control procedures, appropriate life tables of background mortality and centralized analysis with the latest statistical methods.2, 3
CONCORD-2 established world-wide surveillance of cancer survival in 2015, with estimates of 5-year net survival based on individual data for more than 25 million cancer patients (about 10 million patients in the US) diagnosed during 1995-2009 with one of ten common cancers: stomach, colon, rectum, liver, lung, breast (female), cervix, ovary, prostate and leukemia in adults (15-99 years), and acute lymphoblastic leukemia in children (0-14 years).3 Patients were followed up to Dec 31, 2009.
For the articles in this Supplement, we analyzed data from 37 statewide cancer registries (27 funded by the National Program for Cancer Registries (NPCR) program, 5 funded by the Surveillance, Epidemiology and End Results (SEER) program and 5 funded by both NPCR and SEER) that participated in CONCORD-2, covering approximately 80% of the U.S. population, and which agreed to the inclusion of their data in more detailed analyses by stage at diagnosis and by race. The CONCORD protocol required data on stage only for patients diagnosed from Jan 1, 2001, therefore these analyses, focused mainly on survival by stage, were restricted to patients diagnosed during 2001-2009.
Public health surveillance using the data from population-based cancer registries is a key component of cancer control.4 The North American Association of Central Cancer Registries (NAACCR)a develops and promotes uniform data standards for all cancer registries in North America. Participating US registries had to meet the NAACCR certification criteria and to have conducted record linkage with both the state vital records and the National Death Index (NDI) to update the vital status of registered patients. NAACCR members developed a detailed SAS program to map the NAACCR database record structure to the CONCORD protocol and thus to enable all North American registries to exclude cases that would not have been considered reportable primaries according to the International Association of Cancer Registries (IACR) multiple primary rules,5 before their datasets for 1995–2009 were extracted for CONCORD-2. This was necessary because North American registries define
a http://www.naaccr.org/standardsandregistryoperations/volumeii.aspx 3 4 5 6 7 8 9 10 11 12 13 14 15 16 17 18 19 20 21 22 23 24 25 26 27 28 29 30 31 32 33 34 35 36 37 38 39 40 41 42 43 44 45 46 47 48 49 50 51 52 53 54 55 56 57 58 59 60
5
multiple primary cancers under the rules of the Surveillance, Epidemiology and End Results (SEER) program,6 whereas registries in the European Network of Cancer Registries (ENCR) and in other continents generally use the rules of the IACR,5 which are more conservative. Topography and morphology were coded according to the International Classification of Diseases for Oncology (3rd edition; ICD-O-37). Solid tumors were defined by anatomical site (Table 1). For ovarian cancer, we included the fallopian tube, uterine ligaments, and adnexa, and the peritoneum and retroperitoneum, where high-grade serous ovarian carcinomas are often detected; this was done to improve international comparability of the data sets. Kaposi’s sarcoma and solid tumors with lymphoma morphology were excluded from analysis.
Leukemias were defined by morphology. In this Supplement we cover only precursor-cell acute lymphoblastic leukemia in children (ICD-O-3 morphology codes 9727, 9728, 9729, 9835, 9836, 9837). Estimates of survival by race, state and sub-type of adult leukemia will be presented in other publications.
Only primary invasive cancers (ICD-O-3 behavior code 3) were included in survival analyses. We included cancers at a given site regardless of whether the patient had had a previous cancer. If a patient was diagnosed with two or more cancers of a given organ, including paired organs, during 2001-2009, only the first was considered in survival analyses. Follow-up
US registries were asked to submit follow-up data (vital status and date of last known vital status) as at Dec 31, 2009, after conducting linkages of all cancer registrations with both state vital records systems and the NDI. Patients whose cancer registration could not be linked to a death record were considered to be alive on Dec 31, 2009 (passive follow-up, also known as the “presumed alive” method).
SEER registries are required to meet a specific standard for the completeness and recency of follow-up. At least 90% of registered patients not known to be deceased were required to have a date of last known vital status on or after Jan 1, 2010. These follow-up dates could have been obtained from either passive or active follow-up.8
Patients whose survival time was unknown were excluded from analyses. This group comprised patients registered solely from a death certificate or diagnosed at autopsy.
3 4 5 6 7 8 9 10 11 12 13 14 15 16 17 18 19 20 21 22 23 24 25 26 27 28 29 30 31 32 33 34 35 36 37 38 39 40 41 42 43 44 45 46 47 48 49 50 51 52 53 54 55 56 57 58 59 60
6
CONCORD-2 data quality control: three phases
We performed data quality checks in three consecutive phases: protocol adherence, exclusions, and editorial checks. After each phase a detailed report was sent to each cancer registry.
Phase 1: Protocol adherence
We first checked the compliance with the CONCORD-2 protocol of each of 37 variables (demographic characteristics, basis of diagnosis, date of diagnosis, topography, morphology, behavior, stage, vital status, date of last known vital status) in each tumor record in each data set. Any value not specified in the protocol was considered non-compliant. Each registry was sent a table of the number of records and the percentage compliance for each variable, and for each cancer. Minor issues were corrected by the CONCORD Central Analytic Team, after discussion with the registry. For major structural issues, 5 registries corrected and re-submitted their data.
Phase 2: Exclusions
Next, we checked for logical inconsistencies between the variables in each tumor record, for each cancer site. Exclusion criteria were defined a priori, based on the experience within the Cancer Survival Group, the checks performed in the first CONCORD study, the EUROCARE (EUROpean CAncer REgistry based study on survival and care of cancer patients) data quality checks, the checks proposed by the International Agency for Research on Cancer (IARC), the descriptions of morphology in the World Health Organization (WHO)/IARC Classification of Tumors for each cancer and, finally, clinical expertise.3
We produced “exclusion tables” summarizing the quality of each data set. Data quality indicators were tabulated separately for patients diagnosed in 1995-99, 2000-04 and 2005-09, to enable evaluation of trends in data quality over time. We defined three broad categories for exclusion: ineligible (e.g., in situ neoplasm), definite error (e.g., sex-site mismatch) and possible error (e.g., apparent inconsistency between site and morphology). We had requested records of in situ neoplasms to assess the intensity of diagnostic activity, particularly for cancers of the breast and cervix, but in situ neoplasms were not included in survival analyses. The number and percentage of patients excluded from analysis are shown in Table 2.
3 4 5 6 7 8 9 10 11 12 13 14 15 16 17 18 19 20 21 22 23 24 25 26 27 28 29 30 31 32 33 34 35 36 37 38 39 40 41 42 43 44 45 46 47 48 49 50 51 52 53 54 55 56 57 58 59 60
![Table 1 [All solid cancers ] page 1 of 1 Produced 29 July 2016](https://thumb-us.123doks.com/thumbv2/123dok_us/9046577.2802533/24.918.99.869.82.821/table-solid-cancers-page-produced-july.webp)