University of North Florida
UNF Digital Commons
Campus Sustainability Environmental Center
2009
University of North Florida Greenhouse Gas
Emissions Inventory and Projections 2009
Radha PyatiUniversity of North Florida Katrina Norbom University of North Florida Megan Walker-Radtke University of North Florida
Follow this and additional works at:https://digitalcommons.unf.edu/sustainability
Part of theEnvironmental Indicators and Impact Assessment Commons, and theSustainability Commons
This Book is brought to you for free and open access by the Environmental Center at UNF Digital Commons. It has been accepted for inclusion in Campus Sustainability by an authorized administrator of UNF Digital Commons. For more information, please contactDigital Projects. © 2009 All Rights Reserved
Recommended Citation
Pyati, Radha; Norbom, Katrina; and Walker-Radtke, Megan, "University of North Florida Greenhouse Gas Emissions Inventory and Projections 2009" (2009).Campus Sustainability. 3.
University of North Florida
Greenhouse Gas Emissions
Inventory and Projections 2009
By
Radha Pyati, Ph.D.
Katrina Norbom
Megan Walker-Radtke, M.S.
1
Table of Contents
Executive Summary ... 2
Introduction and Significance ... 5
Methodology ... 9
Results ... 10
Projections... 13
Conclusions and Recommendations ... 15
Data and Estimates Used in Calculations ... 16
Institutional Data ... 16
Energy and Resource Use ... 17
References ... 21
Acknowledgements ... 22
About the Authors ... 24
Appendix 1. UNF Sustainability Committee ... 25
2
Executive Summary
This report describes the 2009 greenhouse gas emissions inventory of the University of North Florida. Such inventories are becoming more important as society approaches restrictions on carbon dioxide emissions due to their effects on global warming. Greenhouse gas emissions inventories have been conducted on hundreds of campuses in the United States, as well as thousands of other organizations worldwide, including U.S. private corporations.
An inventory like this generally forms the initial baseline for a campus climate action plan. Climate action plans have also been created by hundreds of universities and other entities. Following the release of this report, a UNF Climate Action Plan will be created by the UNF Sustainability Committee, whose members are listed in Appendix 1, with essential input from the campus community.
Methodology
The UNF Greenhouse Gas Emissions Inventory was conducted using the Campus Carbon Calculator tool developed by Clean Air-Cool Planet. This tool is a spreadsheet workbook containing input fields for campus data and extensive calculations on greenhouse gas emissions and projections of future emissions. It is available free of charge and conforms to standards set by the U.N. Intergovernmental Panel on Climate Change (IPCC).
Campus data were collected by UNF Environmental Center staff between 2008 and 2010, obtained through library resources and by request of specific pieces of information from individuals in a wide variety of campus departments. The draft report was reviewed by several individuals inside and outside UNF.
Major Findings
UNF’s net greenhouse gas (GHG) emissions in 2009 were 74,229 metric tonnes of carbon dioxide equivalents (MT eCO2), or 18.9 MT per gross square foot, or 5.3 MT per student. In a
rough comparison, the University of Florida’s total was 350,311 MT, or 17.5 MT per gross square foot, or approximately 8.8 MT per student.
3
The breakdown of how UNF’s 2009 GHG emissions are generated appears in the pie chart below.
Purchased electricity generates by far the largest fraction of GHG emissions at 52%, followed by Commuting by faculty, staff and students, which totals 28%. Then several other sources make roughly equivalent contributions: Directly Financed Air Travel (6%), On-Campus Stationary (5%), and Scope 2 T&D Losses (5%). On-Campus Stationary consists largely of natural gas use, and Scope 2 T&D Losses are transmission and distribution losses from purchased utilities like electricity.
Stationary combustion sources at UNF emitted 3,393 MT in 2009. They fall below the reporting limit established by the U.S. Environmental Protection Agency for large facilities like plants and universities if their emissions from stationary sources exceed 25,000 MT of eCO2 annually.
4
Projected emissions suggest a steady increase in GHG emissions in the absence of mitigation projects. Projections to 2025 are important because Governor Charlie Crist has issued an executive order setting a goal for state government to reduce GHG emissions by 40% by 2025. Conclusions and Recommendations
The UNF GHG emissions inventory reveals that purchased electricity and commuting provide the largest contributions to UNF’s carbon footprint. These two items are often the top three contributors at many other campuses. These data will serve as the baseline toward reducing our greenhouse gas emissions as an essential component of UNF's sustainability mission. Without a climate action plan and some mitigation efforts, projections indicate a steadily rising level of GHG emissions.
Recommendations will largely take the form of a climate action plan. The UNF Sustainability Committee is charged with developing this plan, which will be formulated by staff and faculty from numerous divisions on campus, most particularly Physical Facilities and Facilities Planning.
While the climate action plan is under development, the UNF Environmental Center has initiated two projects to study purchased electricity usage and commuting, because they are the two most significant contributors to UNF’s carbon footprint. The first study will examine energy use by individual buildings or units, in order to develop solutions for those individual entities. The second study is a survey of commuting preferences for students, faculty and staff during the 2010-2011 academic year, in hopes of generating proposals for mass transit routes on frequently traveled routes.
5
Introduction and Significance
This report describes the 2010 greenhouse gas (GHG) emissions inventory of the University of North Florida (UNF). Such inventories are becoming more important as society approaches restrictions on carbon dioxide emissions due to their effects on global warming. Greenhouse gas emissions inventories have been conducted on hundreds of campuses in the United States, as well as thousands of other organizations worldwide, including U.S. private corporations. An inventory like this generally forms the initial baseline for a campus climate action plan. Climate action plans have also been created by hundreds of universities and other entities. Following the release of this report, a UNF Climate Action Plan will be created by the UNF Sustainability Committee, whose members are listed in Appendix 1, with essential input from the campus community.
The Importance of Performing GHG Emissions Inventories
“Most of the observed increase in global average temperatures since the mid-20th century is very likely due to the observed increase in anthropogenic GHG [greenhouse gas] concentrations. It is likely that there has been significant anthropogenic warming over the past 50 years averaged over each continent (except Antarctica)….Anthropogenic warming over the last three decades has likely had a discernible influence at the global scale on observed changes in many physical and biological systems.”
U.N. Intergovernmental Panel on Climate Change (IPCC) Fourth Assessment Report, Summary for Policymakers [1]
The reality of anthropogenic climate change is not in doubt. The debate over whether industrialized societies are altering Earth’s climate system through emissions of greenhouse gases, such as carbon dioxide, methane, and nitrous oxide [2], has ended among the atmospheric science community. Even while the political debate continues, conscientious leaders of public and private institutions are already taking the necessary steps to understand their contribution to this truly global crisis.
The motivation for corporate interests to calculate their GHG footprint is primarily financial. Many environmental policy experts are convinced that a global price on GHG (whether via a tax or the implementation of a “cap and trade” program) is an inevitable and required step to reduce greenhouse gas emissions. Such a price on GHG would likely incur a substantial increase in operating expenses, especially on corporations and businesses with large energy and material expenditures. Prudent and pragmatic business leaders are wise to calculate what their taxable GHG emissions are likely to be prior to any legislative action.
A detailed and rigorous GHG footprint calculation not only reveals about where GHG emissions are produced, but also allows one to determine where those emissions can be most easily and cost-effectively reduced. By picking the "low-hanging fruit," businesses can reduce their taxable burden and obtain a competitive advantage if and when a price on GHG is introduced. In
addition, investors and consumers are increasingly interested in supporting sustainable, climate-conscious business practices. The performance of a thorough GHG emissions inventory and the development of a rigorous emissions reduction plan demonstrate the commitment to climate
6
change mitigation required to remain competitive among such developing consumer and investor demographics.
The motivation for academic institutions to perform a GHG footprint analysis is generally two-fold, based on financial considerations as well as a sense of intellectual and civic responsibility. The financial considerations are similar to those of a large corporation. Like corporations, universities are also financially vulnerable to the implementation of a price on GHGs, because they require large energy inputs to sustain themselves to power buildings, supply laboratories, transport students, and grow and maintain the campus. Students, who are universities’
consumers and investors, are also beginning to hold their institutions to a higher standard of sustainability. Current students are encouraging sustainability and climate change mitigation measures on campus, while prospective students are increasingly basing their enrollment decisions on a university’s commitment to sustainability.
Beyond the financial considerations are the intellectual and civic motivations, which are indeed primary for many universities that have performed a detailed inventory of their GHG emissions. Academic institutions are quite often a microcosm of their parent communities, and this, coupled with vast intellectual resources, provides them an ideal opportunity to serve as leaders in the understanding and mitigation of industrial GHG emissions.
A university is essentially a small city, with residential (dormitories), light commercial (offices and classrooms), heavy commercial (laboratories and manufacturing facilities), and support services intricately connected and contained within a relatively small campus area. These institutions frequently use the same fuel mixture as their parent communities, and consume a representative sample of material goods and services such as food, potable water, building materials, laboratory materials, and office supplies purchased from regional suppliers. They also embody many regional habits and preferences common to their parent community, such as a predilection for large passenger vehicles among their commuting population, or, conversely, widespread use of public transit.
The breakdown of GHG emission sources on a university campus is therefore likely to mirror the breakdown of sources within its parent community. By identifying where a university’s GHG footprint accurately represents that of its parent community and where it does not, the
university’s footprint can often be scaled up to illuminate the likely GHG footprint of cities in that university’s geographic region.
Here in Florida, Governor Charlie Crist has placed a strong emphasis on climate change mitigation within the state, giving UNF additional motivation to study and understand the sources and magnitude of our greenhouse gas emissions. In 2007, Governor Crist signed an executive order that set a goal of significantly reducing the greenhouse gas emissions of both state government as well as electric utilities [3]. This goal was to reduce GHG baseline emissions by 10% in 2012, by 25% in 2017, and by 40% in 2025. Florida state government has performed a 2006-2007 baseline greenhouse gas inventory of its own emissions and is now working to meet benchmarks of reduction, eventually resulting in a 40 percent reduction in baseline emissions by 2025. Florida’s electric utilities will follow a similar emissions reduction program, resulting in emissions 20 percent below 1990 levels by 2050. In addition, Governor Crist has adopted
7
California’s strict passenger vehicle greenhouse gas emissions standards, effective for new vehicles beginning in 2009, and has allocated over $175 million dollars in federal funding to deploy renewable energy and energy-efficient technologies.
Governor Crist’s initiatives have set a strong and progressive standard of climate change mitigation within the State of Florida. UNF wishes to engage in the spirit of these initiatives hold itself to a similarly high standard by voluntarily calculating our annual GHG emissions and developing emissions reduction strategies. It is our hope that leading by example will raise awareness of the importance of GHG emissions inventorying and encourage not only other public and private institutions, but also our individual students, faculty, and staff, to understand and reduce their greenhouse gas emissions.
The Precedent: Previously Completed GHG Emissions Inventories
Private Enterprises
Several registries are available which list private corporations, non-profits, (some) academic institutions, and government entities that have voluntarily calculated their annual GHG emissions. Among the largest are the Environmental Protection Agency’s (EPA) Climate Leaders Program, The Climate Registry, and the Carbon Disclosure Project.
The Carbon Disclosure Project (CDP), a non-profit launched in the United Kingdom in 2000 to collect and disclose greenhouse gas emissions data and climate change mitigation strategies of companies around the globe, reports that, in 2009, almost 2500 organizations in 60 countries voluntarily reported their annual carbon emissions and mitigation strategies so that investors, corporations, and governments could make informed climate change mitigation decisions [4]. Participants in the United States represent all aspects of commerce, including but not limited to: manufacturing, energy production, transportation, financial services, software and technology, pharmaceuticals, health care, food and beverage production, agriculture, and insurance. The CDP has set standards that require the reporting of both direct and indirect emissions of carbon dioxide, but that also encourage the reporting of direct and indirect emissions of methane, chlorofluorocarbons, hydrofluorocarbons, perfluorocarbons, and sulfur hexafluoride in metric tons of equivalent carbon dioxide. These emissions inventories are publicly available through the CDP website and offer a detailed breakdown of the source and nature of participants’ greenhouse gas emissions.
Many additional businesses and corporations have likely performed greenhouse gas inventories for their own edification but have chosen not to publicly disclose the results through a central registry. While it is difficult to quantify the number and nature of these private inventories, one can estimate that the number is significant compared to those that have been reported through such organizations as the Climate Leaders Program, The Climate Registry, and the CDP. International consulting companies as well as continuing education programs at major universities have developed to assist businesses and corporate enterprises in calculating and mitigating their annual carbon emissions. Some of these consulting companies list a selection of their most recent clients on their website, and the diversity of these clients supports the
8
hypothesis that more private enterprises are performing greenhouse gas emissions inventories than are reporting them through central registries.
Academic Institutions
Some colleges and universities also participate in the national and international programs and registries listed above. However, the largest national database of campus-specific greenhouse gas emissions inventories is maintained by the ACUPCC (American College & University Presidents’ Climate Commitment) [5]. Currently, approximately 500 campuses have filed their inventories within the ACUPCC reporting tool. Historically the Association for the
Advancement of Sustainability in Higher Education (AASHE) has also maintained these inventories. UNF chose to also utilize this tool for the performance of our emissions inventory, as adherence to this widely-utilized standard facilitates a more rigorous comparison of
greenhouse gas emissions among many of the nation’s leading academic institutions.
A GHG inventory is also a requirement of various presidential commitments on environmental responsibility. President John Delaney will sign the American College & University Presidents’ Climate Commitment (ACUPCC) and the Talloires Declaration in October 2010. Both of these call for a GHG inventory and climate action plan. The ACUPCC lists 674 signatories as of August 12, 2010, and has been signed by all but four institutions in the Florida State University System.
EPA Mandatory Reporting Rule
Another legal requirement related to GHG emissions is EPA’s Mandatory GHG Reporting Rule, issued in 2009, which states that facilities emitting 25,000 metric tonnes of carbon dioxide equivalents from on-campus stationary sources must report their emissions [6]. These facilities include electric utilities, factories, and other large entities like campuses. UNF’s primary on-campus stationary generation of GHG comes from its use of natural gas. Based on the findings from this inventory process, UNF is not currently required to report its emissions per this rule because its emissions are lower than 25,000 MT eCO2.
UNF’s Sustainability Efforts
This GHG inventory fits into a wide-ranging effort to enhance UNF’s performance and
leadership in the area of sustainability. UNF seeks to be a leading example of green universities in the Southeast. The Sustainability Committee was formed in 2009 to guide the strategic
development of these goals. The Environmental Center has become heavily involved in AASHE and is presenting results of two projects at its next annual meeting. And as mentioned earlier, President Delaney will sign the ACUPCC and the Talloires Declaration.
9
Methodology
The UNF Greenhouse Gas Emissions Inventory was conducted using the Campus Carbon Calculator tool developed by Clean Air-Cool Planet. This tool is a spreadsheet workbook containing input fields for campus data, enabling extensive calculations on greenhouse gas emissions and projections of future emissions. It is available free of charge and conforms to standards set by the U.N. Intergovernmental Panel on Climate Change (IPCC).
Campus data were collected by UNF Environmental Center staff between 2008 and 2010, obtained through library resources and by request of specific pieces of information from
individuals in a wide variety of campus departments. Most data reflects FY 2008; some FY 2009 data were included. The draft report was reviewed by several individuals inside and outside of UNF.
Description of Campus Carbon Calculator
The Campus Carbon Calculator (CCC) is a tool developed to generate greenhouse gas emissions inventories [7]. It was written by Clean Air – Cool Planet, a nonprofit organization whose mission is the development of solutions to global warming. The CCC is a collection of linked Excel spreadsheets. Campus users input data into four of the spreadsheets, and then numerous calculations and projections are generated from it. Version 6.5 of the CCC was used in this study.
The CCC is the tool recommended by the ACUPCC and by AASHE for universities because its calculations are tailored for campuses. It is based upon work done by the IPCC as well as upon the Greenhouse Gas Protocol developed by the World Resources Institute and the World
Business Council on Sustainable Development. Alternatives to the CCC include the full Protocol above and Climate Action Registry Reporting Online Tool (CARROT). The full Protocol is not designed for campuses. CARROT was originally written to conform to California standards and is not designed for campuses.
Data entered into the CCC were obtained from a variety of sources between 2008 and 2010. Some data came from the UNF Budget Book, available at the Thomas G. Carpenter Library. Other information came from email correspondence or face-to-face interviews with UNF staff. All data sources are identified and described briefly in the section of this report entitled “Data and Estimates Used in Calculations.” The official definitions established by CACP for each data heading are provided in Appendix 2, which is an excerpt of the Campus Carbon Calculator User’s Guide.
The CCC uses the input data to calculate emissions of carbon dioxide, methane and nitrous oxide. The other greenhouse gases are converted into carbon dioxide equivalents. Its
spreadsheets contain tables of emissions factors that convert all kinds of input data, from dollars spent on purchased electricity to total miles commuted, into carbon dioxide equivalents. These factors have been computed from U.S. government documents.
10
Results
UNF’s net greenhouse gas (GHG) emissions in 2009 were 74,229 metric tonnes of carbon
dioxide equivalents (MT eCO2), or 18.9 MT per gross square foot, or 5.3 MT per student. Table
1 below provides emissions relative to several institutional variables. Table 1. UNF GHG Emissions in 2009 Relative to Institutional Variables
Category and measure GHG
Kilograms eCO2 per dollar of operating budget 1.247
Kilograms eCO2 per dollar of research budget 8.1
Kilograms eCO2 per dollar of energy budget 14.6
MT eCO2 per student 5.3
MT eCO2 per community member (students, faculty and staff) 4.5
Kilograms eCO2 per square foot building space 18.9
Kilograms eCO2 per square foot research space 1,765
As a rough comparison, the University of Florida’s total was 350,311 MT, or 17.5 MT per gross square foot, or approximately 8.8 MT per student.
The breakdown of how UNF’s GHG emissions are generated appears in Figure 1 below.
11
Purchased electricity generates the largest fraction of GHG emissions at 52%. The second highest single contributor is student commuting at 20%. Adding that to the 8% for faculty/staff commuting brings the contribution of commuting overall to 28%.
Several other smaller sources contribute to the overall emissions profile. Directly financed air travel comprises 6%, on-campus stationary sources and Scope 2 T&D Losses each account for 5%. T&D losses are transmission and distribution losses from purchased electricity. Solid waste and study abroad travel each make up 2%. Direct transportation from the vehicle fleet is quite small and rounds up to 1%. Emissions from paper are accounted for in the inventory but are low enough to comprise 0% on the scale of this chart.
Stationary combustion sources at UNF emitted 3,393 MT in 2009. This amount falls well below the reporting limit established by the EPA calling for large facilities like plants and universities to report stationary emissions sources if they exceed 25,000 MT carbon dioxide annually. At UNF, these sources consist primarily of natural gas for boilers, domestic and hot water heating, and pool heaters.
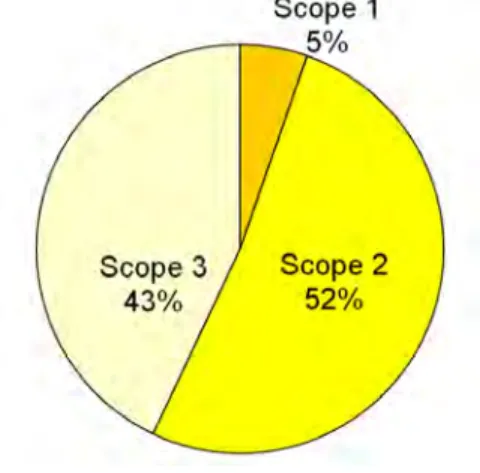
Another way of analyzing the results that is commonly used in the GHG emissions inventory commuting is consideration of the three scopes of emission. Scope 1 consists of direct GHG emissions from on-campus sources, like natural gas combustion, transportation by the vehicle fleet, co-generation plants, and others. Scope 2 is comprised of purchased electricity, natural gas, and chilled water; these require GHG emission to generate, but the emission does not originate on campus. These are considered indirect emissions. Scope 3 consists of numerous GHG generators that come from smaller, more individualized sources, such as commuting, campus-financed travel, paper, and others. These are also indirect emissions.
Scopes 1 and 2 are generally considered the most significant, because they usually comprise a very substantial portion of GHG emission and are accurately measurable. Scope 3 is generally the most difficult to measure accurately, because it comes from a wide variety of small and often individualized sources. UNF’s breakdown by Scope is shown in Figure 2 below.
Figure 2. GHG Emissions by Scope, 2009.
Scope 2 mirrors UNF’s purchased electricity contribution at 52%. Scope 3, from indirect sources, adds up to a contribution of 43% that is nearly as high as Scope 3. Scope 1 originates
12
from natural gas and direct transportation. Clearly Scope 2, UNF’s indirect emissions from electricity purchase, is the largest of these. But reductions in Scope 3 would also impact the overall picture of GHG emissions.
Caveats to the Inventory
This inventory includes the major contributors to GHG production, but some factors were not included due to time constraints or inaccessibility of information, including refrigerant losses and propane use.
13
Projections
UNF’s projected GHG emissions through 2025 appear in Figure 3 below. These projections are generated by assumptions and calculations in the spreadsheet that address inflation and other predictably changing variables. Growth trends were assumed to be linear for institutional data fields. Projections to 2025 are important because Governor Charlie Crist has issued an executive order setting a goal for state government to reduce GHG emissions by 40% by 2025.
Figure 3. Projected UNF Greenhouse Gas Emissions through 2025. Projected emissions by Scope are provided in Figure 4 below.
14
Projected emissions suggest a steady increase in GHG emissions in the absence of mitigation projects.
15
Conclusions and Recommendations
The UNF GHG emissions inventory for 2009 reveals that purchased electricity, commuting, and on-campus stationary sources provide the largest contributions to UNF’s carbon footprint. These three items are most commonly the top three contributors at many other campuses. These data will serve as the baseline toward reducing our greenhouse gas emissions as an essential
component of UNF's sustainability mission. Without a climate action plan and some mitigation efforts, projections indicate a steadily rising level of GHG emissions.
Recommendations will largely take the form of a climate action plan. The UNF Sustainability Committee is charged with developing this plan, which will be formulated by staff and faculty from numerous divisions on campus, most particularly Physical Facilities and Facilities Planning.
While the climate action plan is under development, the UNF Environmental Center has initiated two projects to study purchased electricity usage and commuting, because they are the two most significant contributors to UNF’s carbon footprint. The first study will examine electricity usage by individual buildings or units, in order to develop solutions for those individual entities. The second is a survey of commuting preferences of students, faculty and staff.
The electricity study is a particularly important approach to reducing GHG emissions, because purchased electricity usage has two key features distinguishing it from commuting. First, purchased electricity is accurately measurable, unlike commuting, which is an estimate based upon driving behavior of several thousand individuals. Second, purchased electricity usage can be directly attenuated by specific infrastructural changes, such as energy-efficient appliances or lighting, rather than changes in behavior of the campus population that are difficult to monitor or enforce. This study will be undertaken in cooperation with Physical Facilities.
The second study is a survey of commuting preferences for students, faculty and staff during the 2010-2011 academic year. This survey will be combined with the results of the commuting study undertaken to quantify commuting patterns that is described in the next section. The two studies will be integrated and presented to entities inside and outside UNF in hopes of generating proposals for mass transit routes on frequently traveled routes.
16
Data and Estimates Used in Calculations
Institutional Data
Institutional data about the UNF campus required by the CCC falls into three categories: budget, population, and physical size.
Budget
The budget data is divided into three parts: operating budget, research dollars, and energy budget.
Operating budget was obtained from the heading “Operating Budget” in the UNF Budget Book available at the reference desk at the Thomas G. Carpenter Library.
Table 2. Operating Budget By Year
2008-2009 2009-2010
$77,579,773 $65,485,561
Research dollars was obtained from the heading “Contracts and Grants” in the UNF Budget Book. Research dollars is defined by CACP as research grants from external sources. Table 3. Research Dollars By Year
2008-2009 2009-2010
$12,584,527 $10,051,411
Energy budget was obtained by summing several pieces of data in the UNF Budget Book, as noted below in the table.
Table 4. Energy Budget By Year
2008-2009 2009-2010
Student university fund-electricity $6,471 not separated out
Athletics $72,536 $120,785
E&G General Fund – electricity $2,843,137 $3,888,995
E&G General Fund – natural gas $272,000 $418,958
Auxiliary- electricity $874,129 $1,104,396
Auxiliary- natural gas $50,860 $46,904
Total $4,119,133 $5,580,038
17
Population data is divided into five categories: full-time students, part-time students, summer students, faculty and staff. These data for 2008-2009 and 2009-2010 were provided by Institutional Research.
Table 5. Student, Faculty, and Staff Population By Year
2008-2009 2009-2010 Full-time students 10,388 11,228 part-time students 5,042 5,491 summer students 9,980 10,261 faculty 619 830 staff 1,115 1,642 Physical size
Physical size data is divided into two categories: total building space, and total research building space. These data for 2008-2009 and 2009-2010 were provided by Institutional Research.
Table 6. Building Space and Research Building Space By Year
2008-2009 2009-2010
Total building space (sqft) 3,845,599 3,933,081
Total research building space (sqft) 41,307 42,050
Energy and Resource Use
The CCC divides energy and resource use into three Scopes. Scope 1 is considered to be direct GHG emissions and addresses on-campus stationary sources, including natural gas, heating oil, propane, coal, and other carbon-based fuels burned on campus; direct transportation, such as gasoline and diesel fuel for the vehicle fleet; refrigerants and chemicals; and agriculture,
including synthetic fertilizer application. Scope 2 covers purchased electricity, steam, and chilled water. Scope 3 encompasses a variety of other categories, including commuting, travel, and solid waste.
Scope 1
UNF uses very few resources that fall into Scope 1: natural gas, gasoline for vehicle fleet, diesel for vehicle fleet, and synthetic fertilizer application.
Natural gas in FY09 was 53,857 MMBTUs and in FY10 was 64,113 MMBTUs, provided by Physical Facilities.
Gasoline fleet in 2008 was 24,498 gallons, provided by Physical Facilities; the same value was assumed to be a good estimation for 2009.
18
Diesel fleet in 2008 was 2,405 gallons, provided by Physical Facilities. 30,800 gallons were used for a full year by the Osprey Connector, provided by Auxiliary Services. The same values were assumed to be good estimations for 2009.
Synthetic fertilizer application was 3,900 pounds, provided by Physical Facilities; the same value was assumed to be a good estimation for 2009.
Scope 2
Within Scope 2, UNF purchases only electricity and no steam or chilled water. In 2008 UNF purchased 55,468,140 kilowatt-hours of electricity from JEA, and in FY10 UNF purchased 63,873,092 kWh, provided by Physical Facilities.
Scope 3
Scope 3 covers commuting to campus, directly funded travel, waste processing activities, paper and transmission and distribution losses from electricity (T&D).
Commuting
Reporting the impact of commuting to campus required several pieces of information not currently collected by any campus entity. These items included the average commuting distance in miles, the miles per trip, the number of trips per week, and the number of weeks per year commuted. To determine these answers, the UNF Environmental Center commissioned a study by Dr. David Lambert and Robert Richardson of CCEC. This study was a GIS analysis of data provided by the Registrar’s Office and Parking and Transportation Services on student addresses and days of the week commuting to UNF. The study yielded calculations of the average miles per trip and the number of trips per week. These two values were used in the CCC, and the same values were used for 2008 and 2009. Students living in campus dormitories or in apartment complexes within walking distance from campus were removed from the model.
The average miles per trip were determined to be 15 miles. Although this data originated from student behavior, the same value was used for both faculty and staff. This assumption was made because no other more accurate data exists for faculty and staff, and because the campus is not located in a densely populated residential area dominated by students who walk, ride bicycles or ride a bus.
The study yielded an average of 6.7 trips per week to campus. Although this data originated from student behavior, the same value was used for faculty, because many faculty members do not come to campus every weekday. Trips per week were assumed to be ten for staff, comprising five round trips.
Weeks per year for students and faculty was assumed to be 32 based upon spring and fall
semesters. No more accurate estimate was available. For staff, weeks per year was assumed to be 50.
It was assumed that no students, faculty or staff ride the bus to UNF. While this may not be completely accurate, anecdotal observations indicated that the campus does not have enough bus riders to have a strong impact on emissions.
19
Travel
Directly funded travel was estimated using the total expenditures for airline travel paid for on purchasing cards, which was provided by Financial Services. The value for this was $989,994. Converting expenditures to miles was done by using a value of 15.31 cents paid per mile,
obtained from the Air Transport Association for 2008 [9]. This value does not account for airport and other taxes, which often comprise 20% of the total price paid, so the value was then
multiplied by 1.2 to get a final price per mile of 18.37 cents per mile. So $989,994 divided by $0.1837 yields 5,389,189 miles.
Study abroad travel was estimated by the UNF International Center to be 1,493,240 miles.
Solid Waste
Solid waste in tons was provided by Physical Facilities. It was 2,280,820 pounds in 2008 and 2,139,660 pounds in 2009.
T&D losses were calculated from Scope 2 data by the CCC; no data were entered to determine it.
Paper
Data on paper purchased was provided by OfficeMax staff . Several different orders of paper were purchased over the course of the year, the majority of which was not recycled. A small fraction was recycled, and of that most was 30% recycled with very small amounts of 100% and other percent recycled. All the recycled paper was estimated to be 25% recycled for the purposes of the CCC.
Table 7. Paper Purchased and its Recycled Content By Year
2008-2009 2009-2010
0% Recycled 145,102 154,707
20 Custom Fuel Mix
JEA is the local utility providing electricity to UNF. The custom fuel mix used by JEA in 2008 was used in the CCC calculation and appears below [8]. Items in the custom fuel mix were matched to the closest category available in the CCC.
Table 8. Custom Fuel Mix used by JEA.
Fuel Source
Percentage in Fuel Mix Reported
by JEA Closest Category in CCC
Coal 51% Coal
Petroleum coke 19% Residual Oil
Coal (power purchase) 10% Coal
Oil 1% Distillate Oil
Natural Gas 14% Natural Gas
Other 5% Net Purchased
21
References
1. “Summary for Policymakers." IPCC Fourth Assessment Report: Climate Change 2007. United Nations Intergovernmental Panel on Climate Change, 2007.
2. “Chapter 2: Changes in Atmospheric Constituents and in Radiative Forcing”. Climate Change 2007: The Physical Science Basis. Contribution of Working Group I to the Fourth Assessment Report of the Intergovernmental Panel on Climate Change.
Intergovernmental Panel on Climate Change, 2007.
3. “Governor Crist Signs Executive Orders to Reduce Greenhouse Gases.” July 13, 2007.
4. “What We Do: Overview.” Carbon Disclosure Project.
5. “ACUPCC Reporting System,”
6. "Mandatory Greenhouse Gas (GHG) Reporting" Rule (40 CFR 98), Environmental Protection Agency, October 30, 2009.
accessed August 30, 2010.
7. “Clean Air – Cool Planet Climate Action Toolkit,”
8. “The JEA News Center: Company Statistics,”
9. “Association’s Monthly Passenger Yield: Cents per RPM,”
22
Acknowledgements
The creation of this report would not have been possible without the generous support and cooperation of many individuals and organizations. The list of those at UNF who assisted with this effort is a long one. In particular, we wish to thank Richard Crosby, retiring Associate Vice President of Administration and Finance, who has been both an inspiration to us and a champion of the greater goal of environmental stewardship.
We also express great gratitude to the following UNF staff and associates: Michael Biagini, Financial Systems
Eileen Brady, Thomas G. Carpenter Library David Goedtke, OfficeMax
Cynthia Haile, Parking & Transportation Services John Hale, Physical Facilities
Wallace Harris, Physical Facilities Gene Hart, Institutional Research Chuck Hubbuch, Physical Facilities
Dr. J. David Lambert, College of Computing, Engineering, and Construction Robert McCracken, Physical Facilities
Robert Richardson, College of Computing, Engineering, and Construction Kathryn Ritter, Purchasing
Timothy Robinson, International Center Vince Smyth, Auxiliary Services
Paul Yeoman, Physical Facilities Fen Yu, Institutional Research Office of the Registrar
The technical aspects of working on this project were challenging, and we are very grateful for technical support and guidance from Claire Roby and Jennifer Andrews of Clean Air – Cool Planet and from Niles Barnes of AASHE.
We also thank the reviewers who read the draft of this report to ensure that it was accurate, relevant, and readable:
David Newport, Director, Environmental Center, University of Colorado
Linda Kogan, Director of Sustainability, University of Colorado at Colorado Springs Niles Barnes, AASHE
Dona Kerlin Colleen Herms Richard Crosby
We wish to thank the staff of the UNF Environmental Center, who are the most talented and dedicated group at UNF. Derrick Robinson, Colleen Herms, and Cheryl Pakidis worked on sustainability issues throughout the 2009-2010 academic year and are continuing this year. And
23
April Moore, the Center’s Program Manager, provides inspired and thoughtful leadership to UNF’s sustainability effort.
Finally, Radha Pyati wishes to express gratitude to her co-authors Katrina Norbom, who broke a monumental task into manageable pieces and did it with grace and style, and Megan Walker-Radtke, who brought significant expertise and insight to the project.
24
About the Authors
Radha Pyati is the Director of the UNF Environmental Center and Associate Professor of Chemistry. She earned a Ph.D. in chemistry from the University of North Carolina at Chapel Hill. Her research interests include imaging flow cytometry.
Katrina Norbom is a yoga teacher for people of all ages, an artist, and a community garden project leader. She is currently studying herbal medicine in the Appalachian Mountains and is aspiring to become a doctor of homeopathic medicine. She received a bachelor's degree, from the University of North Florida, in International Studies, with a focus on Environmental Science. She worked with the Environmental Center on various sustainability projects including the greenhouse gas emissions inventory, a recycling program, and community garden projects. She also became the Wildlife Sanctuary's primary Environmental Education Program coordinator at the University of North Florida. In her free time, Katrina loves to be with family and friends, travel, hike in the beautiful Appalachian Mountains, bike, swim, dance to live music, meditate, do yoga, and create works of art.
Megan Walker-Radtke is an atmospheric scientist, environmental educator, and writer. She received her bachelor's degree in Physics from the University of Tulsa and her master's in Earth and Atmospheric Science from Purdue University. Her passions include learning and communicating about the natural world, our role in it, and our impacts on it; natural hazards education, mitigation, and response, especially as related to extreme weather phenomena; promoting sustainable development that respects both natural and human systems; and all facets of meteorology and climatology. In her free time, Megan enjoys as much travel as she can possibly afford and all manner of outdoor activities, from hiking and kayaking to scuba and skydiving. She believes that life is an adventure, and one she plans to explore and experience to its fullest potential.
The mission of the UNF Environmental Center is to establish, develop and support cross-disciplinary education and research related to the environment. The Center fosters programs for students, faculty, and staff to pursue environmental activities through academics, research, and extracurricular activities. The Center conducts and supports campus infrastructural projects involving sustainability and the campus’s natural environment. The Center develops connections and collaborations among university entities, and between the university and the region.
The UNF Environmental Center is the coordinating body for UNF’s sustainability efforts. April Moore, the Center's Program Manager, serves as the Chair of the Campus Sustainability
25
Appendix 1. UNF Sustainability Committee
Chair: April Moore, Program Manager, UNF Environmental Center Justin Camputaro, Student Union
Signe Evans, Library
AyoLane Halusky, Wildlife Sanctuary, Recreation Wallace Harris, Physical Facilities
Colleen Herms, President, Sawmill Slough Conservation Club Chuck Hubbuch, Physical Facilities
Erin Largo-Wight, Department of Public Health, Brooks College of Health Zak Ovadia, Facilities Planning
Radha Pyati, Director, UNF Environmental Center, and Department of Chemistry, College of ` Arts and Sciences
Tony Rossi, Department of Biology, College of Arts and Sciences Vince Smyth, Auxiliary Services
26
Appendix 2. Definitions of Data Collected from Clean Air - Cool
Planet
Definitions are attached (excerpt from the Clean Air – Cool Planet Campus Carbon Calculator, Supplementary Materials).
©2001-2008 Clean Air-Cool Planet, Inc. All Rights Reserved
Clean Cool Planet, Campus Carbon Calculator, and the Clean Cool Planet logo are trademarks of Clean Air-Cool Planet, Inc.
32
Supplementary Materials
Appendix 1: Data Collection Outline
This outline summarizes the data you will need to collect to complete an emissions inventory and offers suggestions of people to contact to find this information. This information may also me useful when collecting data for project ideas, so be sure to stay in touch with these key individuals.
I. Institutional Data
It may seem odd to start a greenhouse gas emissions inventory by collecting data on your institution’s budget, population, and physical size, but this data is important to normalize your emissions for comparison with other institutions and for projecting future emissions trends. This data should also be fairly easy to find. That said, the number of full-time equivalent students, staff and faculty, and the number of gross square feet, are the most important pieces of information in this section—the rest is nice to know, but not worth expending a lot of time or effort on if not readily available.
a. Budget:
Contact: Controller’ Office
Data: Annual operating, research, and/or energy budget
Definitions or parameters: The Operating Budget consists of all sources of funding the University has financial control of and is plainly considered as the cost to operate the institution. Research Dollars includes all sources of financial funding the institution receives for its cumulative research endeavors. The Energy Budget is total spent providing the energy needs for all operations.
Units: Nominal dollars (i.e. 2005 dollars for 2005 budget, 2006 dollars for 2006 budget) Entry Sheet: Input_InflAdj
Entry Info: Budget data is generally maintained in nominal dollar values for each year (2005 dollars in 2005, 2006 dollars in 2006, and so on). Enter these values on the Input_InflAdj worksheet. To allow meaningful comparisons across a historical timeframe, this sheet automatically adjusts budget data to 2005 dollars using the U.S. Bureau of Economic Analysis’ chained GDP deflator values. Projected deflator values are taken from the U.S. Department of Energy’s Annual Energy Outlook. These values will need to be updated as more accurate numbers become available, or if a new base year is selected. To ensure accurate adjustments in the future, it is very important that you enter budget info in nominal dollars from the appropriate year (enter the 2006 budget in 2006 dollars), and keep a record of these values. This should be easy because budget values will probably be reported in nominal dollars, so you need only enter these on the Input_InflAdj sheet and then ensure they are not changed.
b. Population
Contact: Institutional Research and Assessment (best); or, try Registrar / Human Resources Data: Annual number of faculty, staff, and full-time, part-time, and summer school students Definitions or parameters: In the case of faculty and staff, you are looking for full-time equivalents. Different institutions have different formulas for coming up with these numbers; in fact, the same institution might have different formulas used for different purposes by different offices! The most important thing is that you are using a number derived from the same source/methodology from year to year. The Calculator generally counts part-time students as half-time; if your IR or Registrar’s office has a different average equivalency for part-time students, you will need to either adjust your input numbers, or change the projection
©2001-2008 Clean Air-Cool Planet, Inc. All Rights Reserved
Clean Cool Planet, Campus Carbon Calculator, and the Clean Cool Planet logo are trademarks of Clean Air-Cool Planet, Inc.
33
and commuting formulas in the Calculator. The number of summer school students is included for reference, but not used in any calculations (so don’t spend too much time on this number!) Units: Number
Sheet: Input c. Physical Size
Contact: Institutional Research and Assessment / Energy Manager / Director of Facilities Data: Annual total building space and research building space
Definitions or Parameters: Typically campus planners/development officers will keep records of square foot space which may include many details you would not normally consider in assessing building space, such as wall, stair and window space. We recommend using gross square foot data here. Remember, your organizational boundaries should guide your data collection; make sure they remain consistent (i.e., if your institution is renting out building space, include this gross square footage here only if information about the utilities for the space in question is also being included.) FYI, building space, like everything else, is meant to be tracked on the basis of fiscal years.
Units: Square feet Sheet: Input
II. Scope 1 (Direct) Emissions Sources
a. On Campus Stationary Sources: all fuel used on campus, excluding vehicle fuel use Contact: Energy Manager / Director of Facilities / Fuels Purchaser
Data: Annual on-campus stationary fuel use (residual oil, coal, natural gas, wood chips, etc.). Annual output and generation efficiency for electricity and steam from any cogeneration (combined heat and power) plants
Definitions and Parameters: On-campus stationary sources generally account for the majority of Scope 1 emissions. The category includes all emissions from stationary fuel combustion – mostly oil, coal, or natural gas for heating campus buildings. If you have a cogeneration (combined heat and power) plant, its emissions fall in this category. NOTE: Following IPCC protocol, CO2 emissions from biogenic sources are not reported as part of your Scope 1 emissions; they are calculated and reported separately. However, since the same “activity data” that results in biogenic carbon emissions also results in anthropogenic emissions of other greenhouse gases, the activity data for these sources (e.g. biomass burned in a physical plant or boiler) are included as part of your Scope 1 data inputs. For more information, see the “Biogenic Carbon” section.
Collection: Contact the Facilities Director or Energy Manager to find out the types and amounts of fuels used on-campus, excluding vehicle fuel use. If no such person exists, contact the Facilities Office and ask who is in charge of purchasing fuels. This person will probably also be in charge of purchasing electricity. If they have not already compiled the information, someone may need to dig through monthly bills or other statements. First ask if they can compile it, but offer to do it yourself if they feel they don't have the time. If you want it done quicker than they can promise it, you may have to do it yourself.
Units: Gallons, short tons, MMBtu, kWh, or % generation efficiency Entry Sheet: Input
Entry Info: On the Input sheet, enter the amount of each type of on-campus stationary fuel used in the labeled units. Note that there are separate columns for fuels used in cogeneration plants – if your fuel is burned in a cogeneration plant, it will be input somewhere in columns N-AC. All fuels burned in stationary campus applications that are not cogeneration
©2001-2008 Clean Air-Cool Planet, Inc. All Rights Reserved
Clean Cool Planet, Campus Carbon Calculator, and the Clean Cool Planet logo are trademarks of Clean Air-Cool Planet, Inc.
34
plants should be totaled and entered in columns AD-AO. If you have one or more cogeneration plants you will need to find out their total electricity and steam production, as well as the production efficiency of each.10 This allows emissions to be assigned correctly to either steam production or electricity production. If you do not enter these efficiencies, your emissions from cogeneration will not be calculated properly.
b. Direct Transportation Sources: all fuel used in university-owned vehicles Contact: Director of Transportation
Data: Annual fleet vehicle fuel use (gasoline, diesel, biodiesel, etc.)
Definitions and Parameters: This category includes the emissions from any vehicles that are owned by your institution. Most universities keep a fleet of vehicles that are used for everything from moving equipment around campus, collecting solid waste or materials to be recycled, delivering campus mail, or managing the grounds and roads. The university will often have its own fueling station that may be filled by the state (at state universities) or by private arrangement.
Collection: Contact the Director of Transportation to find out who is in charge of managing fleet fuel use.
Units: Gallons, MMBtu, or kWh Entry Sheet: Input
Entry Info: On the Input sheet, enter the amount of each university fleet fuel used in the labeled units. If you want, you can also enter the electricity used by any electric vehicles. Note that emissions from electricity production are already accounted for under Scope 2, purchased electricity (if you purchase electricity from off campus) or Scope 1, on-campus stationary sources (if you generate all your own electricity). Do NOT subtract the values you enter in this column from anywhere else – doing so will result in an under-estimate of your total emissions. c. Refrigerants and Other Chemicals
Contact: Director of Facilities / Plant Maintenance / Air Conditioning Managers Data: Annual Perfluorocarbon (PFC), Hydrofluorocarbon (HFC), and SF6 emissions
Definitions and Parameters: When chlorofluorocarbons (CFCs) were found to be damaging to the ozone layer, alternatives such as hydrofluorocarbons (HFCs) and perfluorocarbons (PFCs) were required. Unfortunately, these chemicals were later discovered to also be strong greenhouse gases. These emissions will be estimated in this section. IPCC and US EPA protocol does not include CFCs in greenhouse gas inventories because they are being phased out under the terms of the Montreal Protocol and US Clean Air Act.11 You do not need to compile CFC release information, but the Campus Carbon Calculator has the capacity to include any other greenhouse gas, so you may want to include any CFC emissions as a sidebar in your report.
Collection: Information regarding the release of HFCs and PFCs should already be reasonably accessible, as universities are required to record all fluorocarbon releases for the EPA. You may need to be assertive, but this information should be available for use. The Energy Manager should know whom to contact for this information –it may be whomever is in charge of
10
If you have multiple cogeneration plants, you’ll need to figure out the combined average steam and electricity production efficiency for all the plants
11
United Nations Environment Program, Handbook for the International Treaties for the Protection of the Ozone Layer, 5th Version 2000, http://194.51.235.137/ozat/protocol/main.html
©2001-2008 Clean Air-Cool Planet, Inc. All Rights Reserved
Clean Cool Planet, Campus Carbon Calculator, and the Clean Cool Planet logo are trademarks of Clean Air-Cool Planet, Inc.
35
environmental compliance at your institution. This number may be estimated by subtracting the amount of recovered refrigerant from the purchased refrigerant.
Units: Pounds Entry Sheet: Input
Entry Info: On the Input sheet, enter the pounds of each chemical emitted. If a gas you need is not listed, select “Other” from the drop-down list, then go to the EF_GWP sheet. Scroll to the bottom, and replace the “Other” at the bottom of the list with your chemical. Enter the chemical’s 100-year global warming potential in the cell to the right, and the source for this number in the cell to the right again.
d. Agriculture Sources
Contact: Barn Managers / Grounds Managers / Agriculture-related departments Data: Annual fertilizer use, type, and nitrogen content. Annual number of animals
Definitions and Parameters: This section includes methane and nitrous oxide emissions from agriculture. Many animals, especially dairy cows, release methane generated by microbes in their guts. Methane is also released from decomposing manure. While this source will likely be only about 1% of total emissions, it is worth noting if your university has animals.
This section also includes fertilizer application on fields and grounds. After the application of any nitrogen-containing fertilizer, some percentage is released as nitrous oxide (N2O).
Collection: To find this information, contact the people that manage the animal barns and agriculture. Look through a campus directory for "dairy barns," "agriculture," or any related department. You will need to collect headcounts of dairy cows, beef cows, pigs, goats, sheep, horses, and poultry that the university has maintained over the years. Herd size usually varies throughout the year and so you will need to develop an average annual herd size. You may need to take the first headcount of the year and average it with the last headcount of the year. Any small variations due to a changing herd size will probably be insignificant.
To estimate emissions from fertilizer use, you will need to know the total pounds of fertilizer (both synthetic and organic) applied and their percent nitrogen content. Synthetic fertilizers are labeled with their chemical makeup using three numbers to represent the percentages of nitrogen (N), phosphorus (P), and potassium (K). So 15-10-10 fertilizer is 15% nitrogen. Nitrogen contents for organic fertilizer are about 1% for manure and 4.1% for other organics.
Units: Pounds, % Nitrogen, or number Entry Sheet: Input
Entry Info: On the Input sheet, enter the pounds of fertilizer used and number of animals. Be sure to include the % nitrogen content of fertilizers.
III.Scope 2 Emissions Sources a. Purchased Electricity
Contact: Energy Manager / Director of Facilities
Data: Annual purchased electricity. Annual electricity production fuel mix (if known)
Definitions and Parameters: Unless you have an electricity fuel production mix that is high in renewables or produce much of your electricity on campus, Scope 2 emissions from purchased electricity are likely to be a significant emissions source. Electricity is used in many ways on the campus: lighting, computers, refrigeration, air conditioning, cooking, and sometimes even cooking.
Collection: This data will hopefully already be compiled, but may require digging through monthly records in the Energy Office. You will need to know how much electricity was
©2001-2008 Clean Air-Cool Planet, Inc. All Rights Reserved
Clean Cool Planet, Campus Carbon Calculator, and the Clean Cool Planet logo are trademarks of Clean Air-Cool Planet, Inc.
36
purchased each year. This information will probably be gathered in kilowatt-hours (kWh) - one kWh is the amount of energy that will power ten 100-watt light bulbs for an hour.
Units: kWh
Entry Sheet: Input, CustFuelMix
Entry Info: On the Input sheet, enter the annual electricity purchased in kWh. Then click the link in the Purchased Electricity column to go to the EF_ElectricMap sheet and select your state and pre- and post-2006 eGRID region. This allows the Campus Carbon Calculator to select the proper emissions factors and fuel mix for your electricity region from the EPA’s eGRID database. If you know the exact fuel mix that your electricity provider uses, check the “Use Custom Fuel Mix” box at the bottom of this sheet. Then click on the link to the right to go to the CustFuelMix sheet and enter the fuel mix of your electricity provider.
NOTE: If you check the “Use Custom Fuel Mix” box but do not fill in the CustFuelMix sheet, your electricity emissions will not be calculated. You should also still set your state and eGRID regions even if you use a custom fuel mix.
b. Purchased Steam / Chilled Water
Contact: Energy Manager / Director of Facilities / Steam or Chilled Water Provider Data: Annual purchased steam and chilled water, production fuel mix, and transport losses Definitions and Parameters: This section will estimate emissions from off-campus steam / chilled water production. If your campus produces its own steam and/or chilled water, the associated emissions will be captured in the “On-Campus Stationary Sources” section (since it will be produced with the other fuels) and should not be included here. Imported steam is a common energy source for urban campuses in cities with centralized steam production.
Collection: This data will hopefully already be compiled, but may require digging through monthly records in the Energy Office. Steam and chilled water use data will be collected in “MMBtus” (million British Thermal Units). Chilled water data may also be recorded in “tons,” which actually refers to the equivalent of the amount of cooling from one ton of ice melting in an hour (This factor is equivalent to 12,000 Btu/hour. Multiply "Tons" by 0.012 to get MMBtu). You will also need to know how the steam/chilled water was produced and the approximate loss of energy in the pipes between the generation facility and the campus. You may need to contact the steam provider to find the types of fuel used to produce the steam each year. The provider's website is a good place to start and you may find it there. This information will be in terms of percent fuel type. (For example, your steam production for the year 2000 could be 11.8% natural gas, 0.6% distillate oil, 25.7% coal and so on). The default fuel mix in the Calculator is 50% natural gas and 50% distillate oil, with 5% transportation loss between the generation facility and campus. This information is needed because the emissions associated with the production of the university's steam will be included in the inventory under Scope 3, transmission losses for steam / chilled water.
Units: MMBtu, % generation fuel use, and % transportation loss Entry Sheet: Input, EF_Steam, EF_Water
Entry Info: On the Input sheet, enter the MMBtu purchased of steam and chilled water. Then click the links in the Steam and Chilled Water columns to set the production fuel mix and transmission loss.
IV.Scope 3 Emissions Sources
a. Commuting: daily commuting by faculty, staff, and students Contact: Director of Transportation / Human Resources / Registrar
©2001-2008 Clean Air-Cool Planet, Inc. All Rights Reserved
Clean Cool Planet, Campus Carbon Calculator, and the Clean Cool Planet logo are trademarks of Clean Air-Cool Planet, Inc.
37
Definitions and Parameters: This category may be one of the most difficult to estimate. The goal is to estimate the number of annual miles traveled by faculty, staff, and student commuters. This estimation should be limited to home to school to home trips. This is included in university emissions because the university could influence this travel by offering alternatives (bus, shuttle, etc.). To estimate this you will need to know how large these communities are, what their "average" commuter habits are (frequency of trips from home to school and back), the distance from home to school, and the number of commuting days.
Collection: The community size can probably be gathered from the Human Resources
(Personnel) Office for employees and the Registrar for students. In addition, these offices may have a list of where these people live, which will assist in determining from where they are commuting. The Transportation Office may have completed a survey to estimate commuter habits in order to better meet commuter's needs with buses or shuttles, and a good deal of information may be able to be deduced from the vehicle parking permit database. If not, you may need to come up with your own estimates to approximate commuter habits. Faculty and staff are calculated separately because most staff will work 40 hours a week on campus while faculty may have more variable hours and habits. You may want to estimate the average fuel economy for faculty, staff, and students if there is a noticeable variation in vehicle preference in your region from the national norm (the default national averages for each year are already entered in the spreadsheets).
Units: % commuting, trips per week, weeks commuting per year, miles per trip Entry Sheet: Input_Commuter
Entry Info: On the Input_Commuter sheet, enter the information on commuting. Note that the columns labeled “% [mode of transit]” refer to the % of the total number of faculty/staff/students that use that mode of transit – so in the “Faculty” section, “% Light Rail” means the % of the number listed in the “Faculty” column that commute via light rail. For students, the Calculator automatically enters the number of full-time students plus half the number of part-time students in the “Students” column – you may adjust this value if you have more accurate data on student commuting habits.
b. Directly Financed Outsourced Travel: travel paid for by the university
Contact: Director of Transportation / University Travel Office / Travel Agent Data: Annual faculty, staff and student miles traveled and mode of transportation
Definitions and Parameters: This category includes any travel that is paid for by the institution but uses vehicles (or aircraft) that are not owned by the institution. The ACUPCC requires signatories to report emissions from directly financed faculty and student air travel, to the extent that data are available. You may also choose to report directly financed travel via train, taxi, bus, ferry, rental car, or travel in personal vehicles that is reimbursed by the university.
Collection: This data should be collected in terms of “(passenger) miles traveled” for students and faculty/staff and may be available through the university Travel Office, the Student Activities Office, or individual departments.
Units: Miles Entry Sheet: Input
Entry Info: On the Input sheet, enter the miles traveled for each category. c. Study Abroad Air Travel
Contact: Study Abroad Office
©2001-2008 Clean Air-Cool Planet, Inc. All Rights Reserved
Clean Cool Planet, Campus Carbon Calculator, and the Clean Cool Planet logo are trademarks of Clean Air-Cool Planet, Inc.
38
Definitions and Parameters: Although student air travel for study abroad programs is rarely directly financed, many universities encourage or even require their students to study abroad and so feel a responsibility to estimate and report the emissions associated with this travel. Collection: This number will almost certainly have to be estimated. The Study Abroad or Registrar’s Office may be of assistance in this process.
Units: Miles Entry Sheet: Input
Entry Info: On the Input sheet, enter the air miles traveled by students studying abroad. d. Solid Waste
Contact: Waste Management Supervisor, Grounds and Roads department, or Director of Facilities.You may need to contact the landfill with questions regarding the type of landfill. The EPA also has information on some landfills, check out: U.S. E.P.A’s Landfill Methane Outreach Program (http://www.epa.gov/lmop/profiles.htm) for more info.
Data: Annual waste production and disposal method (incinerated, landfilled without methane control technology, landfilled with methane flaring, or landfilled with methane recovery) Definitions and Parameters: Institutions have several methods for managing solid waste. The two most common are incineration and landfilling. Waste that is incinerated releases greenhouse gases when combusted and waste sent to landfills releases methane as it decomposes.
Collection: First, contact the person in charge of waste management to inquire about historical data for the amount of solid waste generated that is sent to a landfill or incineration. The institution will likely pay a tipping fee each month and will hopefully have records of the amount of waste disposed.
Second, find out where the waste goes: (1) a mass burn incinerator, (2) a refuse-derived fuel incinerator, (3) a landfill with no methane collection, (4) a landfill that collects methane emissions for flaring, or (5) a landfill that collects methane emissions for electricity generation. You may need to contact the landfill to find this information.
Units: Short tons Entry Sheet: Input
Entry Info: On the Input sheet, enter the short tons of solid waste in each category. The Campus Carbon Calculator uses emission factors for an “average” composition of solid waste. If you have access to specific information regarding the composition of your waste, you can use the EPA’s Waste Reduction Model (WARM) to develop a specific emission factor for your institution.12 Follow this (link)13 and enter your waste mix as percents. Then enter your emission factors on the EF_SolidWaste sheet in the Calculator.
e. Offsets
Contact: Campus Sustainability Coordinator / Energy Manager / Director of Facilities
Data: Annual offsets purchased or created (composting, forest preservation, renewable energy credits, retail offsets, etc.)
Definitions and Parameters:
It is increasingly common for universities to offset some portion of their greenhouse gas emissions in various ways. An offset is achieved when the campus invests in a reduction in GHGs outside of it’s institutional boundaries, such that it exerts some financial control on that
12
Solid Waste Management And Greenhouse Gases: A Life-Cycle Assessment of Emissions and Sinks, 2nd Edition, EPA530-R-02-006, May 2002. http://www.epa.gov/epaoswer/non-hw/muncpl/ghg/greengas.pdf
13