Chalmers University of Technology University of Gothenburg
Department of Computer Science and Engineering
Shorter build-measure-learn cycle in software
development by using natural language to query big
data sets
!
Master of Science Thesis in Software Engineering
The Author grants to Chalmers University of Technology and University of Gothenburg the non-exclusive right to publish the Work electronically and in a non-commercial purpose make it accessible on the Internet.
The Author warrants that he/she is the author to the Work, and warrants that the Work does not contain text, pictures or other material that violates copyright law.
The Author shall, when transferring the rights of the Work to a third party (for example a publisher or a company), acknowledge the third party about this agreement. If the Author has signed a copyright agreement with a third party regarding the Work, the Author warrants hereby that he/she has obtained any necessary permission from this third party to let Chalmers University of Technology and University of Gothenburg store the Work electronically and make it accessible on the Internet.
Shorter build-measure-learn cycle in software development by using natural language to query big data sets!
MARKUS BERGET
© MARKUS BERGET, December 2014. Examiner: MATTHIAS TICHY
Chalmers University of Technology University of Gothenburg
Department of Computer Science and Engineering SE-412 96 Göteborg
Sweden
Telephone + 46 (0)31-772 1000
Department of Computer Science and Engineering
Abstract
Background Big data is used by many companies to gain insights and drive decisions. Data-scientist is a role that is responsible for analyzing and finding trends in data. In software product development these insights can be valuable in order to improve the quality of the software product. Examples of data used can be usage logs, social media data etc. But the gap between the stakeholders in software product development and data-insights makes it difficult for stakeholders in software product development to gain fast insights about data.
Objective This thesis explores what possible factors make it difficult for stakeholders in software product development to gain data-insights in order to improve products. The thesis also explores how stakeholders in software product development can gain big-data insights without the involvement of data-scientists.
Method The research method chosen in this thesis was action research. The re-search contained five iterations with a collaborating company. The iterations conducted were: rule based parsing using a DSL, statistical parsing using machine learning, web-application prototype, survey, and observations.
Results It was concluded from the results of the survey and semi-structured observa-tions that there was a need to improve data-insights for stakeholders in software product development. The main issues found was lack of customizability and flexibility, also the multiple data sources used and difficulties to explore the data. A prototype was presented to address the identified issues. The prototype used natural language and machine learning for querying data. The prototype also supported querying of multiple data sources. From the observations the prototype proved to be a simple way to query the data and allowing for querying multiple data sources in one place.
Conclusion The proposed prototype did not eliminate the need for data-scientists. But the prototype worked as a structured communication channel for data scientists to gauge stakeholders interest in different data queries and adding missing functionality by using a data driven approach.
Acknowledgements
The author would like to thank Dr. Miroslaw Staron at Chalmers University of Tech-nology. His supervision and guidance during this thesis was of great value and helped to raise the quality of the thesis.
Contents
1 Introduction 1
2 Background 3
2.1 Validated learning in new product development . . . 3
2.2 Business Intelligence . . . 4
2.3 Data Mining . . . 5
2.4 Domain Specific Languages . . . 5
2.5 Natural language query parsing . . . 5
3 Related Work 7 4 Method 9 4.1 Action Research . . . 9
4.2 Application of action research . . . 11
5 Iteration 1: Parsing queries 13 5.1 Diagnosing . . . 13
5.2 Planning . . . 13
5.3 Acting . . . 14
5.4 Building a grammar to manage different kinds of queries . . . 14
5.5 Building a simple DSL . . . 15
5.6 Internal tree structure to executable query . . . 15
5.7 Reflecting . . . 16
6 Iteration 2: Statistical Approach 17 6.1 Diagnosing . . . 17 6.2 Planning . . . 17 6.3 Acting . . . 17 6.3.1 Text classification . . . 18 6.3.2 Training model . . . 18 6.3.3 Method identifier . . . 18
6.3.4 Query parsing for advanced queries . . . 19 6.4 Reflecting . . . 21 7 Iteration 3: Prototype 22 7.1 Diagnosing . . . 22 7.2 Planning . . . 22 7.3 Acting . . . 22
7.3.1 Data driven by learning queries . . . 22
7.3.2 Presenting data to user . . . 23
7.4 Reflecting . . . 24 8 Iteration 4: Survey 25 8.1 Diagnosing . . . 25 8.2 Planning . . . 25 8.3 Acting . . . 25 8.4 Reflecting . . . 33
9 Iteration 5: Semi Structured Observations 34 9.1 Diagnosing . . . 34 9.2 Planning . . . 34 9.3 Acting . . . 35 9.3.1 Impressions of prototype . . . 36 9.4 Reflecting . . . 38 10 Threats to validity 39 10.1 External validity . . . 39 10.2 Conclusion validity . . . 39 11 Conclusions 40 Bibliography 45 A Appendix A 46 B Appendix B 49
1
Introduction
Big data is a term that has gained huge interest over the past years[1]. The term big data often refers to a collection of data so huge that it becomes difficult and complex to retrieve information from it[2]. Many companies has realized the value of storing large data sets in order to use statistics and drive decisions. With new ways of managing the data, such as the map reduce programming model[3] allows for companies to draw information from large datasets.
Even though many companies has realized the power of big data, there are a lot of un-knowns concerning big data, and how it can be used in software development. Today specialized roles within companies referred to as data scientists[4] have the competence of extracting information and insights from big data, and presenting it to stakeholders. From a software engineering perspective, big data could be in the form of usage logs con-taining user behavior of a product, e.g. how many times feature X was used in the past month. This information could be valuable in order to gain insight about the usage/per-formance of a software product. Different stakeholders e.g. product owners, software developers, or requirements engineers might want to look at the data in different ways, and having to go through data scientists/developers to get that information will prove as an extra step away from the insights. This has consequences for the agility of a software product development team.
The purpose of the study is to investigate whether the gap between information useful for stakeholders in software engineering and big data insights can be bridged using an-other layer of technology. This thesis will address the following research questions:
How can data insights be available to stakeholders without the involvement of data-scientists?
The above stated question will allow to decrease the round-trip time for requests, being able to have more data on the fly, as well as freeing up data-scientists to focus on more
complex insights.
How can different stakeholders in software product development gain better insights of available data?
The above stated question will enable different stakeholders in software product devel-opment to make more informed decisions in order to improve the product.
How can the query of data become easier for different stakeholders in software product development?
The above stated question will enable less technical stakeholders in software product development such as managers, to also have the ability to explore and gain insights from big data. Which will improve their ability to make informed data-driven decisions.
2
Background
The background covers areas both in organization of businesses around data and techni-cal areas. The sectionsvalidated learning in new product development,Business intelli-gence andData mining focuses on importance of data analytics and different techniques companies use today to make more informed decisions. The following sectionsDomain specific languages and Natural language query parsing introduces technologies that are used in this thesis in order to simplify querying of big data.
2.1
Validated learning in new product development
Ries introduced a concept of validated learning in[5]. This concept puts customer feed-back in a central place when developing new products, or features of existing products. The idea is when a new feature is proposed, a small population of the total customer base is selected and a test is performed on this part. If in fact the new feature is proven to increase any of the key metrics, then the feature can be introduced for the whole population of customers. The key here is that each new feature is treated as an exper-iment, and by using an empirical approach, the value of the feature can be evaluated more systematically.
Ideas
MEASURE
LEARN BUILD
Data Product
Figure 2.1: Showing The build measure learn loop[5]
In this validated learning, companies are focused on minimizing the total time through the loop as seen in figure 2.1. By doing so the company improves its ability to adapt quicker to a changing world, which is necessary in order to be competitive[6]. One aspect to minimize the time in the loop is to decrease the measuring and learning time, which can be achieved with a more efficient way of working with data.
2.2
Business Intelligence
Business intelligence (BI) refers to the activity of finding and analyzing business data, getting insights for decision making[7]. The purpose of BI is to help companies and orga-nizations make better decisions based on internal structured data[8] by providing better insights. Business Intelligence can be apparent in many different areas of a company. The marketing department might use BI[9] to determine which countries or regions to enter. The finance department might use BI[10] to determine how to distribute the cap-ital and which future investments should made.
In 2006 a case study was carried out by Zhang et al. [11] where business intelligence was used to understand customers loyalty and retention. The case study looked at usage logs from customers, and was able to find patterns of usage that the telecom company could use as base for business decisions. An example is the popularity of e-sites according to the usage logs, and that the telecom operator was re-organising the e-site maps in order for the more popular sites to have a shorter route of access.
A problem with the current state of business intelligence is complex tools and processes, making it difficult for users without expertise in data analytics to gain insights. A study done 2012 in Australia concludes that the top two and three critical issues with business intelligence is linked to poor data exploration and training users[12]. BI is closely related
to the area covered in this thesis, however this thesis is focused on data-insights in the context of product development rather than general business insights which BI provides.
2.3
Data Mining
Data mining is the process of structuring and analyzing data[13]. The data mining field is more technical than BI, with a high focus on statistics, and users of data mining tools are often experts such as data-scientists. This in order to find patterns and extract information from the data.
Data mining covers many different fields, everything from military applications to cus-tomer relations management, and has become an important part to drive business decisions[14]. There are tools to perform different kinds of data mining [15], mainly these tools are developed for data-scientists and requires prior knowledge of statistics. Often the process consists of selecting a subset of the total data, preprocess to fit a spec-ified format, and then make analysis using specific data mining tools[16]. Data mining can also be applied on new product development as companies tries to find patterns from existing customers to create more appealing new products [17].
Business intelligence is aimed at the business of the organization, while data mining has focus on the technical aspects using statistics to find patterns and organizing data. Neither is focused on stakeholders in software product development.
2.4
Domain Specific Languages
A DSL is a language focused specifically on a certain domain. This can improve pro-ductivity and ease of use[18]. DSLs can also help to create a common communication platform between developers and domain experts. A domain specific language can be of textual or graphical form. Common domain specific languages in textual form are HTML and markdown. HTML serves the domain of web pages and markdown for visual markup of text. UML is an example of a graphical domain specific language that can be used in software development to visualize e.g. Class diagrams. DSLs can serve a great purpose when trying to bridge the gap between advanced technology and domain experts, as example the DSL NeuroQL was proposed by Tian, Hao et al in 2006[19] aimed at Neuroscientists to better explore the increasing amount of data in the field of neuroscience.
2.5
Natural language query parsing
One of the first natural language query processing attempts were in the LUNAR project[20]. In this project natural language was used to query information about rock samples brought back from the moon. This system used a rule based approach, with a large subset of the English language used as grammar. Another approach is to have a se-mantic grammar defined, which will help define the sese-mantics of a sentence of rules of
meaning[21]. The rule based approach has its limitations, because of the complexity of spoken languages, the parsers often have difficulties providing the correct parsed results. Because of the nature of these handcrafted rules, when scaling, the complexity becomes difficult to handle[22].
An alternative to rule based parsing for extracting meaning of natural language is to use statistics. This statistic approach often uses machine learning techniques, with anno-tated text as training corpus[22]. They can also be combined with linguistic knowledge, either in form of grammar, or directly in the corpus[22]. These systems are generally more scalable due to the avoidance of handcrafted rules, however in order to get accept-able accuracy, a large annotated training corpus is often needed, such as the Treebanks corpora, which has more than 6 million part-of-speech tagged words[23].
There has been some recent research to avoid building these large manually crafted cor-pora. Berant et al. (2013) worked with the large online data source Freebase, to map answer question pairs, and be able to use natural language to query without a large annotated corpora[24]. However this research was limited to freebase, and also the pos-sibility of having a lot of question answer pairs in order to build the machine learning model.
3
Related Work
Eberius et al. proposed a research project in 2012 where they wanted to use natural lan-guage combined with a visual DSL for querying multiple web-services[25]. This project would allow for non-experts to create dashboards with aggregated data, by leveraging natural language and a suggestion system to give suggestions for common queries. The project would have visual aids in forms of sliders and boxes to make it more user friendly to make analysis and inferences of the different data sources.
In 2008, Ding et al. used a DSL for information mashup services[26]. An information mashup is to combine different kinds of information together. Their proposal was to use a DSL to simplify data gathering for information mashups. By using the DSL a user of the system could map different data sources together.
Bentley et al in 2013 worked on a system to give users a better view of their health[27]. By combining different data sources, users could be presented with an easier way to consume the insights of their health based on a number of factors e.g. sleep, number of steps, weight, mood, pain. This work shows how to use complex data and create more value by presenting the data in a more user friendly way using natural language. To simplify for users by leveraging natural language has been used by Belande and Has-sen in 2011[28]. They used natural language to simplify on-the-fly creation of services. In their research they could also infer more knowledge from context, such as location. they were also using different data sources for the mashups. Another project by Tuchinda et al in 2011, proposed a framework for creating web-mashups from different sources in a easier way[29].
The research of information mashups and leveraging natural language relates to this the-sis by using a form of DSL or natural language to improve data querying or aggregation. This in order to simplify for users querying or consuming data. In this thesis the area of interest is software product development, which has a more specific audience than general information aggregation.
Following research is centered around data analytics, and how it can be improved with different approaches. This research is interesting because of the data analytics aspect of this thesis by gaining insight through big data. There has been research on self service for data analytics[30][31]. The self service research revolves around a company and its ability to customize data sources and processing.
There has also been research concerning data analytics as a service[32][33] or publish/-subscribe approaches [34]. This research is focused mainly on the data structuring and improving processing architecture for data analytics.
Neither the self service research or the data analytics as a service are focused on making it easier for end users to gain data insights, which is what is of interest in this thesis. Buse and Zimmermann, 2012 conducted a survey with 110 developers and managers about data analysis needs[35]. One of the conclusions reached was ’Engineers do not necessarily have much expertise in data analysis; thus tools should be easy to use, fast, and produce concise output’. The research also identifies areas for future work. One of which includes a more user-focused way of data gathering, with an approach to start with the needs of users and then collect relevant data to answer those needs, instead of opposite.
Buse and Zimmermans work confirms that there is need for work to make data analytics more user-focused for stakeholders in software development. Which relates to the pur-pose of this thesis to bridge the gap between stakeholders in software development and big-data insights.
4
Method
4.1
Action Research
Action research was chosen as the research strategy. Action research was first created by Lewin in 1944[36]. This method was created to decrease the gap between practitioners and research. Lewin saw that the research was not anchored in practice, and was look-ing for a new way to make better use of science. Lewins research were in the context of social sciences. But action research has been successfully applied in fields of software engineering[37][38].
When Lewin first outline action research, there are not many details or specifics on how to conduct action research. This has lead to many interpretations of action research[39]. Some of the criticism around action research is that it sometimes leads to research with little action, or action with little research, also that the conclusions drawn from ac-tion research are hard to generalize, due to the heavy involvement of practiac-tioners in the studies[39][40]. There has been work in formalizing action research to remove prior criticism[40].
The research questions in this thesis are both technical and organizational. In order to asses and add to the software engineering body of knowledge, participants in software development projects behavior needs to be taken in consideration, as the research ques-tion revolves around improvement for different stakeholders in a software engineering project.
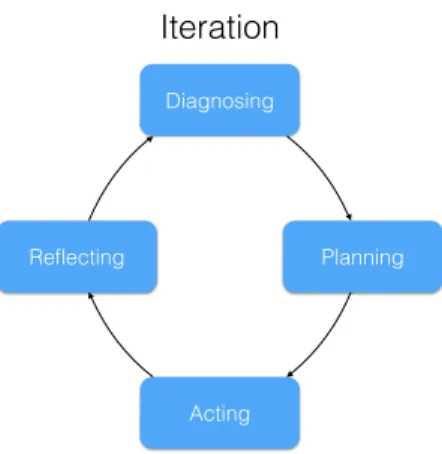
As previously mentioned Lewin created an outline for action research. The outline con-sisted of iterations of the stepsplanning, executing, and fact-finding[36]. The fact-finding step serves four functions: evaluate the action, learning, basis for planning the next it-eration, and basis for modifying the overall plan[36].
In this thesis the actions in each iterations follows the ones layed out in Dickens[39]. This because of the clearer defined steps, which gave more structure in the execution of
each iteration. Dickens[39] proposed four steps in each iteration, diagnosing, planning, acting, reflecting(Outlined in figure 4.1).
Diagnosing
Outlines the problem addressed in current iteration. It also links the problem to the research question.
Planning
A plan is created in order to address the problem outlined in diagnosing. The plan is an overview to reach a conclusion about the problem outlined in the diagnosis phase.
Acting
The plan is carried out and information is gathered during the process. Besides adhering to the plan, the acting phase also tries to identify new possible problem areas which would occur during the iteration.
Reflecting
Information is analyzed and evaluated to see if the iteration solved the problem stated in diagnosing. This is also the basis for a potential upcoming iteration, where possible new areas might have been identified and needs diagnosing. Then a new iteration begins if necessary.
Diagnosing
Planning
Acting Reflecting
Iteration
Figure 4.1: Overview over iterations in action research
4.2
Application of action research
The research was conducted at software company in California, USA1. The company de-signs and manufactures hardware, software and services. The company is market driven and develops products for both personal and business use. The department in which the research was conducted has a mixture of software engineers and less technical roles. All who work together on a daily basis with product development.
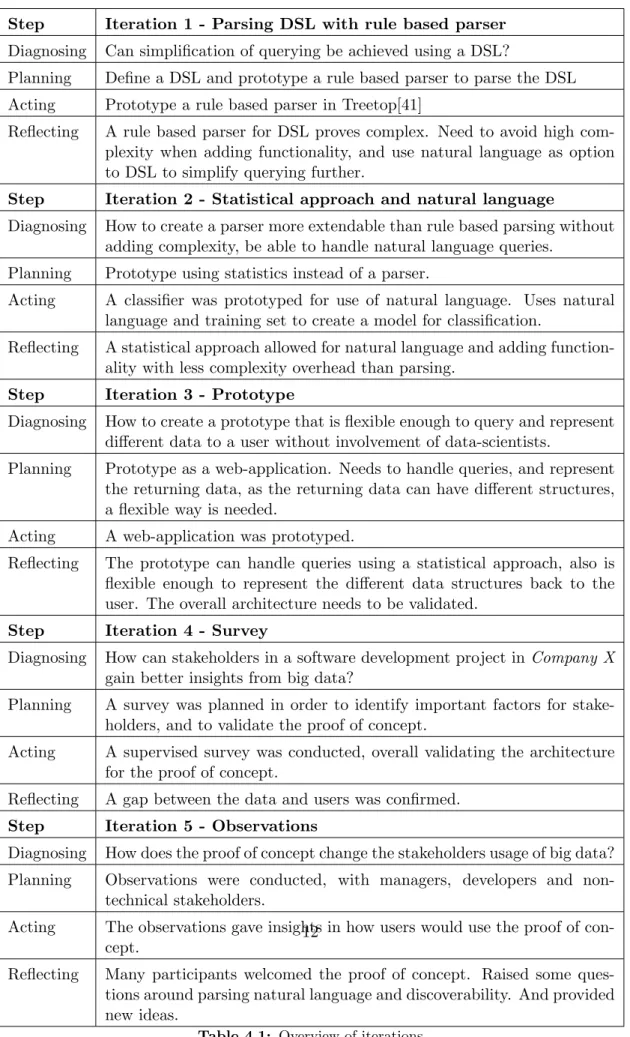
Overall five iterations of action research were conducted. The iterations are outlined in figure 4.1, with a short description of the actions in each iteration. The iterations 1 and 2 addressed how querying big data could be simplified by using different techniques. Iteration 2 and 3 addresses the research question on How can data insights be available to stakeholders without the involvement of data-scientists? In order to identify factors on how different stakeholders in a software development can gain better insight in big data, iterations 4 and 5 were carried out with a survey and observations.
It. 1 - Explore DSL It. 2- Statistical Approach It. 3 - Proof of concept
It. 4 -Survey It. 5 - Observations
Organisational validation Technical development
Time
Figure 4.2: Outline of iterations conducted
As seen in figure 4.2, the iterations are be divided into two groups, and some iterations were performed in parallel. Iteration 1-3 were mainly focused on the technical devel-opment of a prototype. These iterations mainly focused on the technical aspects to simplify querying of data, and remove the involvement of data-scientists. Iteration 4-5 were mainly concerned with identifying different factors important for stakeholders and to validate the prototype. Iteration 3 and 4 was conducted in parallel.
1
Step Iteration 1 - Parsing DSL with rule based parser Diagnosing Can simplification of querying be achieved using a DSL?
Planning Define a DSL and prototype a rule based parser to parse the DSL Acting Prototype a rule based parser in Treetop[41]
Reflecting A rule based parser for DSL proves complex. Need to avoid high com-plexity when adding functionality, and use natural language as option to DSL to simplify querying further.
Step Iteration 2 - Statistical approach and natural language
Diagnosing How to create a parser more extendable than rule based parsing without adding complexity, be able to handle natural language queries.
Planning Prototype using statistics instead of a parser.
Acting A classifier was prototyped for use of natural language. Uses natural language and training set to create a model for classification.
Reflecting A statistical approach allowed for natural language and adding function-ality with less complexity overhead than parsing.
Step Iteration 3 - Prototype
Diagnosing How to create a prototype that is flexible enough to query and represent different data to a user without involvement of data-scientists.
Planning Prototype as a web-application. Needs to handle queries, and represent the returning data, as the returning data can have different structures, a flexible way is needed.
Acting A web-application was prototyped.
Reflecting The prototype can handle queries using a statistical approach, also is flexible enough to represent the different data structures back to the user. The overall architecture needs to be validated.
Step Iteration 4 - Survey
Diagnosing How can stakeholders in a software development project inCompany X
gain better insights from big data?
Planning A survey was planned in order to identify important factors for stake-holders, and to validate the proof of concept.
Acting A supervised survey was conducted, overall validating the architecture for the proof of concept.
Reflecting A gap between the data and users was confirmed. Step Iteration 5 - Observations
Diagnosing How does the proof of concept change the stakeholders usage of big data? Planning Observations were conducted, with managers, developers and
non-technical stakeholders.
Acting The observations gave insights in how users would use the proof of con-cept.
Reflecting Many participants welcomed the proof of concept. Raised some ques-tions around parsing natural language and discoverability. And provided new ideas.
Table 4.1: Overview of iterations
5
Iteration 1: Parsing queries
5.1
Diagnosing
In order to build queries from text, parsing is necessary to extract the meaning of a query to be processed. E.g. The inputted textfeature popularity would perform a query resulting in product features in order of popularity. If our data would reside in a SQL database the example inputted text would equal the pseudo-sql statementselect all from featureLog group by feature order by count descending.
5.2
Planning
A simple rule based parser was explored as option for extracting meaning of a DSL. Treetop[41] is a ruby library developed to help with creation of a DSL parser to un-derstand both the semantics and syntax of inputted text. During the iteration a DSL was prototyped that would be simple to understand by users, and at the same time be powerful for computing data insights. The DSL was never fully defined, but was more simplified natural language.
5.3
Acting
A prototype was created to parse simple expressions. A simple expression could be trend-ing X (With X being the name of a feature). The initial DSL was crude, and resembles more a stripped natural language sentence. During development of the prototype, three challenges were discovered. Firstly how to define a grammar for a simple DSL that untrained users could use. Secondly to be able to build a grammar to perform many different kinds of queries for multiple data sources. And thirdly being able to map the tree structure outputted from Treetop to an executable query.
r u l e e x p r e s s i o n s p a c e ? ’ ( ’ body ’ ) ’ s p a c e ? <E x p r e s s i o n> end r u l e body ( p o p u l a r / s p a c e / f e a t u r e )∗ <Body> end r u l e f e a t u r e ’X ’ / ’Y ’ <F e a t u r e> end r u l e p o p u l a r ’ t r e n d i n g ’ / ’ p o p u l a r ’ / ’ most u s e d ’ <Popular> end r u l e s p a c e [\s ]+ end
Listing 5.1: Structure of grammar in Treetop
5.4
Building a grammar to manage different kinds of queries
Treetop helps with building parsers by using defined rules and semantic grammar. Listing 5.1 is a simple example of a semantic grammar with rules. the ruleexpressionis building on top of the other rules, as seen here rules can be recursive, which is powerful. Within the rule a semantic grammar can be defined. In listing 5.1 the rule popular contains words that all map to the semantic meaning ofpopular.
One of the design goals with the prototype was to be able to extend queries and create new ones fast. This in order to satisfy queries by users that were not anticipated when building the DSL and parser. Since the prototype was developed using a rule based approach for parsing, manual crafting was needed for each addition in the grammar. It was then important to make sure not to brake previous working rules. When adding new functionality to the parser, risk of regression defects in the parser increases. This can be solved with extensive unit-tests, but the existence of unit-tests will not remove the complexity of adding and modifying the grammar.
5.5
Building a simple DSL
One challenge found during this iteration was to build a simple DSL that would require low syntax training. But regardless of how ’easy’ the DSL:s were, there would always be a small amount of training needed to understand the syntax and possible semantic rules for a user to understand how the DSL would be used. At this point it was concluded that a DSL would not fit the requirements of being as simple to use as natural language. So in order to build a query language that would satisfy the goals of requiring minimal syntax training and be easy to use without any prior knowledge, a natural language approach was proposed for upcoming iterations.
5.6
Internal tree structure to executable query
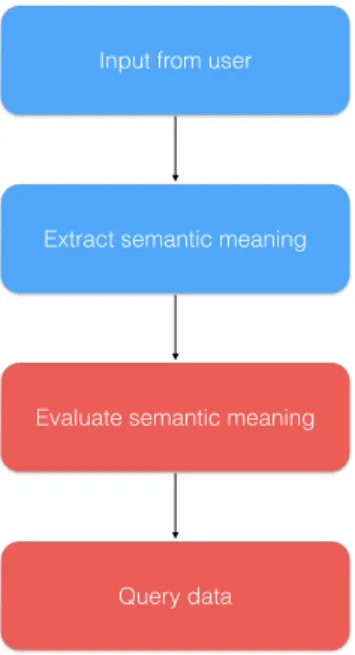
When the parser has processed the written input, it returns a tree structure with nodes of semantic meaning defined by our grammar. Example of a tree structure can be seen in listing 5.2. Here the sentenceTrending X is parsed. The tree contains the nodes which one map to Popular, and another one to Feature, this is mapped from the grammar in listing 5.1. But having a tree structure of semantic meaning is not sufficient, in order to perform a query the tree structure must be evaluated or executed.
E x p r e s s i o n+E x p r e s s i o n 0 o f f s e t =0 , ” t r e n d i n g X” ( body ) : Body o f f s e t =1 , ” t r e n d i n g X” :
P o p u l a r o f f s e t =0 , ” t r e n d i n g ” F e a t u r e o f f s e t =9 , ”X”
Listing 5.2: Tree structure from Treetop
Solutions to the problem of evaluating or executing the resulting tree structure when parsing text were investigated. One approach was to mix executable code within the grammar, so that the tree structure itself was executable, however this would increase the complexity of the grammar, thus make it difficult to extend with new functionality. Another approach was to evaluate the tree structure and then execute a query based on the results of the evaluation, which works when considering to parsing to a query language like SQL. The issue with evaluating the tree is that the parser is not mapping the DSL to a specific query language, but to several data sources, with different query languages. Building an interpreter for all the data sources was considered too complex and time consuming for this thesis. In figure 5.1 the activities needed for a rule based parser are outlined. The red actions represent the problematic actions discussed above with executing the tree structure.
Input from user
Extract semantic meaning
Evaluate semantic meaning
Query data
Figure 5.1: Diagram showing activities necessary for a rule based parser
5.7
Reflecting
In collaboration with the company it was concluded that a rule based parsing solution would not be a sufficient solution for parsing inputted text within the time frame of this thesis. Building a rule based parser would be manageable for basic queries on a specific data source, but as the DSL functionality would grow to manage more complex queries and multiple data sources the rule based parser would be hard to maintain, mainly because of the complexity of an advanced rule based parser. Fast iterations for additions and modifications to the prototype would be increasingly difficult[42]. To construct an easy enough DSL in order to being simple to learn and use was discarded as an option, and it was concluded to use natural language instead of a DSL. A natural language approach would require minimal syntax learning for users.
6
Iteration 2: Statistical Approach
6.1
Diagnosing
From iteration 1 it was clear that an alternative approach to rule based parsing and DSL was needed in order to:
• Be Extendable without drawbacks of added complexity for developer
• Handle natural language queries in order to simplify querying
• Query data from various number of data sources as the collaborating company had multiple data sources
6.2
Planning
As a response to meet the objectives for this iteration, a statistical approach was plored. By using machine learning based on statistics, semantic meaning can be ex-tracted from a natural language input without the need of manually creating rules for parsing. Exploring similar research in fields of natural language query processing, there has been projects where researchers have been able to map natural language to queries on Freebase[24].
6.3
Acting
The problem discovered in iteration 1 with parsing queries was in this iteration ap-proached as a machine learning problem. On a conceptual level, each inputted text needed to be classified into to a class. This class is not a implementation class, but just the class of the classification, e.g. Show me the most popular feature could be mapped into a class calledfeaturepopularity. The class could then be a snippet of executable code.
This executable code could interact with any service, database or other computations that was needed.
6.3.1 Text classification
In order to build a prototype, the mapping between the inputted text and the executable method was approached as a text classification problem. This is a common problem in the machine learning space and can also be referred to as document classification and is used in various applications such as spam filtering or library categorization[43][44]. There are multiple approaches to text classification. In our case a Naive-Bayes approach was selected, mainly because it is an algorithm with good performance in the field of document classification[45]. In general terms a Naive-Bayes classifier is given a train-ing set, which normally is text with a class attached. It then builds probabilities of words(specifically n-grams) occurrences for those classes for all the provided training documents. By doing so the algorithm builds probabilities that for each n-gram that occurs, there is a probability of that n-gram to be of class x. During the classification the algorithm builds all n-grams in a document, and by using the n-grams calculates probabilities for the document to belong to each of the classes. The algorithm then classifies the document to the class with highest probability based on previous n-gram probability calculations.
6.3.2 Training model
As seen in the example of listing 6.1 the training set is a set of pre-defined natural lan-guage queries, that maps to a method identifier. Then the algorithm is bootstrapped with the training set. As a start four queries were mapped to each method identifier. Four queries for each mapping could be seen as a quite low number, as the algorithm arguably just memorizes the mappings. However in this context it was used as boot-strapping, and the training set would grow as users were using the prototype by mapping more queries to the method identifiers.
f e a t u r e p o p u l a r i t y :
− Which i s t h e most p o p u l a r f e a t u r e
− Which f e a t u r e i s t h e most p o p u l a r
− T e l l me which f e a t u r e i s most p o p u l a r
− F e a t u r e s by p o p u l a r i t y
Listing 6.1: Training set example
6.3.3 Method identifier
The method identifier is a unique identifier for a executable method. The classifier will return the method identifier and then using reflection as seen in listing 6.2 to invoke the method associated with the method identifier. This in order to address the previous
issue with rule based parsing to handle the mapping between the user inputted text and the executable method due to the nature of multiple data sources. The invoked method is then responsible for the correct action, it could be a query to a database, other service via REST-API, or other calculations. This approach allowed for multiple data sources to be integrated.
def q u e r y ( s t r i n g )
t a g = @ c l a s s i f i e r . c l a s s i f y ( s t r i n g )
i f q u e r y m e t h o d s . i n c l u d e ? ( t a g )
return tag , s e n d ( tag , s t r i n g )
end end
Listing 6.2: Code snippet showing use of reflection
Input from user
Classify input
Method execution
Query data
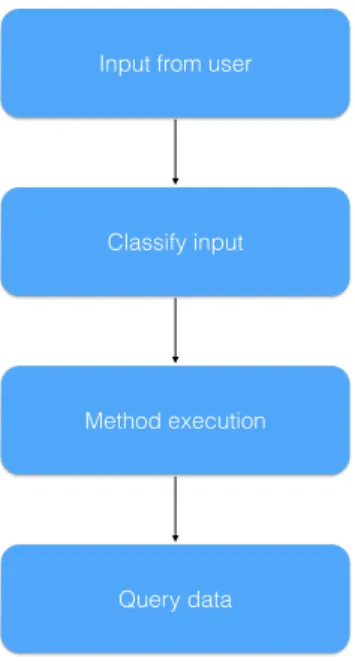
Figure 6.1: Diagram showing activities to parse and execute queries by the statistical approach
In figure 6.1 the activities for parsing and executing queries using a statistical approach are outlined. Here assuming the input results in a query to a data source.
6.3.4 Query parsing for advanced queries
The queries were mapped using a Naive-Bayes classifier that classifies each query to a method identifier. But as more functionality would be added in form of new methods and
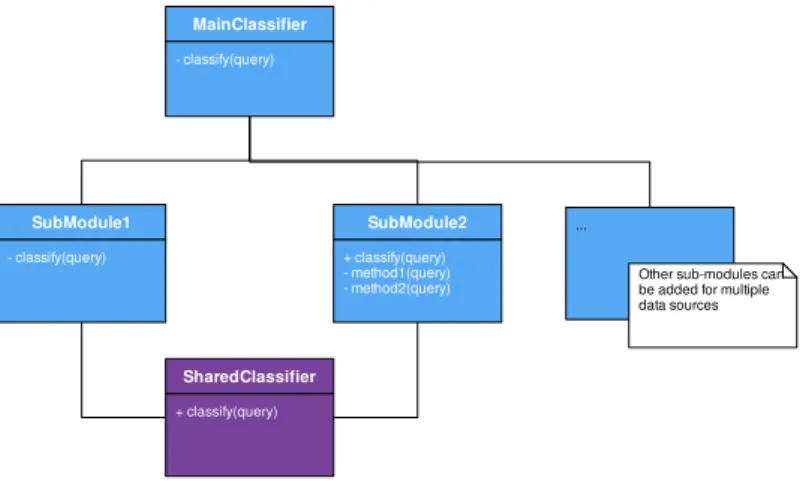
their method identifiers it would make it harder classify. More methods identifiers will make it difficult for the classifier to select the correct class (method identifier). To help the Naive-Bayes classifier the training set needs to increase in order for the algorithm find the distinctive characteristics of the queries for the classes. In order to address this problem of adding more method identifiers, an architecture was introduced where the method identifiers were split into sub-modules, mainly grouped by their data sources. So the main classifier would only classify into the correct module. It then passes the natural language query on to that module. That module then has an additional classifier, that classifies to the correct method identifier as seen in diagram 6.2.
architecture diagram - Class Diagram
SubModule1 - classify(query) SubModule2 + classify(query) - method1(query) - method2(query) MainClassifier - classify(query) SharedClassifier + classify(query) ...
Other sub-modules can be added for multiple data sources
Figure 6.2: Overview of architecture, showing the main classifier, sub-modules for classi-fication and a shared classifier
A shared classifier as seen in diagram 6.2 helped to deal with shared parameter extractions between modules. This in order to remove duplication of code. This shared classifier does not necessary involve a Naive-Bayes classifier, but can be simple regex to look for matches. As the user is using natural language, for some parameters there are multiple ways of expressing the same thing. An example of this could be geolocation, the modules might only support countries as parameters to their methods, but a user might type a continent. Then the country extractor could identify the continent and return the list of countries that then could be used by the modules.
The architecture in diagram 6.2 allowed for additions of new modules. It simplified the main classifier as the number of classes reduces. This allowed for experimentation with other algorithms for classification in the modules, and the modules could possibly have sub-modules with other method identifiers and separate classifiers. This architecture allowed for high cohesion within modules as well as low coupling between modules, which is considered good architecture practice for high modifiability[46].
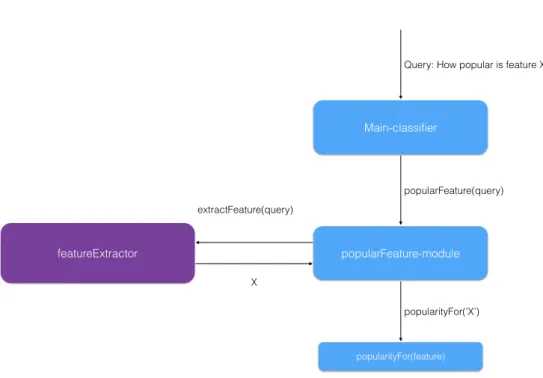
An example in diagram 6.3 shows the activities when text is processed: 20
Main-classifier
Query: How popular is feature X
popularFeature-module popularityFor(feature) featureExtractor popularFeature(query) popularityFor(’X’) X extractFeature(query)
Figure 6.3: Diagram showing overview of a query using sub-modules and shared classifier
1. Main-classifierclassifies the input and calls the sub-classifierpopularFeature-module
2. popularFeature-module is classifying the input as method identifierpopularityFor
3. popularFeature-module is then using the shared-classifier featureExtractor to ex-tract which feature the text contains
4. popularFeature-module is using reflection to call the method popularityFor(’X’), with the extracted feature’X’ as parameter
6.4
Reflecting
By using a statistical approach the objectives listed in diagnosing could be addressed. With the approach proposed in this iteration it was possible to add support for additional queries by adding a module, then adding a training set and re-train the classifier. As queries and data sources would be added, the complexity would not increase dramatically due to the architecture of modules and sub-modules. This approach also allowed for use of natural language based querying, which provided minimal syntax training for users.
7
Iteration 3: Prototype
7.1
Diagnosing
In order to evaluate howHow data insights can be available to stakeholders without the involvement of data-scientists? a prototype was developed to handle queries from users and return presentation of data as response.
7.2
Planning
As prototype the web-application framework Ruby on Rails[47] was used. It was chosen mainly due to the authors prior knowledge in the framework and also because the pro-totyping done in iteration 2 was also developed in Ruby, allowing for integration with the Ruby on Rails framework.
7.3
Acting
A web-application was created using Ruby on Rails as framework. D3.js[48] was used for graphical representation of data. The statistical parser from iteration 2 was integrated to enable users to query production data.
7.3.1 Data driven by learning queries
The prototype persisted all queries made in order to increase the training set for the machine learning model. The prototype also allowed users to flag queries that didn’t yield the correct response back. Persisting the queries allowed for data-scientists to detect and add missing functionality, or to retrain the model using these queries as training set to support the missing queries in the future.
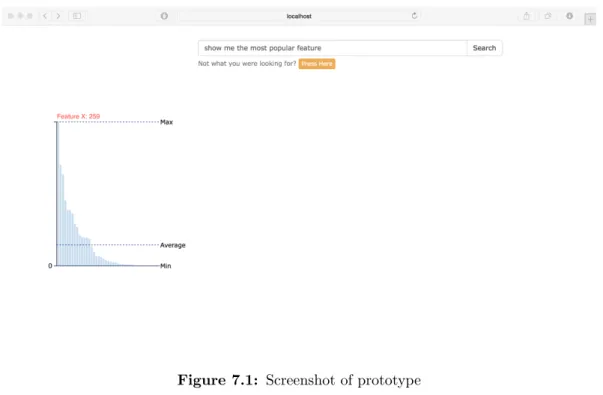
7.3.2 Presenting data to user
Data could be presented to users in form of different graphs and tables. As an example in figure 7.1 the data is represented with a bar chart. The bar chart also has added annotations to show average and max values.
Figure 7.1: Screenshot of prototype
As seen in listing 7.1 meta-data was added to the response data in order for the pre-sentation layer to understand the structure of the data, and present it for the user. The meta-data contains the original query, type, and the data. Thetype denotes the repre-sentation of the data, so that the prerepre-sentation layer knows how to present it. The type
can be of various types e.g. list, line-chart, bar-chart. In the example in listing 7.1 the
type is large-list-combo, which is represented as a graph, along with a list(Note: The list is not visible in figure 7.1).
{
q u e r y : ”show me t h e most p o p u l a r f e a t u r e ” , t y p e : ” l a r g e−l i s t−combo ” ,
d a t a : [{f e a t u r e : ”X” , c o u n t : 2 5 9}, . . . ]
}
7.4
Reflecting
The prototype allowed for the statistical parsing to be tested by participants during the observations. The prototype also allowed for the possibility to flag incorrect responses on queries, allowing for data-scientists to look at missing functionality. The prototype also persisted all queries, allowing for data-scientists to identify popular areas of queries. The prototype allowed users to query data, and the prototype also worked as a communication channel to data-scientists, informing them on popular queries and missing functionality. In the prototype there was unwanted coupling between the data-layer where the parsing and data querying occurred and the presentation layer. This coupling was due to the meta-data type passed from the data layer to the presentation layer, and was done to reduce complexity during prototyping. In future work the data type would be decoupled from the presentation layer, only denoting the structure of the data and not how it should be presented to the user.
8
Iteration 4: Survey
8.1
Diagnosing
In order to understandHow different stakeholders in a development team can gain better insights of available data? a survey was conducted at collaborating company.
8.2
Planning
The survey was designed to understand the usage of data in the development of a specific software product. Questions (appendix A) were focused on the retrieval of data, and how that data is presented to stakeholders. As a sample respondents were semi-randomly selected. The semi-random selection was because of the consideration to include the three different roles in the software product development groups: Engineers, Non-technical (Content creators) and Managers.
8.3
Acting
The survey was handed out to 29 respondents with a response rate of 76%. The survey was often taken with the supervision of the researcher, who answered questions from the respondents. As seen in table 8.1 a majority of the respondents were engineers (14), followed by non-technical (6), andmanagers (2). The complete answers for the survey can be found in appendix B.
A non-parametric Kruskall-Wallis test was conducted to identify significant differences in the responses between the different roles. No test found significance between the roles, meaning that there were no statistical significant difference in responses between the roles in this survey. The sample of the survey (22) is too small to draw any gener-alisations, but a Kruskall-Wallis test would have identified very large differences, which
still makes it interesting as a test regardless the small sample.
Role Frequency Percent Cumulative percent
Engineer 14 63.6 63.6
Non-technical 6 27.3 80.9
Manager 2 9.1 100
Total 22 100.0
Table 8.1: Distribution of respondents from question 1
Q2: I consume the following data in my work
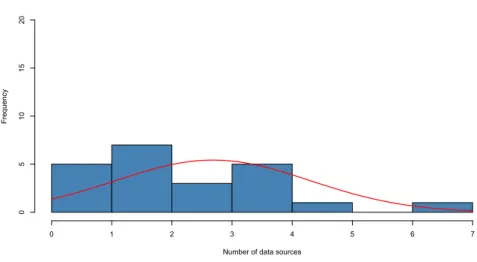
Number of data sources
F re qu en cy 0 1 2 3 4 5 6 7 0 5 10 15 20
Figure 8.1: Histogram over question 2
In question 2 the respondents were asked which data sources they used, since the data sources themselves are confidential, only the number is included in the results. As seen in figure 8.1 with a mode of 2 indicated that the respondents use more than one data source.
Q3: The data available to me is
1 = Not important, 6 = Critical
F re qu en cy 0 1 2 3 4 5 6 0 5 10 15 20
Figure 8.2: Histogram over question 3
Question 2 (figure 8.2) was answered with mode 5 and 6 on the scale from 1-6 on how important the data was for their work, 1 being not important and 6 being critical for work. In the observations it was stated that the data is very important in order to measure the performance of the product.
Q4: How often do you use this data?
1 = Multiple times per day, 2 = Daily, 3 = Weekly, 4 = Less frequent, 5 = Never
F re qu en cy 0 1 2 3 4 5 0 5 10 15 20
Figure 8.3: Histogram over question 4
With a mode of 2 for question 4 (figure 8.3), showing the majority of respondents use the data on a daily basis. This question gives more insight in how often used the data is, and different quality attributes that a possible solution needs to have, e.g. if
data was used less frequent, then performance might have less impact then if used often.
Q5: The data available suits my needs
1 = Strongly disagree, 2 = Disagree, 3 = Somewhat disagree, 4 = Somewhat agree, 5 = Agree, 6 = Strongly agree
F re qu en cy 0 1 2 3 4 5 6 0 5 10 15 20
Figure 8.4: Histogram over question 5
Question 5 (figure 8.4) with a mode of 5 indicated how well data suited the respon-dents need. On the scale of the question a 5 means agree. Along with the observations it gave indications that there was no lack of the data available.
Q6: How comfortable are you with query languages (like SQL, SPL)?
1 = No skills, 6 = Superstar F re qu en cy 0 1 2 3 4 5 6 0 5 10 15 20
Figure 8.5: Histogram over question 6
The respondents responded with a mode of 1 and 4 (figure 8.5) on how comfortable they are with query languages. Allnon-technical respondents answeredno skills. Which
is expected since they are not engineers. When removing non-technical from the group the mode was 4, the results still indicates that respondents are not fully comfortable with SQL query languages.
I consume the data as Frequency Percentage
Graphs and charts 14 63.6
Tables 11 50.0
JSON 9 40.9
Raw text 10 45.5
Rich text 6 27.3
with explanations
Table 8.2: Table showing how respondents consumed data
As seen in table 8.2 graphs and charts is the most common way to consume the data with (63.6%). But the spread is wide, indicating that multiple ways of retrieving the data is demanded by respondents. Along with the observations this is explained by the workflow that engineers have to create custom scripts. These custom scripts are devel-oped ad-hoc to draw data insights not given by existing tools, and so machine readable formats are preferable to use in those scripts.
Q8: I prefer retrieving the data as
1 = Raw data, 6 = Charts and graphs
F re qu en cy 0 1 2 3 4 5 6 0 5 10 15 20
Figure 8.6: Histogram over question 8
Question 8 (figure 8.6) the result was mode 6. This indicates a favor to charts and graphs. However the spread of responses are quite evenly distributed on the range between raw data and charts and graphs, indicating that there is a need for multiple ways of consuming the data. This response aligns with question 7, indicating a need for multiple ways of consuming the data.
Q9: I prefer retrieving the data as
1 = Email reports, 6 = self service
F re qu en cy 0 1 2 3 4 5 6 0 5 10 15 20
Figure 8.7: Histogram over question 9
6 was the mode of question 9 (figure 8.7). Here it was a clear indication that the majority of the respondents prefers tools that enables more self service. During the
observations this was further confirmed when participants in the observations expressed a need to be able to self explore the data.
Q10: I prefer retrieving the data as
1 = Static reports, 6 = Dynamic reports
F re qu en cy 0 1 2 3 4 5 6 0 5 10 15 20
Figure 8.8: Histogram over question 10
A majority is on thedynamic reports side, with an mode of 5. There is however some respondents who prefers static reports.
Question 11: Please evaluate how important the following factors are for you. Survey item 1 2 3 4 5 6 No No Very response importance important Presentation 0 (0.0%) 2 (9.1%) 4 (18.2%) 4 (18.2%) 7 (31.8%) 4 (18.2%) 1 (4.5%) Speed 0 (0.0%) 0 (0.0%) 1 (4.5%) 9 (40.9%) 5 (22.7%) 6 (27.3%) 1 (4.5%) Flexibility 1 (4.5%) 0 (0.0%) 1 (4.5%) 5 (22.7%) 12 (54.5%) 2 (9.1%) 1 (4.5%) Clear and 0 (0.0%) 0 (0.0%) 0 (0.0%) 1 (4.5%) 8 (36.4%) 12 (54.5%) 1 (4.5%) understandable Customizable 0 (0.0%) 1 (4.5%) 3 (13.6%) 3 (13.6%) 11 (50.0%) 3 (13.6%) 1 (4.5%)
Table 8.3: Table showing data factors and their importance
Question 11 (table 8.3) was made to gauge participants value of importance for dif-ferent factors were in regards to data insight. The results indicate an importance of most factors, which then will be used in conjunction with question 12 to detect gaps between importance of factors and how well they are served at the time of the survey.
Question 12: Please evaluate the following factors of the data available to you today
Survey item 1 2 3 4 5 6 No
Poor Excellent response
Presentation 0 (0.0%) 1 (4.5%) 6 (27.3%) 7 (31.8%) 4 (18.2%) 0 (0.0%) 4 (18.2%) Speed 0 (0.0%) 0 (0.0%) 3 (13.6%) 10 (45.5%) 4 (18.2%) 1 (4.5%) 4 (18.2%) Flexibility 1 (4.5%) 2 (9.1%) 6 (27.3%) 5 (22.7%) 4 (18.2%) 0 (0.0%) 4 (18.2%) Clear and 0 (0.0%) 3 (13.6%) 4 (18.2%) 5 (22.7%) 6 (27.3%) 1 (4.5%) 3 (13.6%) understandable Customizable 0 (0.0%) 3 (13.6%) 7 (31.8%) 6 (27.3%) 2 (9.1%) 0 (0.0%) 4 (18.2%) Ease of use 0 (0.0%) 3 (13.6%) 3 (13.6%) 9 (40.9%) 4 (18.2%) 0 (0.0%) 3 (13.6%) Completeness 1 (4.5%) 1 (4.5%) 3 (13.6%) 9 (40.9%) 4 (18.2%) 0 (0.0%) 4 (18.2%) of data Finding 0 (0.0%) 4 (18.2%) 4 (18.2%) 7 (31.8%) 3 (13.6%) 0 (0.0%) 4 (18.2%) data
Table 8.4: Table showing evaluation of data factors at the time of survey
In conjunction with question 11 the gaps identified were inclear and understandable,
flexibility and customizable. In question 12 the participants also indicated with a mode of 4 how complete the data was and with a mode of 4 on well they could find the data.
8.4
Reflecting
Many respondents use several data sources, they express that the data is critical for their work, and they use it on a daily to weekly basis. A majority of the respondents agree that the data available suits their needs. And that the respondents are not fully comfortable with query languages. These factors confirms that the data is valuable, and that respondents are using it frequently but that it might not be fully accessible for data insights.
When looking on how respondents consume the data, the distribution is more wide spread. A part of the respondents prefer the raw data, while other respondents pre-fer charts and graphs. This combined with that many respondents ticked several data sources that they prefer to consumed, indicates that many different formats need to be supported. However, the factor of insufficient data exploration tools could explain that respondents prefer to use the data in raw form, building their own analysis directly on the raw data. But having a better way of querying and exploring data, could remove the need for custom scripts.
Majority of the respondents preferself service, combined with the preference ofdynamic reports. This further aligns with having a more easy way to query the data, and en-abling more of the respondents to analyze and gain insights of the data at their own convenience, versus providing better reports.
The last part of the survey tries to find gaps between what respondents valued in terms of data, and what they currently have today. Biggest gap was between how important it was that the data was clear and understandable, this indicates the complexity of the data, and a need to make it easier to digest.
Other large interesting differences were inflexibilityandcustomizable, where the respon-dents expressed a need for more flexible and customizable ways to explore data. The fact of need of more flexibility and customizability, combined with the average knowledge in query languages indicates that another simpler way of querying could be part of the solution to increase flexibility and customization for users. Another factor that scored low was the finding data, which could also be linked with the number of data sources that respondents use, and that there is a need to improve the way different data sources can be explored.
9
Iteration 5: Semi Structured
Observations
9.1
Diagnosing
To further explore How different stakeholders in a development team can gain better insights of available data? and How the query of data can become easier for different stakeholders? Semi-structured observations was conducted at the collaborating com-pany.
9.2
Planning
Semi structured observations with the duration of approximately 30 minutes were carried out. In total five participants were observed. The sample group was selected randomly with consideration of sampling including engineers, non-technical and managers. This resulted in observations with 3engineers, 1 non-technical and 1manager.
The observations were initiated with a semi-structured interview containing questions on how the participants use different kinds of data sources in their daily work. This in order to set the context of the observation, and to get a deeper insight in how the participants use data. The questions for the semi-structured interview before the observation is outlined below.
1. How does your work link to the information about product usage, or data in general?
2. What things would you be interested in knowing from the data?
3. How important is this data for your work? Is it critical? How do you get this data if you need it?
4. How would you find data about product usage or other data today, what steps do you take?
5. Is there any information you are missing from that source? How would you get that information?
6. How could more data/business intelligence affect the way you work? Or in a different way, like faster analysis, more data, more information from the data, better search?
After these questions the participant was asked to try the prototype. The tasks to perform was a number of queries stated below1.
1. Find the most used feature group by entering ’show me most used feature group’ 2. Find out which feature is the most liked of our users (No query suggestion was
given)
3. Enter any query that you would find interesting
And then following was some discussion questions on how well it performed and impres-sions of how the prototype could change the way the participants used data, and if they could identify potential issues with the prototype.
1. How well does the prototype handle these queries? 2. Positive outcomes or issues with the prototype?
9.3
Acting
All participants agreed that access to data was important in their work and that they use it daily. Data gives information about the quality of the product, and helps identify areas of improvement and further development. Following is a statement about data and its importance:
“Critical in order to know how well we are doing” - Manager
Participants have different tools at their disposal to retrieve data and information. Rang-ing from usRang-ing services that gives the data in its raw form, to email send outs with prede-fined reports. Despite having this range of exploration many participants expressed that it is cumbersome to get to the correct data source. The participants expressed confusion due to many of the tools are focused on specific aspects of the data and it is difficult to correlate findings in one tool to another. Specialized tools have their advantages, such as being useful for looking at specific aspects of the data, or different data sources isolated. But having only specialized tools makes it difficult to link patterns in data between the tools, linking patterns between data can help to give new insights or a more complete
1
analysis of the data. Following are quotes from participants talking about finding the right data:
“The problem today is too many tools, one for looking for A, one for B, C and D. Gives you E, many different pieces, but not a one stop shop for data analytics” - Engineer 1 Note: A, B, C, D, E refers to specifics within the collaborating company and is removed for confidentiality reasons
“Different sources of data have different kinds of data. Have to move between tools to find different aspects of that data. Don’t want to jump between different tools. Want to look at it at different sections, which is useful, but want it at the same place.” - Engineer 2
“We definitely need another entry point to all the data sources” - Engineer 3
At the collaborating company there is no defined process for requesting certain data, or reports of the data. From the interviews the participants use the data sources with the raw data, and then build different ad-hoc scripts to extract insights from that raw data. The ad-hoc developed scripts are then shared in a repository. But for the non-technical personnel they miss the insights that the ad-hoc scripts allows, as they do not have the technical skills to create ad-hoc scripts, or even run existing scripts. Concluded from the observations this leads to missed opportunities of insight:
“We normally create a specific script for that, and then share it with the rest of the team on the repo” - Engineer 2
“I wish I could see X and Y, that would be useful” - Non-technical Note: X and Y are removed for confidentiality reasons
Participants expressed contempt with the amount of data available, and speed of the processing. However the explorability and search they express are lacking. Being able to explore the dataset, combined with a powerful search are expressed as being useful. They do have access to the raw data that they then can perform advanced queries on, but according to participants that is often too complex, and gives too much overhead in terms of post-processing to be useful foron the fly insights:
“I’m missing something that is fast, easy to use, and be able to deep dive to and look at details.” - Non-technical
“Splunk2 is too complex, need a simpler UI for querying” - Manager
9.3.1 Impressions of prototype
After discussing the current workflow and limitations, the prototype was presented and the participants started using it, following the steps outlined in the planning section in this iteration. As the prototype is focused mainly on making it easier to query the data, an initial presentation was given to give context.
2Splunk is a tool for indexing and querying big data[49]
When given the prototype, many participants appreciated using natural language for querying, as there was no need for learning any query language syntax. Drawbacks of using this free form is that participants expressed that it was difficult to know what queries the prototype could handle. The idea with the prototype was to be very data driven and improve as users performed queries that the prototype could not resolve, these would be flagged and then implemented if missed or fixed.
“Was positively surprised when fetching data from sources that I never knew we had” -Manager
One of the insights of the observations was that the participants expressed that it was difficult to get ideas of queries to perform, when asked to just write any query of their interest, if the prototype did not manage to give a correct answer, a doubt was expressed by the users whether the issue was with the prototype or with their query. In many cases the participant tried another way of writing it, implying that the participant could not tell if it was the query that was the issue, or limitations of the prototype. This could potentially be a problem since its the natural language approach makes it difficult for a user to know if the query could be handled or not.
“Powerful with NL(natural language, authors note), but would be good with suggestions” - Engineer 3
Another important point that was raised during the observation was the exploration aspect of the prototype. The first view of the prototype was only a blank input field, with no suggestions or examples of possible queries. Many participants expressed that it would have been easier to explore and be more confident with what queries could be handled if the prototype offered suggestions based on previous inputted text. The participants also expressed that it would help to see what other similar queries were possible, to help them with constructing their own query:
“How do the user know what to ask, not easy to explore” - Engineer 1
“Check boxes, or drop down with other ideas can give you more context, and new ideas” - Engineer 2
The prototype could handle multiple data sources, which was appreciated by the par-ticipants since they voiced a need for a central place of querying multiple data sources, a realization was also made that it would be difficult to provide all the functionality of the specialized tools into the prototype.
With that insight participants expressed that this prototype would be useful for initial queries, and then the prototype would provide hyperlinks to the specialized tools for fur-ther analysis if needed. It would then take a different approach and instead of building a presentation layer with the raw data, the prototype would interact directly with the specialized tools.
This interaction would allow for parts of the response of the query to be displayed di-rectly in the prototype, while other parts of the response could be explored when user
redirects to the specialized tool. E.g. queryShow me the most used features, would only display the top 5 in the prototype, then the user would jump to a specialized tool to explore the data further. As stated by participants:
“I would envision this to be perfect for the one stop shop for all the tools. In order to point the person in the right direction” - Engineer 1
“Snapshot and then link to the source would be useful” - Engineer 2 “Mix of dashboard usage and query on the fly” - Manager
9.4
Reflecting
From the observations it was gathered that all participants expressed the need for a different way of consuming the available data. One issue that was highlighted was the numerous tools available, and the difficulties of linking insights between them, or even finding the correct tool that would satisfy the question posed. The approach for finding data that was not available consisted of engineers developing their own ad-hoc scripts to process and present data. For managers and non-technical participants data insights would be lost due to lack of knowledge of finding/querying/processing the data.
Available tools offers raw data and ways to query it using different query languages, but according to the participants this has high overhead with time and effort. This points to the need of the prototyped developed in this thesis which would make it easier to query big data using natural language.
The participants overall expressed potential of the prototype, positive was the natural language processing and the ability to connect to multiple data sources and query them in one place.
The natural language processing was also one of the factors that was considered negative for some participants. This because of the difficulties for a user to judge if the query is not supported by the prototype e.g. the data is not accessible using the prototype, or if the query could be written in an alternative way to get a result. This can lead to confusion and frustration for a user. Especially when the prototype is developed to handle multiple ways of expressing the same query, the user should not have to adapt the query to fit the prototype. One participant made a comparison with Google, where he experienced that he had to query multiple times to find the correct results.
Providing exploration was another factor that participants expressed the prototype could be improved on since the user interface in the prototype was simple with only a input field, the participants expressed that it was difficult to know what queries are possible. This could hinder exploration since a user have to know exactly what he or she are looking for when performing the query. A solution to this would be to suggest queries when a user starts to type, the prototype could also have the most asked queries displayed at some area, this to give users inspiration.
10
Threats to validity
During this chapter threats to validity are discussed. Since this thesis was conducted in collaboration with one specific company, results cannot be generalized outside that company. The validity factors chosen to be discussed are external validity and conclusion validity. When working closely with the subjects of the research it has risks for biases. During this thesis none of the participants in the survey or observations knew about the research before the survey or observations. This decreased the risk for biases as they were not aware of the research or questions to be answered by the research.
10.1
External validity
Since there was only one collaborating during this thesis it would not be possible to gen-eralise the specific problems that have been identified in this thesis to other companies or areas. The number of data sources consumed played a large part in further development of the prototype, and is identified as one of the main problems. If other companies only use one data source, then the problematics are different.
10.2
Conclusion validity
Since the proposed prototype was in early stage of development when observations oc-cured, conclusions about its scalability are hard to attain. Further development would be needed to ensure that the prototype would be flexible and performant enough for pro-duction use. Also the arguments of moving away from a rule based parser and to using a statistical parser for complexity reasons could need further tests in order to validate this reasoning with further testing of complex queries for both solutions.
11
Conclusions
Stakeholders in software product development need access to data insights in order to decrease the build-measure-learn cycle and improve software products. Enabling stake-holders in software product development to gain these data insights without the involve-ment of data-scientists will allow for quicker insights and more informed decisions by the stakeholders.
How can data insights be available to stakeholders without the involvement of data-scientists?
The prototype proposed in this thesis does not completely remove data-scientist from the process of data insights for different stakeholders. However the data-scientist role becomes more structured and allows the data-scientists to work on continuously improve data insights for stakeholders. Instead of having to handle these queries on a per request basis, they can now focus on improving the prototype. Data-scientists will get insights in what queries are interesting from the different stakeholders, and at the same time improve the tool to serve them without the need for manual work by data-scientists. For stakeholders the prototype proposed in this thesis will allow for querying using natural language. Stakeholders data insight needs will be communicated to the data-scientists through the prototype through logging of queries. As the prototype matures, more queries will be supported allowing for richer insights for stakeholders.
How can different stakeholders in a development team gain better insights of available data? How can the query of data become easier for different stakeholders?
A conclusion drawn with the collaborating company is the need for aggregating multiple sources of data, and provide an easy interface for stakeholders to query and get insights from the data. Query languages can be difficult to learn for all stakeholders in a software development project, hence a natural language query approach was used. Natural lan-guage querying in combination with machine learning to map queries to different data
![Figure 2.1: Showing The build measure learn loop[5]](https://thumb-us.123doks.com/thumbv2/123dok_us/1937017.2785676/10.892.330.557.212.429/figure-showing-the-build-measure-learn-loop.webp)