The Economic Impact of Tourism. An
Input-Output Analysis
Author∗: Camelia SURUGIU
bstract. The paper presents an Input-Output Analysis for Romania, an important source of information for the investigation of the inter-relations existing among different industries. The Input-Output Analysis is used to determine the role and importance of different economic value added, incomes and employment and it analyses the existing connection in an economy. This paper is focused on tourism and the input-output analysis is finished for the Hotels and Restaurants Sector.
Key words: input-output, analysis, tourism, multiplier, Romania JEL Classification: C67, D57, L8
1. Introduction
In our days, tourism is one of the world’s largest growing and dynamic economic sectors in many countries. The important rates of growth and development, the volumes of outflow of foreign exchange, infrastructure development, new management techniques and the training experience are affecting different sectors of the economy, which are positively contributing to the economic and social development of a country.
The tourism industry generates multiple economic benefits to the receiving countries and to the tourism-sending countries. In the developing countries, one of the main reasons to sustain and promote tourism is the expected economic growth. Thus, tourists spent an important amount of money to buy products in a
∗ Camelia SURUGIU, PhD, Junior Researcher, National Institute for Research and
Development in Tourism, e-mail adress: cameliasurugiu@gmail.com.
tourist destination, starting with accommodation, food and beverage, recreational activities and so on, generating a direct effect on business and on the economy measured by incomes that are paying the wages and taxes. At the same time, the tourism businesses have to buy goods and services necessary to satisfy the visitors’ needs, and the direct incomes are used further to make investments and to buy other goods and services. These expenses made by the tourism businesses because of the growing number of visitors generate indirect effects through the creation of jobs and wages for other local business offering goods and services to the tourism businesses.
Thus, the economic impact of tourism represents an important aspect that needs to be taken into consideration in the development and planning of a country, region or community. The communities need to understand the importance of tourism in a region, including tourism contribution to the economic development of an area.
To measure the economic impact of tourism various methods are used, from the simple estimation of its contribution to complex mathematical models. One important tool to estimate the economic effect of tourism in an economy is the Input-Output Analysis.
2. An overview on the Romanian tourism and its impact on
the economy
Romania represented and still represents an attractive tourism destination for domestic and foreign visitors. The natural and cultural tourism resources expressed through the variety of the geographical space combined with valuable art creations, heritage, UNESCO patrimony and a rich balneary-climatic natural potential offer the premises for a sustainable tourism development. If in the 80’s Romania was in the top 15 world tourism destinations, being a receiving country with a market share of 2.5% in 1981, in 2008, according to the United Nations World Tourism Organization (UNWTO), Romania is not even in the first top 50 world countries regarding the tourism expenditure. In the 80’s Romania offered a new, attractive tourism infrastructure having competitive prices, but in the 90’s the situation changed and together with the transition period of the economy, tourism was put in a shade. Although declared “priority field of the national economy” (see Order no. 58/1998 regarding the organisation and development of the tourism activity in Romania), the tourism sector had to deal with various problems like depreciation of the tourism infrastructure, passing in the private property of some tourism units through reversion to their previous owners, poor
image of Romania abroad, economic and political instability, slow and incoherent process of privatization, strong European competition on the tourism market. In 2007, UNWTO data placed Romania on 32th position in Europe regarding the
international tourist arrivals, with a market share of 0.30 %. The international tourism receipts in Romania were around 1,464 million dollars, representing 0.34% of the total tourism receipts in Europe, placing our country on the 29th
position.
According to World Travel & Tourism Council (WTTC) Rapport, The Impact of Travel & Tourism on Jobs and the Economy, Romania’s travel and tourism industry is expected to rise in nominal terms to 3.4 billion dollars or 2.5 % of total GDP by 2016. WTTC estimated that if in the EU, Travel & Tourism is expected to make average annualized gains of 3.5% between 2007 and 2016, for Romania, Travel & Tourism activity is forecasted to grow by 7.9% per annum in real terms between 2007 and 2016.
Various specialists, researchers, planners, developers, international organizations (OECD, UNWTO) consider tourism as an important economic sector, with a strong contribution to GDP, jobs, exports, poverty alleviation and so on.
Tourism, a large, complex and fragmented industry, which is still very difficult to define and measure, is a key component of the service economy. Tourism, which has expanded dramatically over the past 30 years, looks to continue its growing as societies become more mobile and prosperous.
Is the tourism industry an important economic sector for Romania? This is an important question not only for the researchers but also for the government, planners, developers because they should sustain through the right policy the development of this industry. If so, how do we prove the importance of this industry in economic and social terms, especially through GDP and job creation? In their attempt to measure the tourism economic impact, various organizations like UNWTO, WTTC, OECD developed Tourism Satellite Account (TSA) that is an economic tool to measure more accurately the impact of the travel and tourism industries on the economy. Still the TSA is a complex instrument for which it is necessary to provide a variety of statistical data to have a complete image of the total impact of tourism in the economy. Still there are other instruments available to estimate the importance of tourism in the economy and the specialists propose the Input-Output Analysis.
In addition, the Input-Output Analysis is used in this paper to forecast the impact of an initial change in spending in one industry on other industries.
3. Theoretical and methodological consideration regarding
the Input-Output Analysis
The input-output analysis is the standard method for measuring the spread effects of changes in the final demand for the product of an industry or sector. The main applications of input-output analysis have been discussed in Leontief (1984), Miller and Blair (1985), Fleissner (1993), Holub and Schnabl (1994), United Nations (1996), Kurz, Dietzenbacher and Lager (1998), Thijs ten Raa (2006), Eurostat (2008).
The structure of each sectors’ production activity is represented by appropriate structural coefficients that describe in quantitative terms the relationships between the inputs it absorbs and the output it produces. The interdependence among the sectors can be described by a set of linear equations that express the balance between total input and output of each good and service produced (Eurostat, 2008).
The core of input-output analysis is the input-output table. Thus, input-output analysis is concerned with the description and analysis of the production structure of an economy. Production processes in an economy are always interdependent. The products of one process are used in another while the product of that process may be used in many others. In a time of global markets with more competition and interdependent production, deeper division of labour and greater diversity and complexity of products, the exchange of intermediates becomes more important and, consequently, so does input-output analysis (Eurostat, 2008).
The input-output framework of the European System of Accounts (ESA 1995) consists in three types of tables: supply tables, use tables and symmetric input-output tables, which are the basis for input-input-output analysis.
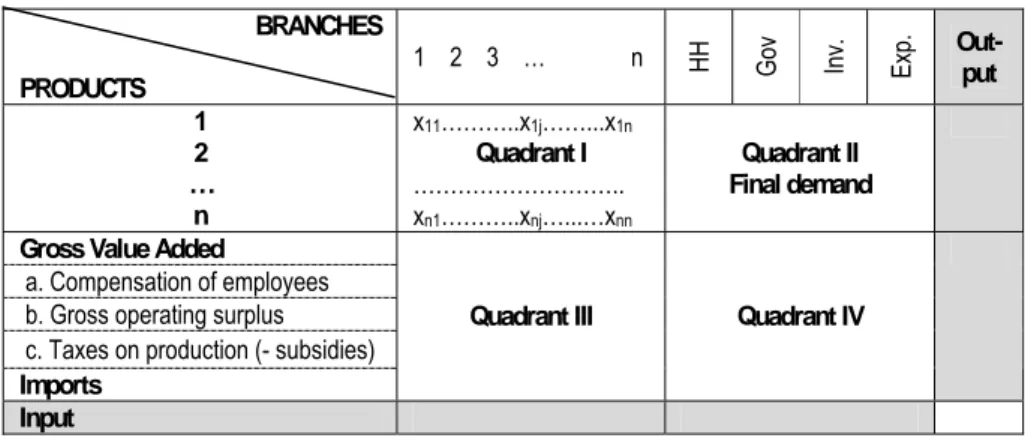
A very general and simplified overview of an I-O table presented in Table 1 comprises four quadrants.
Quadrant I (intermediate consumption) is the basis for the input-output model itself and includes the matrix of intermediate flows. It represents the transactions for intermediate sales and purchases of goods and services among firms. Quadrant II shows the final use of goods and services by households (HH), state and local governments units (Gov), investments (Inv) and exports (Exp).
Quadrant III contains the requirements of each sector for primary inputs (labour, capital, land). It includes the inputs absorbed by the national branches from the
rest of the economic system and outside of the country (imports). Here we include the labour expenses (i.e. compensation of employees), other taxes less subsidies on production, consumption of fixed capital and net operating surplus. These payments are also called value added; since they are so hard to identify individually, these incomes are frequently recorded as one value-added row. In quadrant IV no transactions are denoted, as very few market transactions are reported in this sphere.
Table 1 A general view of an input-output table
BRANCHES PRODUCTS
1 2 3 … n HH Gov Inv. Exp. Out-put
1 2 … n x11………..x1j……...x1n Quadrant I ……….. xn1………..xnj…...…xnn Quadrant II Final demand Gross Value Added
a. Compensation of employees b. Gross operating surplus c. Taxes on production (- subsidies)
Imports
Quadrant III Quadrant IV
Input
The transactions among various sectors and presented in the table above can be described by the following equation:
Xi =
∑
xij+ Yi (1)where: xij is the amount of inputs sector j purchases from the selling sector i, Xj is
the output for the sector j and Yi is the final demand of sector i.
I-O model follows an accounting framework in which the total receipts by sellers must balance the total expenditures by buyers. By that convention, total output is equal to total input for each producing sector in the economy.
I-O tables offer comprehensive and detailed information regarding the sales and purchases of goods and services among various sectors of the economy and it represents an analytical tool for the economists, planners and policy-makers in tourism (Economic and Social Commission for Asia and the Pacific,1990):
− It reveals the interrelations of the tourism sectors with other sectors in the economy;
− It provides a statistically consistent and systematic approach to understand the economic impact of tourism on the whole economy;
− It enables the determination of the relative size of the tourism sector in the overall economy and a comparison of the performance of the tourism industry in relation to the other sectors.
The I-O model also provides critical information for economic and demographic projections as well as for social accounting matrixes (SAM) and computable general equilibrium (CGE) modelling for public policy and alternative economic scenario simulations.
In Romania, the input-output (supply-use) table is performed by the industry of the national economy and balancing the lead at 105 branches of activity, based on the NACE Classification Rev. 1. For our presentation, the I-O table was aggregated in 12 branches (P12) (see Table 2).
Table 2 Branches number and title
A01 Agriculture, hunting, forestry, fishery and pisciculture
A02 Mining and quarrying
A03 Manufacturing
A04 Electric and thermal energy, gas and water
A05 Construction A06 Trade
A07 Hotels and restaurants
A08 Transport, storage and communications
A09 Financial intermediations
A10 Real estate and other services
A11 Public administration and defence, Education, Health and social assistance
A12 Other activities of national economy
The National Institute for Statistics (NIS) in Romania builds up the European System of National and Regional Accounts 95 version (ESA 95), statutory for all Member States of the EU. The main accounting identities pursued by the NIS are:
Production = Intermediate consumption + Gross Value Added (2)
• Identity by products Total Supply = Total Use
At the same time, for each product the following identity is verified:
Production + Imports = Intermediate consumption +
Final demand + Exports + Gross fixed capital formation (3) The Input-Output table represents the starting point in estimating the output, earnings, and employment multipliers and of other multipliers used frequently in analysing the economic impacts. The I-O analysis offer important information regarding the inter-relationships existing among different industries of the national economy, final users (households, visitors, exports, government) and factors of production within an economy.
To be used as a tool for economic impact analysis, the I-O table needs to be transformed into an analytical model.
The first step it takes to build an I-O impact analysis model is to convert the inter-branches transactions into an A matrix showing the direct requirements of a sector in order to produce a unit of its product. Matrix A is called the technical coefficients matrix or direct requirements matrix or I-O coefficients matrix. The technical coefficients are calculated from the values taken from the matrix of transactions divided by total input, respectively
j ij ij X x a = .
Each coefficient aij can be interpreted as the proportion of j total production input
of industry supplied by industry i. These coefficients are artificially fixed for the following steps.
Each column of the direct requirements table represents a production function for the corresponding producing sector. The technical coefficients are non-negative aij ≥ 0 and also
∑
= n j ij a 1 < 1. If∑
= n j ij a 1> 1, it means that value if inputs required are greater than the value of the product produced.
If we assume that xij =aij *Xj, the equation system (1) can be rewritten by replacing xij, resulting that:
∑
∑
∑
= + n i i j ij n i n i ij a X Y x * (4)The equation system (4) shows that the production level for every sector depends on the production level of all the other sectors and the level of final demand. Starting from the equation system (4), an industry total output (X) equals the sum of intermediate demand for its output and the total final demand for its output (Y):
X = A*X + Y (5)
Solving equation (5) for total output X we get:
X = (I-A)-1 * Y, (6)
And thus,
∆ X = (I-A)-1 * ∆Y, (7)
Where I is the identity matrix and matrix (I-A)-1 is the so-called Leontief inverse or
the interdependence coefficients or total requirements table.
The last equation indicates that a change in total output is the product of a change in total final demand multiplied by (I-A)-1. The Leontief matrix is the result
of a matrix transformation through which multiplier coefficients can be calculated. These coefficients summarise all indirect effects.
An additional useful interpretation of the transaction table, as well as the direct and total requirement tables, is the measure of economic linkages within the economy. Highly linked regional economies tend to be more self-sufficient in production and to rely less on outside sources for inputs. The degree of linkage can be obtained by analyzing the values of the off-diagonal elements in the total requirement table. Generally, larger values indicate a tightly linked economy, whereas smaller values indicate a looser or more open economy (Deller, Sumathi, Marcouiller, 1993). The Romanian economy seems to be a more opened one, the coefficients in the off-diagonal being very small.
Multipliers are another mean of estimating the overall change in the economy due to changes in final demand. Among all the information provided by input-output, multipliers are one of the most frequently used.
The Output Multiplier (OM) predicts how much increased economic activity in other industries is caused by every additional RON increase in one specific sector (White, 2002). The sum of each column shows the total increase in
national output resulting from 1 RON increase in final demand for the column heading sector.
The Earnings Multiplier (EM) measures the total change in earning throughout the economy from 1 RON change in final demand for any given sector. EM are obtained using the total requirements table and direct earnings coefficients as:
C = E* (I-A)-1 (8)
where: C is the earnings multiplier matrix, E is n×n matrix containing the ith
sector’s earnings coefficient in its ith diagonal and zeros elsewhere.
The value-added multiplier (VAM) represents a change in total value-added for every RON change in final demand for a given sector. VAM are obtained using the total requirements table and direct VA coefficients as:
T = V * (I-A)-1 (9)
where: T is the VA multiplier matrix, V is n×n matrix containing the ith sector’s VA
coefficient in its ith diagonal and zeros elsewhere.
Communities often wish to know the number of jobs that will be created because of an increased final demand. The employment multiplier (LM) measures the total change in employment due to a one-unit change in the employed labour force of a particular sector. The additional employment in the new activity multiplied by the employment multiplier for the industry provides an estimation of the total new jobs created in the area of study.
The LM is obtained using the total requirement table and direct employment coefficients as:
Z= L * (I-A)-1 (10)
where: Z is the employment multiplier matrix, L is n×n matrix containing the ith
sector’s direct employment coefficient in its ith diagonal and zeros elsewhere.
The I-O analysis offers two distinctive results for each analysed sector, namely backward linkages and forward linkages. First, the backward linkage used to present the internal transactions, showing that the increase in the total production of sector j increases the demand of sector j for inputs from the rest of the economic sectors. Because of their property, backward linkages are also reported in the bibliography as multipliers. I-O tables generate various types of multipliers.
The forward linkage presents the intersectoral transactions, showing that an increase in total production of sector j increases its total supply to the rest of the
economic sectors that are using the product of sector j as an input in their production process (Bonfiglio et al., 2006).
In this paper, we will present the backward linkages or multipliers and forward linkages proposed by Augustinovics (1970) for output, value added, earnings and employment (job) for each sector. Multipliers are derived based on direct and indirect effects arising from an exogenous change in an industry’s final demand.
According to Augustinovics (1970), the forward linkage coefficients reveal the intermediate consumption as a percentage of total sectoral sales including final demand. The forward linkage coefficients (FL) are computed as:
For output,
∑
= = n j ij B OFL 1 (11)where: Bij are the corresponding element of the total requirements matrix.
For earnings,
∑
= = n j ij C EFL 1 , (12)where: Cij are the corresponding element of the earning multiplier matrix.
For employment,
∑
= = n j ij Z LFL 1 , (13)where: Zij are the corresponding element of the employment multiplier matrix.
Forward linkages depict changes in output, employment and income of the whole economy as a consequence of a change in added value within the chosen sector (Golemanova and Kuhar, 2007).
4. The main results for Romanian Hotel and Restaurant
Sector: The Input-Output Analysis
For the case of Romania we considered two years namely 2000 and 2005 for which the I-O analysis was finished and the second part of the paper forecasts will be finished for the year 2010. The latest available I-O table was the symmetric for year 2005, both at Eurostat and the National Institute for Statistics. The table was compiled following the industry-technology assumption, product-by-product, with total flows and valued at basic values in current prices. The I-O
analysis will underline the importance of the hotels and restaurants dominating the tourism sector.
4.1. Technical coefficients
Direct requirements coefficients show the amount of inputs purchased directly to produce one RON89 of output. The hotels and restaurant column of the direct
requirements table shows the input from various producing sector necessary to produce 1 RON of output. In 2000, hotels and restaurants purchased about 0.017 RON from agriculture, hunting, forestry and fishery, about 0.10 RON from manufacturing, 0.046 RON from constructions, 0.0274 RON from transport, storage and communications, 0.027 RON from financial intermediations. At the same time, the analysed sector supplied about 0.008 RON worth of hotels and restaurants commodities to produce every 1 RON of real estate and other services output.
In 2005, the situation changed due to the variations in final demand. The hotel and restaurant sector purchased 0.10 RON from manufacturing, 0.10 RON from constructions, 0.05 RON from agriculture, hunting, forestry and fishery and 0.037 RON from transport, storage and communications. Also, hotel and restaurant sector supplied 0.004 RON to produce 1 RON output for transport, storage and communications and 0.006 RON to produce 1 RON output for public administration and defence, education, health and social assistance, enhancing its contribution to both sectors.
The total requirements table recognizes that an increase in demand for a sector's output has a greater impact on the regional economy than the direct effect (Leatherman, J. C., 1994). This table can be used to compute the total impact that the change in final demand for one sector will have on the entire economy. Each column of the total requirement table indicates the direct and indirect impacts on producing sectors of a 1 RON increase in demand for hotels and restaurants. Indirect purchases necessary to hotels and restaurants, for example, would include food and beverages, as well as the electricity, transportation, financial services, communication. Total requirement table constructed for the year 2000 indicates that each one RON increase in final demand increases total (direct and indirect) hotel and restaurant output by 1.030 units. But, the increase in output for hotel and restaurant also affects the output for other economic sectors and the households in those sectors. An additional 1
RON of hotels and restaurant’ output generate the increase in the output by 0.164 RON in manufacturing, by 0.089 RON in electric and thermal energy, gas and water, by 0.059 RON in transport, storage and communications or by 0.053 RON in trade.
In 2005, for each RON increase in final demand the total output for hotels and restaurants increased by 1.014 units. When one unit of demand arises for hotels and restaurants, total requirement coefficients indicate the "amount of materials directly needed" to make the product is 1.014 RON, but also the compound material amounts needed by multiple industries or the "material needed to produce the raw material”, which is an indirect amount, respectively 0.165 RON from manufacturing (e.g., food and beverages, tobacco, textiles and ready made clothes, leather goods and footwear), 0.138 RON from trade, 0.09 RON from agriculture, hunting, forestry and fishing, 0.067 RON from transport, storage and communications and so on.
4.2. Estimating the multipliers
In the first part of this subchapter the output, earnings, value added and employment multiplier will be analysed for the hotel and restaurant sector. Starting with the output multiplier and retaining the tourism example for the year 2005, the total increase of 1.736 RON in the Romanian economy output resulted from 1 RON increase in final demand for hotels and restaurants. In other words, the 1.736 RON (OM'') is composed of 1.00 RON of direct materials and labour, plus additional 0.736 RON of increased output in other related industries. The OM'' for 2005 is higher than the OM' for 2000, respectively 1.56, but the rank remains the same, placing the hotel and restaurant sector on the 7th position
among twelve sectors (see Table 3).
The sector with the highest potential to generate output impacts (both direct and indirect) in Romania is electric and thermal energy, gas and water for both years, namely 2000 with the multiplier of 1.976 and 2005 with the multiplier of 1.874.
Table 3 Backward linkages (multipliers) for Romania, 2000 and 2005
2000 2005 2000 2005 2000 2005 2000 2005
OM' Rk OM'' Rk EM' Rk EM'' Rk VAM' Rk VAM'' Rk LM' Rk LM'' Rk
A01 1.684 3 1.671 8 0.113 11 0.167 11 0.882 5 0.817 7 0.035 1 0.099 1
A02 1.636 5 1.772 5 0.409 4 0.441 2 0.746 9 0.634 10 0.006 5 0.020 8
2000 2005 2000 2005 2000 2005 2000 2005 A04 1.976 1 1.874 1 0.214 10 0.184 10 0.524 12 0.383 12 0.004 10 0.011 11 A05 1.679 4 1.832 2 0.262 8 0.296 6 0.736 10 0.825 6 0.007 4 0.023 6 A06 1.361 12 1.457 11 0.323 5 0.295 7 0.890 4 0.879 5 0.008 3 0.030 3 A07 1.560 7 1.736 7 0.276 7 0.269 9 0.837 6 0.781 9 0.005 9 0.023 5 A08 1.591 6 1.611 9 0.296 6 0.300 5 0.925 2 0.913 3 0.005 8 0.014 10 A09 1.426 9 1.492 10 0.714 1 0.419 3 0.952 1 0.989 1 0.006 6 0.015 9 A10 1.472 8 1.757 6 0.094 12 0.141 12 0.895 3 0.967 2 0.003 11 0.007 12 A11 1.394 10 1.338 12 0.591 2 0.466 1 0.800 7 0.893 4 0.011 2 0.034 2 A12 1.394 11 1.784 3 0.591 3 0.346 4 0.800 8 0.803 8 0.002 12 0.027 4
Note: Rk – Rank, OM' – Output Multiplier for 2000, OM''– Output Multiplier for 2005, EM' – Earnings Multiplier for 2000, EM'' – Earnings Multiplier for 2005, VAM' – Value Added Multiplier for 2000, VAM''– Value Added Multiplier for 2005, LM' – Employment Multiplier for 2000, LM'' - Employment Multiplier for 2005.
Source: Own calculation based on Eurostat data.
In 2005, EM'' for hotels and restaurants underlines that 1 RON increase in the final demand of this sector would increase the earnings in the economy by 0.269 RON. This amount is paid for wages to people directly and indirectly involved in the creation of each additional RON of output. Higher EM was registered in 2000 when 0.276 RON was paid in wages due to 1 RON increase in final demand for hotels and restaurants.
For the year 2005, EM'' registered in “public administration and defence, education, health and social assistance” (0.466) was much higher than in tourism. In 2000, the first position was occupied by financial intermediations having an EM' of 0.714, hotels and restaurants occupying the 7th position, a
better one than in 2005.
The value added multiplier provides an estimation of the additional value added to the product due to this economic activity. For hotels and restaurants the VAM'' is 0.781, higher than in mining and quarrying (0.634), manufacturing (0.628), electric and thermal energy, gas and water (0.383). In 2000 VAM for hotels and restaurants was 0.837, the sector being rank the 6th after agriculture (0.882).
In 2000 all the economic sectors had a lowest potential to increase employment in Romania compared with 2005. Regarding the hotels and restaurants, if in 2000 the rank of the sector was 9th, in 2005 the sector increased its potential
being the in 5th. For the year 2005, the increase of 1 thousand of final demand
for hotel and restaurant products could mean a 0.023 increase in the demand for employees.
Similarly the forward and backward linkages for the output, earnings and employment were estimated for both years, 2000 and 2005, respectively. For 2005, the results presented in Table 4 imply that high dependence in other sectors in terms of output is characteristic for manufacturing (2.562), electric and thermal energy, gas and water (2.004), transport, storage and communications (1.888). The lowest interdependence is for hotels and restaurants (1.077), constructions (1.267) and financial intermediations (1.291). Concerning the hotels and restaurants, although its interdependence decreased from 1.91 in 2000 to 1.077 in 2005, it is on the last position.
Table 4 Forward linkages for Romania, 2000 and 2005
2000 2005 2000 2005 2000 2005
OFL' Rank OFL'' Rank EFL' Rank EFL'' Rank LFL' Rank LFL'' Rank
A01 1.732 4 1.703 7 0.164 11 0.193 11 0.030 1 0.086 1 A02 1.491 5 1.481 8 0.333 7 0.327 6 0.005 7 0.016 9 A03 2.950 1 2.562 1 0.559 1 0.438 2 0.013 2 0.036 2 A04 2.172 2 2.004 2 0.314 8 0.267 8 0.006 6 0.018 7 A05 1.176 9 1.267 11 0.188 10 0.208 10 0.005 9 0.016 8 A06 1.453 6 1.819 4 0.339 6 0.352 3 0.008 3 0.035 3 A07 1.091 11 1.077 12 0.198 9 0.171 12 0.003 11 0.014 10 A08 2.058 3 1.888 3 0.416 5 0.346 4 0.007 5 0.020 5 A09 1.167 10 1.291 10 0.539 2 0.338 5 0.005 8 0.014 11 A10 1.353 7 1.795 6 0.131 12 0.210 9 0.003 10 0.013 12 A11 1.000 12 1.810 5 0.424 4 0.481 1 0.008 4 0.034 4 A12 1.320 8 1.402 9 0.512 3 0.271 7 0.003 12 0.021 6
Note: OFL' – Output Forward Linkage for 2000, OFL''– Output Forward Linkage for 2005, EFL' – Earnings Forward Linkage for 2000, EFL'' – Earnings Forward Linkage for 2005, LFL' – Employment Forward Linkage for 2000, LFL'' - Employment Forward Linkage for 2005.
Source: Own calculation based on Eurostat data.
The computed Augustinovics (1970) earnings forward linkage coefficients indicate that the importance of hotels and restaurants’ sector is low 0.198 in 2000 and very low (0.171) in 2005. The highest forward earnings potential suggested by the values of the linkage coefficients are in public administration and defence, education, health and social assistance (0.481) and manufacturing (0.438).
The forward linkage coefficient with respect to employment shows 0.014 changes in employment in the economy due to a unit change in the final payments of hotels and restaurants. Agriculture, hunting, forestry and fishing
(0.086), manufacturing (0.036) and trade (0.035) exhibit the highest employment forward linkage coefficient values.
The multipliers underline the level of interdependency between various sectors of the economy and as a result, they are varying from one region to other and from one country to another. Their determination is extremely important especially because they underline the importance of one sector at the national level.
5. Hypotheses on tourism dynamics: final assumptions
An increase in demand for a certain product generates a long chain of interaction in the production processes since each of the products used as inputs needs to be produced, and will, in turn, require various inputs. One cycle of input requires another cycle of inputs, which in turn requires another cycle.Given a postulated set of final demands, it is possible through the inverse matrix to estimate what output levels would be required to meet the specified demand. Starting from the equation: X = (I-A)-1*Y, where Y is the demand, X consumption,
and A is the technical coefficient matrix, we estimate the effects of an increasing demand for hotels and restaurants on the consumption of various other sectors. This model is used to study the impact of exogenous changes of final demand on the economy.
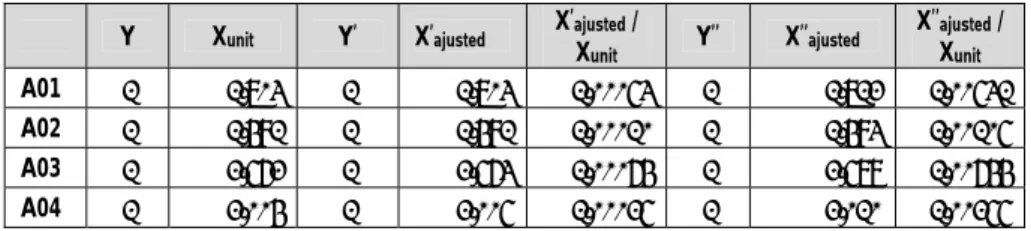
Assuming that the Y matrix is the unit row vector, the matrix X was determined, knowing the Leontief matrix (I-A)-1. Then we considered a change of 1% and
10% of the final demand in hotels and restaurants and their effects on the intermediate consumption matrix.
An increase of 1% in demand for hotels and restaurants leads to an increase of 0.94% in output of this sector and in very small increases in all other economic sectors. The biggest effect is in trade where production grows by only 0.076%, and in manufacturing, the production increases by 0.064% (see Table 5).
Table 5 Variation of the final demand 2005 due to 1% and 10%
change in hotel and restaurant sector final demand
Y Xunit Y’ X’ajusted X’ajustedX / unit Y ’’ X’’ajusted X’’ajusted / Xunit A01 1 1.703 1 1.703 1.00053 1 1.712 1.00531 A02 1 1.481 1 1.481 1.00010 1 1.483 1.00105 A03 1 2.562 1 2.563 1.00064 1 2.578 1.00644 A04 1 2.004 1 2.005 1.00025 1 2.010 1.00255
Y Xunit Y’ X’ajusted X’ajustedX / unit Y ’’ X’’ajusted X’’ajusted / Xunit A05 1 1.267 1 1.267 1.00031 1 1.271 1.00314 A06 1 1.819 1 1.820 1.00076 1 1.832 1.00756 A07 1 1.077 1 1.087 1.00942 1 1.179 1.09423 A08 1 1.888 1.01 1.889 1.00036 1.1 1.895 1.00357 A09 1 1.291 1 1.291 1.00023 1 1.294 1.00228 A10 1 1.795 1 1.795 1.00024 1 1.799 1.00243 A11 1 1.810 1 1.810 1.00024 1 1.814 1.00245 A12 1 1.402 1 1.402 1.00026 1 1.405 1.00265 Source: Own calculation.
A 10% increase in demand for hotels and restaurants leads to an increase in output in the sector by 9.4%, but the growth for other sectors barely exceeds 0.756% in the trade sector and 0.644% in the manufacturing sector. It was expected that an increasing demand for hotels and restaurants at least to accelerate transport, financial services, communication. The impact is however very low, since an increase of 10% in demand for hotels and restaurants only leads to an increase of 0.531% in agriculture, hunting, forestry and fishing, 0.357% growth in transport, storage and communications, 0.314% in construction, 0.243% real estate and other services, 0.228% in financial intermediations.
The statistical numbers obtained in the previous table indicate a relative weak connection between hotels and restaurants and other sectors and a poor development of the service sector. The first explanation is the relative low number of foreign tourists at national level, the percentage of foreigners arrived in tourism establishments being around 20-22%. The foreign tourists should stimulate the connected tourism industries like transport, communication because their tourism demand and as a result their expanses are higher at destination.
The impact on transport is relatively low because the Romanian tourists use especially their own cars and there are not toll highways for transport means. The tolls for transport can generate an increase in transport incomes due to intensive tourism. The impact on financial intermediations is higher than in previous years due to service diversification in this sector but they remain very low. The impact is higher for the communication services because more and more tourism units use internet, mobile network and so on. Still there is an
important number of two and three stars hotels especially in mountain areas and at the seaside not provided with Internet facilities.
The relationship between tourism and other sectors of the economy is rather reverse. Romania needs to improve the infrastructure, local products and the related services to help the development of tourism sectors and to multiply the impact resulting from increasing demand for hotels and restaurants.
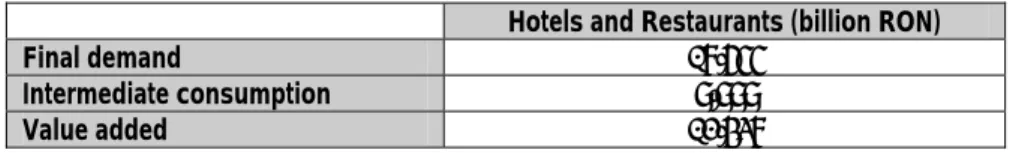
The input-output methodology provides useful and credible forecasts. Using the static national I-O model for the year 2005 to forecast the final demand, value added and intermediate consumption in hotels and restaurants for the year 2010. The static I-O model is a useful tool in understanding the interactions between the many industries of an economy.
The data provided by the Romanian National Forecast Commission (2009) indicate that the Romanian production will reach 1253.6 billion RON. The value of the production in current prices for industry will be 414 billion RON, for agriculture, hunting, forestry and fishing of 83.4 billion RON, for construction of 162.9 billion RON and for total services of 593.3 billion RON at an average exchange rate of 4.09 RON per 1 EUR.
Table 6 Forecasts on the main macroeconomic indicators for 2010
Hotels and Restaurants (billion RON)
Final demand 18.655
Intermediate consumption 9.999
Value added 12.438
Source: Own calculation.
Using the static I-O model for last available data in 2005 to forecast the final demand in hotels and restaurants in resulted that in 2010 the macroeconomic indicator will reach 18.655 billion RON. Also, the estimations indicate an intermediate consumption of 9.999 billion RON and a value added of 12.438 billion RON.
6. Conclusions
In the modern world, tourism is one of the largest and dynamically developing sectors of the economy. Its high growth development rates, considerable volumes of foreign currency inflows actively affect various sectors of the
economy, which positively contributes to the development of the tourism industry.
Input-Output Analysis is an economic tool used to measure the impact of an existing, proposed or anticipated business operation, decision or event on the economy. I-O analysis was used to measure the impact of hotels and restaurants for two different years, 2000 and 2005respectively, the latest available I-O table year for the Romanian economy. The multipliers, estimated on the basis of the I-O analysis, are defined as the system of economic transactions that follow a disturbance in an economy. The multipliers can be used to identify the degree of structural interdependence between each sector and the rest of the economy. Thus, the output, value added, earnings and employment multipliers also known as backward linkage coefficient were estimated. Similarly, the Augustinovics (1970) forward linkage coefficients for output, earnings and employment were estimated.
The output multiplier for hotels and restaurants in 2000 measured 1.56 units, indicatingthe sum of direct and indirect requirements from all sectors needed to deliver one additional RON unit of output of the sector to the final demand. In 2005, an increase of 1 RON in the demand for hotels and restaurants resulted in a change in the economy’s total output of 1.736 RON and an increase of earnings in the economy by 0.269 RON. The output (1.736/1.560) and employment (0.023/0.005) multipliers in hotels and restaurants reached a higher value, but those regarding the value added (0.781/0.837) and earnings (0.269/0.276) were smaller in 2005 compared with 2000.
As it regards the employment multiplier for hotels and restaurants, if in 2000 the rank of the sector was 9, in 2005 the sector increased its potential, being placed the 5th. For the year 2005, the increase of 1 thousand of final demand for
hotels and restaurants products means 0.023 increase in the demand for employees.
Forward linkage coefficients offer more information on intersectoral transactions. The results indicate that hotels and restaurants have one of the lowest interdependence in the economy, the OFL being 1.077 in 2005 in decrease compared with 2000 when it reached 1.91. The computed earnings forward linkage coefficients indicate that the importance of hotels and restaurants sector is low 0.198 in 2000 and very low (0.171) in 2005. The LFL'' shows a 0.014 change in employment in the economy due to a unit change in the final payments of hotels and restaurants. These multipliers are extremely useful for an
economy and for example in preliminary policy analysis to estimate the economic impact of alternative policies or changes in the local economy.
Using the static I-O model for 2005 the final demand, intermediate consumption and value added for hotels and restaurants were forecasted ou the horizon of the year 2010. The forecasts of the macroeconomic indicators in hotels and restaurants show that the final demand will reach 18.655 billion RON, intermediate consumption 9.999 billion RON and value added 12.438 billion RON.
Beside tourism's direct contribution to GDP, the tourism industry also makes an indirect contribution through the flow-on effect that changes in its output have on other industries' output and hence output in general. In the Romanian case, in 2005 an increase by 1% of the demand for tourism generates only and increases of 0.942% of the final demand. In other functioning market economies the effect can be higher even double, but a strong tourism industry with transport infrastructure and diversified services is necessary.
References
[1] Augustinovics, M. (1970), “Methods of International and Intertemporal Measures of Structures”, in: A.P. Carter and A. Brody (eds) Contributions to Input-Output Analysis
(Amsterdam, North Holland).
[2] Bonfiglio, A., Esposti, R., Sotte, F. (2006), Rural Balkans and EU Integration. An Input-Output Approach, Milano, Italy, Franco Angely s.r.l.
[3] Deller, S., Sumathi, N. R., Marcouiller, D. (1993), Regional Economic Models for the State of Wisconsin: An Application of the Micro-IMPLAN Modeling System, Center for Community Economic Development, Department of Agricultural Economics, University of Wisconsin-Madison/Extension, http://www.aae.wisc.edu/cced/936.pdf
[4] Golemanova, A., Kuhar, A. (2007), Input-Output Model for the South-East Region in Bulgaria, http://www.daes.si/Konf07/Golemanova%20Kuhar%20DAES.pdf.
[5] Michael, L., Fichtner, A. R., Heldrich, J., Bloustein, E. J. (2008), Economic Impacts of Planned School Construction Projects in New Jersey, Center for Urban Policy Research, Center for Workforce Development, School of Planning and Public Policy, http://www.heldrich. rutgers.edu.
[6] Leatherman, J. C. (1994), Input-Output Analysis of the Kickapoo River Valley, Center for Community Economic Development, Department of Agricultural Economics, University of Wisconsin-Madison/Extension, www.aae.wisc.edu/cced/942.pdf.
[7] Leontief, W. (1970), Analiza input-output. Teoria interdependenţei ramurilor, Editura Ştiinţifică, Bucureşti, 1970.
[8] Mirbabayev, B., Shagazatova, M. (2006), The Economic and Social Impact of Tourism, http://www.grips.ac.jp/alumni/UzbekistanTourism(2).pdf.
[9] Shaffer, R., Deller, S., Marcouiller (2004), Community Economics. Linking Theory and Practice, 2nd Edition, Blackwell Publishing.
[10] Stynes, D. J. (1997), Economic Impacts of Tourism, Michigan State University, https://www.msu.edu/course/prr/840/econimpact/pdf/ecimpvol1.pdf.
[11] Stynes, D. J. (1999), Approaches to Estimating the Economic Impacts of Tourism: Some Examples, Michigan State University.
[12] Voinea, L. (2005), Turismul în România: Reducerea potenţialului. Există o cauză fiscală pentru această situaţie?, Grupul de Economie Aplicată.
[13] White, D. (2002), The Impact of Real Estate on the Florida Economy: Update for 2002, Shimberg Center for Affordable Housing, M. E. Rinker, Sr. School of Building Construction, College of Design, Construction and Planning, University of Florida, available on-line http://flhousingdata.shimberg.ufl.edu/docs/impactoffloridarealestate2002.pdf.
[14] Economic and Social Commission for Asia and the Pacific (1990), Guidelines on Input-Output Analysis of Tourism, United Nations, Bangkok.
[15] Eurostat (2008), Eurostat Manual of Supply, Use and Input-Output Tables, Collection: Methodologies and Working Papers, Luxembourg.
[16] National Institute for Statistics, Conturi Naţionale 2004-2005.
[17] Department of Business, Economic Development & Tourism (2006), The 2002 State Input-Output Study for Hawaii, State of Hawaii, Honolulu.
[18] Romanian National Forecast Commission (2009), Proiecţia principalilor indicatori macroeconomici pentru perioda 2008-2013, www.cnp.ro.
[19] University of Washington, Office of Financial Management (2006), The 2002 Washington Input-Output Model, http://www.ofm.wa.gov/economy/io/2002/default.asp.
[20] University of Florida Levin College of Law, The Center for Governmental Responsibility (2006), The Economic Impacts of Historic Preservation.
[21] U.S. Department of Commerce, Economics and Statistics Administration, Bureau of Economic Analysis (1997), Regional Multipliers. A User Handbook for the Regional Input-Output Modeling System (RIMS II), Third Edition, http://www.bea.gov.
[22] World Travel & Tourism Council (2006), The Impact of Travel & Tourism on Jobs and the Economy, United Kingdom.
[23] World Tourism Organization (2008), “Commited to Tourism, Travel and the Millennium Development Goals”, UNWTO World Tourism Barometer, Volume 6, No. 3.