On the combination of PsInsar and GNSS techniques for long-term bridge monitoring
A. Nahli 1,2*, E. Simonetto 1, M. Tatin 2, S. Durand 1, L. Morel 1, V. Lamour21GeF, CNAM-ESGT, 1 Bd Pythagore, 72000 Le Mans, France - (elisabeth.simonetto, stephane.durand, laurent.morel)@lecnam.net 2Cementys, 9 Rue Léon Blum, 91120 Palaiseau, France - (abdeljalilnahli, maximetatin, vincentlamour)@cementys.com
Commission III, WG III/3 KEY WORDS: PsInsar, GNSS, Bridge, Monitoring, Long-term, Deflection. ABSTRACT:
Satellite based monitoring techniques are nowadays an emerging tool for structural health monitoring. In this work, we are interested in the study of the deformations of a cable-stayed bridge using both PsInSAR and GNSS techniques. The content of this paper is mainly dedicated to the development and optimization of GNSS and PsInSAR equipments installed on the bridge. We also present the data processing tools with the aim of providing accurate and reliable measurements that will be used to understand the structure behaviour in medium and long terms. We are dealing also with the uncertainty of PsInSAR measurements points localisation to determine accurately where structural motions occur. Results from GNSS show that the bridge undergoes reversible daily and seasonal displacements in the order of few centimetres. PsInSAR results still not completely clear but reveal some limitations related to PS detection on such structures. Future works need to be made on PS detection improvement to exploit GNSS and PsInSAR conjointly for bridge monitoring.
1. INTRODUCTION
Bridges like any other man-made structures are built with an expected lifetime. However, with the increase in traffic loads, possible environment changes or natural and man-made hazards, life span will sometimes change (Roberts et al., 2020). Such bridges are experiencing inevitable ageing and damages leading to their sudden failure causing serious human casualties and property loss (Qin et al., 2017). How to insure continuous and safe operation of these bridges is a challenge that have an increasing interest. In this perspective, Structural Health Monitoring (SHM) was introduced to asset bridges durability and safety thought detecting and surveying changes in the structural behaviour and damage progress.
Bridges SHM core of includes two major types of parameters: load effects (temperature, traffic, wind…) and their structural responses (displacements, strain, vibration…). Among the structural responses, displacements are a key parameter when assessing the safety of bridges (TingHua et .al, 2010). Different techniques are usually operated in SHM systems including geotechnical sensor (strains, displacement sensors, tilt sensor …) and geodesic techniques (RTS, GNSS, PsInSAR…).
GNSS and InSAR are two different spatial techniques that provide an accurate monitoring with a reduced time consumption and cost effectiveness. GNSS technique can be a fully automated process for 3D monitoring with high temporal frequency and millimetre accuracy on a limited, but accurately defined, number of points. Besides, Ps-InSAR technique is lower temporal frequency and near vertical measurements but could provide a high density with a quite regular spatial sampling over a large area with millimetre level accuracy. Extensive studies have proven the effectiveness of GNSS and PsInSAR techniques for bridges structural health monitoring (Milillo et al. 2019; Jung et .al, 2019; Roberts, et al., 2020).
In this framework, we propose to equip and study a long cable-stayed bridge using these two techniques conjointly for a good compromise in terms of accuracy, frequency and density. To go further in analysis and methods, we decide to dispose GNSS receivers and radar corner at same location on the bridge. This paper details our approach, materials, and show preliminary results.
* Corresponding author
2. STUDY AREA
This study is interested in the long-term monitoring of a cable-stayed bridge relaying two sides of a valley. This road bridge has a total span of 763m supported by two pylons of 165m height and 248 cables. With a deck of 35m wide, it offers 6 lanes (3 each direction) connecting the city to its suburbs. This bridge is operational since 1997.
In the last decade, the city known a raise in traffic volume but also vehicles become heavier, faster and frequently used. Under those circumstances, a number of bridges experienced an increase in traffic loads leading to a requirement of continuous monitoring of the performance of some vulnerable and most impacted bridges. Since 2014, structural health monitoring systems were designed and deployed on some of these bridges by Cementys using different types of geotechnical sensors measuring strains, displacements, tilts and environmental conditions.
The cable-stayed bridge is one of impressive bridges that Cementys is monitoring regarding its slender geometry and long span. A total number of 26 optical fibre based sensors are installed and installed as follows: 4 tilt sensors on the pylons to measure pylons tilt in longitudinal and transverse directions, 2 displacement sensors on the expansion joints to measure its opening and 20 additional sensors that measure cracks, strains and cables tension. A camera and weather station are also installed to estimate traffic and measure environmental loads (temperature, pressure, humidity and air speed and direction). As shown by the installed SHM system and confirmed by more detailed other studies (Kaloop et al., 2009; Im et al., 2013; TingHua et al., 2010), this type of bridge is sensitive, in short terms, to wind, temperature and traffics loads that have a structural response as periodic or reversible displacements like deck deflection, joints opening and pylons tilt. On long terms, these structures may undergo a structural damage as cables tension loss, dilatation joints blockage, concrete creep and cracking or foundations settlements leading to permanent or irreversible displacements like permanent towers tilt and deck deflection or rotation. In addition, this can lead to unexpected displacement amplitude in the case of periodic displacements related to thermal expansion.
The International Archives of the Photogrammetry, Remote Sensing and Spatial Information Sciences, Volume XLIII-B3-2020, 2020 XXIV ISPRS Congress (2020 edition)
After 4 years of continuous monitoring, we have upgraded this monitoring system with geodetic techniques such as PsInSAR and GNSS to a better understanding of the structure behaviour in a common three-dimensional referential. In addition to local measurements, geodetic techniques offer global measurements independently of the structure (Psimoulis et al., 2017).
3. MATERIALS AND METHODS
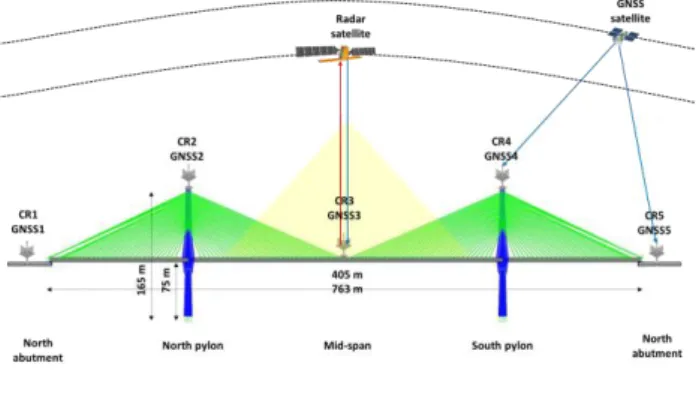
The new monitoring system focuses on using GNSS and PsInSAR techniques that offer together dense measurements in space and in time (Figure 1). We have developed and installed a low cost GNSS monitoring system and homemade radar reflectors on the bridge key points (pylons, mid-span) and set up processing chains for continuous and long term monitoring.
Figure 1. GNSS and PsInSAR monitoring system installed on the cable stayed bridge
3.1 Low-cost monitoring system
The use of GNSS for displacement monitoring of such large structures can enhance the knowledge and understanding of the real behaviour of the bridge, both in terms of 3D time series and in terms of frequency responses. Such measurements can also aid the early detection of faults in bridge structures. This technique allows a 3D monitoring of bridges dynamic and static behaviour with high temporal frequency and millimetre accuracy of a limited, but accurately defined, number of points.
This technique is used to survey the static behaviour of the bridge components for long-term period. For this purpose, a GNSS monitoring system (Figure 2) has been developed based on low-cost single-frequency GNSS receivers and antennas for data acquisition and the open source RTKLIB software for data processing (Takasu et al. 2007). We have developed our own GNSS receivers based on the ublox NEO-M8P module, which is able to acquire GNSS phase observables with a sampling rate up to 10Hz and allows precise coordinates calculation.
Figure 2. Low-cost monitoring system components
The choice of a low-cost system allowed us to reduce the cost of instrumentation and to deploy a total number of five permanent GNSS monitoring receivers on this large structure. During the deployment, some main criterions were respected: regarding the structure, monitoring points correspond to the key points of the bridge where displacements suspected to reflect most the static response the loading and environmental conditions. Two monitoring receivers are installed on the pylons to survey their tilt and settlement and another on the mid-span to measure its deflection. Two GNSS reference receivers are installed on the abutment of each side of the valley, which are the closest structurally stable points to the bridge (Figure 1). Bridge guardrails, cables and pylons are the main source of multipath. To minimise these effects, which are common in such environment (Moschas, Stiros, 2014), the locations and the heights of the antennas (relative to the bridge deck) have been adapted depending the surrounding environment. A fully automated processing chain was developed to calculate the coordinates of the monitoring receivers using the RTKLIB software. It uses the classical fast static differential method, as for this structure, the maximum baseline length is of about 800 meters, short enough to minimise common errors affecting GNSS differential positioning such as troposphere, ionosphere and orbit errors. To reduce multipath and atmospheric refraction effects, a 10 degrees elevation cut-off angle is applied. Positioning time series are computed using a 30-minutes time step, allowing to cut off high frequency displacements due to traffic and wind loads, but not to omit bridge’s displacement due to thermal expansion. 3.2 Homemade multi-passes corner reflectors
The exact position of PsInSAR measurement points (PS) is generally not known (Garthwaite, 2017) or predictable, it is in some way random and highly dependent of the details of the structure. It is useful to have targets on the structure’s key points (mid-span and pylons) to ensure getting measurement points on those exact locations.
We have designed a radar corner reflector adapted to multi-pass (ascending, descending) and multi-satellite for X band SAR imagery. Based on previous studies (Parizzi et al., 2006; Ferretti et al., 2007; Quin, Loreaux, 2013; Qin et al., 2013; Garthwaite, 2017; Algafsh et .al, 2017), we have dimensioned a compact bilateral cubic trihedral corner reflector (CR) with a total size of 60cm adapted for slender structures. The design takes into consideration the required accuracy, imaging mode, the surrounding clutter noise, and the different sources of signal loss (manufacturing imprecisions, perforating, installation misalignments…).
On SAR image level, each pixel is the coherent sum of the responses of many discrete scatterers. To be considered as a PS, the pixel should contain a dominant scatterer that have a long-term stable phase characteristics and other distributed scatterers within the same pixel form the random part of response, which is modelled as noise (Garthwaite, 2017). Generally, those PS pixels exhibit a high signal-to-clutter ratio (SCR) (Ferretti et al., 2007). Which is defined as the ratio of the dominant scatterer Radar Cross Section (RCS) referred as signal and its background RCS (clutter):
𝑆𝐶𝑅 = 𝑅𝐶𝑆𝑡𝑎𝑟𝑔𝑒𝑡
𝑅𝐶𝑆𝐵𝑎𝑐𝑘𝑔𝑟𝑜𝑢𝑛𝑑 (1)
RCS depends on many factors, including (Garthwaite, 2017): Radar system: pixel RCS depends to imaging geometry,
mode and wavelength.
Terrain type: The clutter RCS varies with vegetation density, soil, moisture.
The International Archives of the Photogrammetry, Remote Sensing and Spatial Information Sciences, Volume XLIII-B3-2020, 2020 XXIV ISPRS Congress (2020 edition)
Typically, the clutter RCS varies between -10dB and -14dB for natural flat terrain with low vegetation cover (Garthwaite, 2017). Larger values in urban environments of up to 4dB should be excepted (Gernhardt et al., 2010). For SCR values above 10, phase standard deviation is highly dependent to the SCR (Garthwaite, 2017) and can be approximated by:
𝜎𝑙𝑜𝑠= 𝜆 4𝜋. √
1
2.𝑆𝐶𝑅 (2)
Using an artificial target with high RCS improves PS detection on its location. The RCS of an artificial target is related to its form and size. Therefore, the design and dimensioning of this artificial target is an essential step, which consists of:
Choosing the reflector form Dimensioning the reflector size Estimating different signal losses 3.2.1 Reflector shape
Different shapes of reflectors have been used with PsInSAR method like dihedrals (Ferretti et al., 2007) and trihedral reflectors commonly referred as corner reflectors (CR) such as triangular trihedrals (Garthwaite, 2017) and rectangular or cubic trihedrals (Qin et al., 2013). Among theme, a cubic trihedral form is used in this study, which maximizes the RCS, and subsequently the SCR for a relatively compact size compared to a triangular form that is more adapted to a bridge structure. Moreover, reflectors with trihedral form is less sensitive to RCS losses due to misalignments to satellites LOS (Ferretti et al., 2007; Garthwaite, 2017; Quin et al., 2012).
3.2.2 Bilateral reflector
To enable 3D deformation monitoring using ascending and descending orbits (Blasco et al., 2019), we made a bilateral corner reflector. A variety of this approach was adopted by (Ferretti et al., 2007) to validate PSInSAR measurements using pairs of dihedral reflectors with a small horizontal offset and oriented toward ascending and descending LOSs. Another type of bilateral reflectors was proposed by (Parizzi et al., 2006) and (Quin et al.,2013) using asymmetrical cubic and triangular CR that share the same phase centre.
Based on previous studies, we made our bilateral corner reflector by attaching tow identical cubic CRs on the level of their vertical edges and aligning their horizontal diagonals. This is achieved, during manufacturing, simply by attaching and horizontal plate to two vertical and orthogonal plates. The resulting object is a 4 sides CR (Figure 3) with two backscattering surfaces and two others that will ensure its rigidity and serve as a support for other measurement instruments (GNSS antenna, topographic targets or reflector, levelling benchmark …) which could be placed with a precise offset to the CR phase centre. We are interested, in a first time, in using a GNSS antenna with this CR, which can be affected by multipaths if installed near to the reflector plates. For that, we added a mounting pole on the CR top with a near zero horizontal offset and precisely defined vertical offset (Figure 3).
Figure 3. Home-made bilateral corner reflector co-located with GNSS antenna
3.2.3 Reflector dimensioning
The size of the reflector mainly affects its RCS; relatively the SCR in a SAR image which depends to the reflectivity of its background clutter and consequently measurements accuracy. First, we define the required LOS accuracy to determine the SCR. Then, using imaging mode parameters in X band to calculate pixel area A and clutter information we can estimate the required RCS (Equation 3) and the corresponding CR size.
𝑆𝐶𝑅 = 𝑅𝐶𝑆 − (10𝑙𝑜𝑔
10(𝐴) + 𝐶𝑙𝑢𝑡𝑡𝑒𝑟)
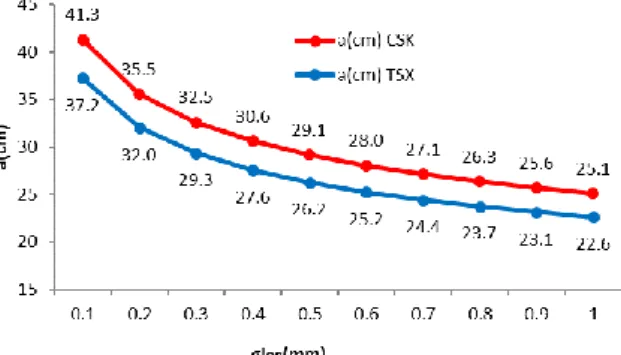
(3) The pixel area in ground geometry is about 18.1m² for COSMOSkyMed (CSK) and 6.9m² for TerraSAR-X (TSX) stripmap modes. Clutter value is expected to be higher than 4dB over our area regarding the presence of several high reflective objects on the bridge and underneath it. We overestimate this parameter to be around 10dB. The following figure represents the required LOS accuracy (σlos) and its corresponding corner size (a) derived using equations (2) and (3) with the previous fixed values. We adopted a size of 30cm corresponding to a LOS accuracy of about 0.3 to 0.4mm (Figure 4). This compact size allowed us to easily manufacture the CR and install it in small area on the bridge structure.Figure 4. CR size as a function of required LOS accuracy 3.2.4 Manufacturing considerations
We made the CR of galvanized steel to reduce manufacturing costs; however, aluminium is commonly used for his resistance to corrosion and his lightness. The perforation of the plates reduces the weight and resists all weather conditions, mainly precipitations, dust, and wind. Plates holes will result in a loss of RCS (Qin et al., 2013; Garthwaite, 2017) which is dependent to holes size and inversely to their spacing. Giving that, we introduced holes on effective CR surfaces of 5mm size and 10mm spacing. This configuration will introduce a loss of about 1dB (Algafsh et al., 2017). Other parameters must be taken in consideration during manufacturing and that can highly affect the RCS loss like: corners orthogonality, plates curvatures and irregularities (Döring et al., 2007 ; Garthwaite, 2017).
3.2.5 Reflector installation and orientation
The CR is made to be installed vertically without any elevation adjustment and to be oriented approximately toward satellite azimuth or to the north, depending on the installation location and if multi platforms are to be used. This type of installation introduces a RCS loss, which depends on the misalignment angle in elevation and azimuth directions. (Qin et al., 2013) demonstrated that a rectangular CR can tolerate not more than -The International Archives of the Photogrammetry, Remote Sensing and Spatial Information Sciences, Volume XLIII-B3-2020, 2020
3dB for a misalignment of 20° in elevation and 20° in azimuth directions. Considering an angle of incidence varying from 29° to 45° and platform heading of ±10 degrees between the descending and ascending orbits, the misalignments caused by this installation will be of the order will note exceed the range of 20° which corresponds to a RCS loss of -3dB.
We have installed 5 of these reflectors on the same locations as GNSS antennas: two references on abutments and the others on pylons and mid-span. CR are mounted on a support of 50cm and fixed to the bridge structure. The orientation is done using a level and a compass to approximately pointe the CR effective surfaces toward the east and the west or simply by pointing a diagonal toward the north. GNSS antennas are then mounted on the top of the CRs.
3.3 GNSS antennas and CRs co-location
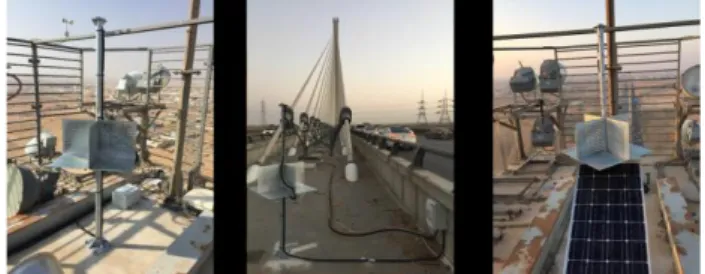
GNSS antennas and CR co-location have been used for INSAR datum connection, absolute deformation calculation and 3D monitoring (Fuhrmann et al., 2018) and other applications using also radar transponders (Mahapatra et al., 2017). We installed radar corner reflectors co-located with GNSS (Figure 5). In the aim of enabling a complete validation of PS location and the displacement measurement from Ps-InSAR processing. Secondly, this will allow the combination of both techniques in a mathematical framework in our future studies, as in (Hu et al., 2012; Simonetto et al., 2014; Doucet, 2018).
Figure 5. Co-located CRs and GNSS antennas installed on the bridge
To be able to combine or compare and validate two different measurements on the level of certain tie points, the latter must be physically the same or at least have the same displacements. Giving that PS points from a CR or a natural scatterer position within a pixel is not known, we physically connected the CR to the GNSS antenna with a fixed and well-defined vertical offset, which is introduced to avoid multipath effects and a horizontal offset close to zero. Another advantage is that the bilateral CR have the same phase centre, which will allow us to have the same point also in different geometries.
In time domain, measurements must be synchronised especially for a dynamic structure like a bridge, which can be deformed during in short time spans. For this reason, we extract from our 30-minutes GNSS time series the GNSS coordinates calculated during an interval of 30min around each SAR images acquisition time.
3.4 PsInSAR processing
20 CosmoSkyMed stripmap images in descending orbit are used for this study through a processing chain based on SNAP as INSAR processor and StaMPS (Hooper et al., 2007) for PsInSAR processing. The dataset covers a period of 11 months beginning from December 2018 to November 2019 with a mean temporal baseline of 17 days. The maximum perpendicular baseline is about 1154m in the dataset (Figure 6).
Figure 6. Perpendicular base lines of processed dataset For interferograms generation, Snap2Stamps (Foumelis et al.,
2018) automated processing chain is used and adapted to handle stripmap mode products. First, all images are coregistered to a single master. Interferometric phases are then calculated with the master image and topographic phases are estimated and removed to calculate differential phases. The differential interferograms are then exported with coregistered amplitude images, the elevation model, and orthorectified longitude and latitude bands to the StaMPS processing chain. SRTM 1 DEM was used here for the topographic phase removal and longitude/latitude bands geocoding.
A first PS candidates (PSC) identification is performed according to their amplitude dispersion. Then phase analysis is applied to select only PS with stable phase. During this step, the phases are assumed spatially correlated only on a small range of the bridge width. Consequently, we reduced sampling grid and filter window sizes to include only pixels with the same deformation pattern during the phase stability estimation. DEM error threshold is increased to avoid dropping PS located on the bridge where this parameter is expected to be higher due to the used DEM low resolution and uncertainties. Selected PS phase is corrected from look angle error, unwrapped and filtered for atmospheric phase screen (APS) and residual noise correction. LOS velocities and displacement time series are computed relative to a reference area centred on the north bridge abutment with a radius of 20m. 3.5 PS 3D location correction
A precise PS 3D location is required to associate detected PS to a specific physical scatterer like CR or specific bridge parts allowing a valid deformation interpretation and comparison with results from GNSS and the other mentioned in-situ instruments. Particularly in the case of this structure, the presence of other scatterers located on the ground around and underneath the bridge can lead to miss-identification of interesting PSs. Geocoding is the algorithm that assigns to each pixel a 3D position in a geodetic reference system using the master orbit parameters and DEM heights. Therefore, if the DEM heights are not accurate enough, the 3D coordinates of the PS will have offsets with respect to their true positions (Montazeri et al., 2018). As shown in (Figure 7) the height difference between PS real position and its position from a DEM induces an horizontal shift in the ground range. Based on radar imaging geometry, this shift can be calculated and then projected onto north and east directions using satellite orbit heading (Jung et al., 2019): The International Archives of the Photogrammetry, Remote Sensing and Spatial Information Sciences, Volume XLIII-B3-2020, 2020
X
{
∆𝑒𝑎𝑠𝑡 = ∆𝐻. cot(𝜃) . cos(𝛼)
∆𝑛𝑜𝑟𝑡ℎ = ∆𝐻. cot(𝜃) . sin(𝛼)
(4) Where∆𝐻
is the height error,𝜃
is the incidence angle and𝛼
is the satellite heading azimuth measured clockwise from the north.Figure 7. Range shift induced by height error (Montazeri et al., 2018)
These horizontal shifts are then transformed to longitude and latitude shifts in WGS84 reference system. The transformation can be approximated by the following equations considering a spherical Earth model:
{
∆𝜆 = acos (1 −
∆𝑒𝑎𝑠𝑡2 2.𝑅𝑒²)
∆𝜑 = acos (1 −
∆𝑛𝑜𝑟𝑡ℎ2 2.𝑅𝑒2)
(5)Where
𝑅𝑒
is the Earthmean radius,∆𝜆
and∆𝜑
are longitude and latitude shifts.Using high resolution Digital Surface Model (DSM) can minimise height errors and improve PS geocoding (Blasco et al., 2019). However, in absence of such data, we exploited residual DEM errors from PsInSAR processing to update PS geocoding (Crosetto et al., 2010). This is achieved by estimating vertical and horizontal PS shifts associated to DEM errors and by updating PS coordinates as mentioned above.
As we used SRTM DEM with a resolution of 30m, the bridge heights were not included (Figure 7). Therefore, we implemented this approach as final step in StaMPS to update PS geocoding. Results are exported to GIS format allowing overlying PsInSAR deformation map on other data types (satellite and aerial optical imagery, bridge model, corner reflector locations…). The developed codes for the geocoding update and GIS export are in Matlab and will be available for public on GitHub.
Figure 7. A subset of the used SRTM 1 DEM showing that bridge (in blue) heights are not included.
4. RESULTS 4.1 GNSS results
GNSS time series was recorded on a time span of one year beginning from March 2019 to March 2020 on three GNSS located on north pylon (GNSS2), in the middle (GNSS3) and on the south pylon (GNSS4). Displacements was projected in the bridge’s coordinates system. These measurements show that the displacement is periodic on daily and seasonal cycles (Figure 8).
GNSS2
GNSS3
Figure 8. Daily displacements and temperatures on north pylon (GNSS2) and mid-span (GNSS3)
Daily measurements show that the bridge undergo reversible horizontal and vertical displacements that are highly correlated with temperature cycles. Bridge pylons (GNSS2 and GNSS4) are more affected by horizontal displacements with maximum values of 40mm in transvers and alongside directions during midday. We can clearly note that the pylons bend and converge during the day then return to their initial position at night. In contrast, mid-span (GNSS3) is more affected by vertical displacements that inversely correlated temperature variations with maximum values of about 60mm during midday. We can note also that mid-span vertical displacements follows pylons convergence. These displacements are caused by thermal expansion that affect mainly pylons, cables and mid-span (Cao et al., 2011).
Seasonal time series are calculated at SAR images acquisition time over the same period March 2019 to March 2020. Measurements on GNSS2 and GNSS3 show that pylons and mid-span undergo a reversible displacement in three axis over the year. The pylons get taller during summer high temperatures and return to original height in low temperatures of January showing a height variation of 50mm. Horizontal displacements amplitude also increase with temperature in alongside and transvers directions to reach 60mm during summer. Regarding the mid-span, vertical displacements are not much impacted by temperature as horizontal displacements. The plat-form height appear to be less correlated with mean temperature than what daily measurements have showed.
The International Archives of the Photogrammetry, Remote Sensing and Spatial Information Sciences, Volume XLIII-B3-2020, 2020 XXIV ISPRS Congress (2020 edition)
Figure 9. Seasonal displacements on north pylon (GNSS2) and mid-span (GNSS3)
4.2 PsInSAR results
4.2.1 Amplitude images analysis
(Figure 10) shows the mean radar amplitude image of the bridge area. In similar studies (Zhao et al., 2017, Qin et al, 2017), where the studied bridges are laying on water surface, they are easily perceived like bright spot on the water surface. In our case, we could not clearly distinguish the bridge. Although, we can approximate its location relatively and symmetrically to its clear radar shadow and the valley borders.
Figure 10. Mean amplitude image in SAR geometry with approximate CRs locations (Left). Bridge optical imagery showing the cars holding facility underneath it (right) We located approximately the position of the 5 CRs using their GNSS longitude latitude coordinates on geocoded amplitude images (Figure 10). Bright spots can be clearly seen on low amplitude background in these areas for the CR1 and CR5. CRs located the suspended parts of the bridge are more likely to be surrounded by high amplitude scatterers that obscure their signal. As shown above, bridge suspended part and CRs installed on it are not distinguished from the background on amplitude images. This can be attributed by the fact that the bridge is laying on a car holding facility (Figure 10), where parked cars backscattering around and underneath the bridge can obscure its signal. Such particular environment can lead to range ambiguity (Rossi, Eineder, 2015) between the bridge and its underneath surface. This phenomenon occurs when two objects are at the same range from the radar sensor. As result, two distant scatterers can be imaged to the same pixel.
4.2.2 PS detection and position
Figure 11 shows detected PS on the bridge’s area represented on mean amplitude background. A number of thousands of PS that are detected alongside the bridge is lower than what we expected. Other PS are located mainly on the valley slops and the surface around the bridge.
Figure 11. Detected PS on mean amplitude background in SAR geometry (Left). PSC and PS after phase stability analysis
(right)
Corrected 3D position of PS (longitude, latitude, height) (Figure 12) shows that the detected PS are located on the ground level underneath the bridge. And giving that the bridge is not included in DEM used for topographic phase removal, the residual DEM error is expected to be about a hundred of meters on the bridge. Even though, it does not exceed 40m on the entire studied region.
Figure 12. Corrected 3D position of the selected PS As seen in amplitude analysis, bridge-backscattering response is obscured by double scatterers as cars that are high reflective. Giving that they are replaced, moved, or parked for the first time on a bare area (Figure 10), scattering proprieties would be variable over time. As consequence, corresponding pixel phase will be dominated by noise. Those pixels passed the first amplitude thresholding and were detected as PSC, but during phase analysis, they are rejected. We can also note that the number of PS in a buffer of 200m from the bridge has dropped by a factor of 5 after phase analysis step in StaMPS. Indeed 15413 PSC were detected whose several points on the bridge and on the CRs position. However, 3038 PS were selected. The dropped PSC are mainly located on the bridge suspended part and the car holding facility.
Noise term is estimated in StaMPS by band-pass filter over a window that include a number of pixels assuming phase spatial correlation over a given distance. This filter can consider any steep phase gradients that is not correlated over this distance as The International Archives of the Photogrammetry, Remote Sensing and Spatial Information Sciences, Volume XLIII-B3-2020, 2020
noise. In this case, steep phase variation due to the bridge deformation or residual topographic phase would be considered as noise. Which can explain why those pixels are note selected. We suggest investigating a way to adapt the filter to this type of cases or use other implementation that are not based on a spatial correlation assumption.
5. CONCLUSION
This paper has highlighted the study of cable-stayed bridge deformations using PsInSAR and GNSS techniques. For that purpose, we have managed to develop a GNSS monitoring system providing accurate 3D displacements using ublox low-cost mono-frequency receivers and antennas. We have developed also a a homemade compact multi-pass corner reflector, designed to be easily manufactured and installed in the field, and to co-locate a GNSS and PsInSAR measurements with minimal and fixed offsets. The developed instruments were installed on the bridge key points. Three monitoring corner reflectors and GNSS antennas are installed on the pylons and the mid-span and two reference points are chosen on the bridge abutment as a stable area. Data processing workflows were detailed beginning by GNSS data processing made in fast static differential mode each 30min for continuous monitoring and synchronised with PsInSAR measurement time for comparison. For PsInSAR, 20 CosmoSkyMed stripmap images from descending orbit was processed with SNAP and StaMPS and automated by snap2stamps codes. Considerable progress is made in this work on PSs 3D location correction using DEM error residuals from StaMPS and data export to GIS.
GNSS measurements for one year showed that the bridge undergoes daily and seasonal deformations related to thermal expansion. Horizontal displacements are in the order of 40mm and vertical displacements of about 60mm that can be detected and confirmed by PsInSAR measurements. CRs and bridge radar signal is obscured by surrounding scatterers and first PS processing steps confirmed that pixel on bridge footprint have a low amplitude dispersion, but their phase is dominated by noise. Hence, they are not selected as PS. Several explanations related to the bridge particular environment and the PS detection algorithm are made. However, more investigations on the subject should be carried out.
Future work will be concentrated on overcoming these limitations. Then, our work will focus on conjointly exploiting GNSS and PsInSAR measurements for a good compromise in terms of accuracy, frequency and density.
ACKNOWLEDGEMENTS
The authors are thankful for the free using of StaMPS, SNAP and automated codes snap2stamps from (Foumelis et al.; 2018). The research was made possible by exploiting CSK data provided by ASI. We gratefully acknowledge the help provided by ESA STEP forum users and moderators. We are thankful for the aid of the bridge operator and in field workers.
REFERENCES
Algafsh, A., Inggs, M., & Mishra, A. K. (2017). The effect of perforating the corner reflector on maximum radar cross section. Mediterranean Microwave Symposium, 31–34. https://doi.org/10.1109/MMS.2016.7803815
Blasco, J. M. D., Foumelis, M., Stewart, C., & Hooper, A. (2019). Measuring urban subsidence in the Rome Metropolitan Area (Italy) with Sentinel-1 SNAP-StaMPS
Persistent Scatterer Interferometry. Remote Sensing,
11(2). https://doi.org/10.3390/rs11020129
Blasco, J. M. D., Foumelis, M., Stewart, C., & Hooper, A. (2019). Measuring urban subsidence in the Rome Metropolitan Area (Italy) with Sentinel-1 SNAP-StaMPS Persistent Scatterer Interferometry. Remote Sensing,
11(2). https://doi.org/10.3390/rs11020129
Cao, Y., Yim, J., Zhao, Y., & Wang, M. L. (2011). Temperature effects on cable stayed bridge using health monitoring system: A case study. Structural Health Monitoring,
10(5), 523–537.
https://doi.org/10.1177/1475921710388970
Crosetto, M., Monserrat, O., Iglesias, R., & Crippa, B. (2010). Persistent Scatterer Interferometry: Potential, Limits and Initial C-and X-band comparison. Photogrammetric Engineering and Remote Sensing, 76(9), 1061–1069. https://doi.org/10.1029/2004GL021737.
Döring, B. J., M. Schwerdt, and R. Bauer (2007), TerraSAR-X Calibration Ground Equipment, paper presented at Wave Propagation in Communication, Microwave Systems and Navigation (WFMN07), Chemnitz, Germany, 4-5 July 2007
Doucet, S. (2018). Combinaison de mesures géodésiques pour l'étude de la subsidence: application à la saline de Vauvert, Gard, France (Doctoral dissertation, Montpellier).
Ferretti, A., Savio, G., Barzaghi, R., Borghi, A., Musazzi, S., Novali, F., … Rocca, F. (2007). Submillimeter accuracy of InSAR time series: Experimental validation. IEEE Transactions on Geoscience and Remote Sensing, 45(5), 1142–1153. https://doi.org/10.1109/TGRS.2007.894440 Foumelis, M., Blasco, J. M. D., Desnos, Y. L., Engdahl, M.,
Fernández, D., Veci, L., … Wong, C. (2018). ESA SNAP - Stamps integrated processing for Sentinel-1 persistent scatterer interferometry. International Geoscience and Remote Sensing Symposium (IGARSS), 2018-July(July), 1364–1367.
https://doi.org/10.1109/IGARSS.2018.8519545
Fuhrmann, T., Garthwaite, M., Lawrie, S., & Brown, N. (2018). Combination of GNSS and InSAR for Future Australian Datums. International Global Navigation Satellite Systems Association IGNSS Symposium 2018, (February). Garthwaite, M. C. (2017). On the Design of Radar Corner
Reflectors for Deformation Monitoring in Multi-Frequency InSAR. Remote Sens. 2017, 9, 648; Doi:10.3390/Rs9070648, (June).
https://doi.org/10.3390/rs9070648
Gernhardt, S., Adam, N., Eineder, M., & Bamler, R. (2010). Potential of very high resolution SAR for persistent scatterer interferometry in urban areas. Annals of GIS,
16(2), 103–111.
https://doi.org/10.1080/19475683.2010.492126
Hooper, A., Segall, P., & Zebker, H. (2007). Persistent scatterer interferometric synthetic aperture radar for crustal deformation analysis, with application to Volcán Alcedo, Galápagos. Journal of Geophysical Research: Solid
The International Archives of the Photogrammetry, Remote Sensing and Spatial Information Sciences, Volume XLIII-B3-2020, 2020 XXIV ISPRS Congress (2020 edition)
Earth, 112(7), 1–21.
https://doi.org/10.1029/2006JB004763
Hu, J., Li, Z. W., Sun, Q., Zhu, J. J., & Ding, X. L. (2012). Three-dimensional surface displacements from InSAR and GPS measurements with variance component estimation. IEEE Geoscience and Remote Sensing Letters, 9(4), 754-758.
Im, S. B., Hurlebaus, S., & Kang, Y. J. (2013). Summary review of GPS technology for structural health
monitoring. Journal of Structural Engineering, 139(10), 1653–1664. https://doi.org/10.1061/(ASCE)ST.1943-541X.0000475.
Jung, J., Kim, D. J., Vadivel, S. K. P., & Yun, S. H. (2019). Long-term deflection monitoring for bridges using X and C-band time-series SAR interferometry. Remote Sensing,
11(11), 1–21. https://doi.org/10.3390/rs11111258 Mahapatra, P., der Marel, H. van, van Leijen, F.,
Samiei-Esfahany, S., Klees, R., & Hanssen, R. (2017). InSAR datum connection using GNSS-augmented radar transponders. Journal of Geodesy, 92(1), 21–32. https://doi.org/10.1007/s00190-017-1041-y
Milillo, P., Giardina, G., Perissin, D., Milillo, G., Coletta, A., & Terranova, C. (2019). Pre-Collapse Space Geodetic Observations of Critical Infrastructure: The Morandi Bridge, Genoa, Italy. Remote Sens. 2019, 11, 1403; Doi:10.3390/Rs11121403.
Montazeri, S., González, F. R., & Zhu, X. X. (2018). Geocoding error correction for InSAR point clouds. Remote Sensing,
10(10), 1–22. https://doi.org/10.3390/rs10101523 Moschas, F., & Stiros, S. (2014). Dynamic multipath in
structural bridge monitoring: An experimental approach.
GPS Solutions, 18(2), 209–218.
https://doi.org/10.1007/s10291-013-0322-z
Parizzi, A., Perissin, D., Prati, C., & Rocca, F. (2006). Artificial scatterers for S.A.R. interferometry. European Space Agency, (Special Publication) ESA SP, (611), 399–403. Psimoulis, P., Meng, X., Owen, J., Xie, Y., Nguyen, D. T., &
Ye, J. (2017). GNSS and Earth Observation for Structural Health Monitoring ( GeoSHM ) of the Forth Road GNSS and Earth Observation for Structural Health Monitoring.
SMAR 2017 - 4th Conference on Smart Monitoring Assessment and Rehabilitation of Civil Structures. Qin, X., Liao, M., Yang, M., & Zhang, L. (2017). Monitoring
structure health of urban bridges with advanced multi-temporal InSAR analysis. Annals of GIS, 23(4), 293–302. https://doi.org/10.1080/19475683.2017.1382572 Qin, X., Liao, M., Yang, M., & Zhang, L. (2017). Monitoring
structure health of urban bridges with advanced multi-temporal InSAR analysis. Annals of GIS, 23(4), 293–302. https://doi.org/10.1080/19475683.2017.1382572 Qin, Y., Perissin, D., & Lei, L. (2013). The design and
experiments on corner reflectors for urban ground deformation monitoring in Hong Kong. International Journal of Antennas and Propagation, 2013. https://doi.org/10.1155/2013/191685
Quin, G., & Loreaux, P. (2013). Submillimeter accuracy of multipass corner reflector monitoring by PS technique.
IEEE Transactions on Geoscience and Remote Sensing,
51(3), 1775–1783.
https://doi.org/10.1109/TGRS.2012.2206600
Roberts, G. W., Meng, X., Psimoulis, P., & Brown, C. J. (2020). Time Series Analysis of Rapid GNSS Measurements for Quasi-static and Dynamic Bridge Monitoring. Springer International Publishing. https://doi.org/10.1007/978-3-030-21718-1_12
Simonetto, E., Durand, S., Burdack, J., Polidori, L., Morel, L., & Nicolas-Duroy, J. (2014). Combination of INSAR and GNSS measurements for ground displacement monitoring. Procedia Technology, 16, 192-198. T.Takasu, N.Kubo, A.Yasuda, Development, Evaluation and
Application of RTKLIB: A program library for RTK-GPS, GPS/GNSS Symposium 2007, Tokyo, Japan, November 20-22, 2007 (in Japanese)
Yi, T. H., Li, H. N., & Gu, M. (2010). Recent research and applications of GPS based technology for bridge health monitoring. Science China Technological Sciences,
53(10), 2597–2610. https://doi.org/10.1007/s11431-010-4076-3
Zhao, J., Wu, J., Ding, X., & Wang, M. (2017). Elevation extraction and deformation monitoring by multitemporal InSAR of Lupu Bridge in Shanghai. Remote Sensing,
9(9), 1–13. https://doi.org/10.3390/rs9090897 Rossi, C., & Eineder, M. (2015). High-Resolution InSAR
Building Layovers Detection and Exploitation. IEEE Transactions on Geoscience and Remote Sensing, 53(12), 6457–6468. https://doi.org/10.1109/TGRS.2015.2440913 The International Archives of the Photogrammetry, Remote Sensing and Spatial Information Sciences, Volume XLIII-B3-2020, 2020