Discovering Social Networks from Event Logs
WIL M. P. VAN DER AALST1, HAJO A. REIJERS1& MINSEOK SONG1,2
1
Department of Technology Management, Eindhoven University of Technology, 513,
NL-5600 MB, Eindhoven, The Netherlands (E-mail: w.m.p.v.d.aalst@tm.tue.nl);2Department of Industrial Engineering, Pohang University of Science and Technology, San 31 Hyoja-Dong, Nam-gu, Pohang, 790-784, South Korea
Abstract. Process mining techniques allow for the discovery of knowledge based on so-called ‘‘event logs’’, i.e., a log recording the execution of activities in some business process. Many information systems provide such logs, e.g., most WFM, ERP, CRM, SCM, and B2B systems record transactions in a systematic way. Process mining techniques typically focus on per-formance and control-flow issues. However, event logs typically also log theperformer, e.g., the person initiating or completing some activity. This paper focuses on mining social net-works using this information. For example, it is possible to build a social network based on the hand-over of work from one performer to the next. By combining concepts from workflow management and social network analysis, it is possible to discover and analyze social net-works. This paper defines metrics, presents a tool, and applies these to a real event log within the setting of a large Dutch organization.
Key words: business process management, data mining, Petri nets, process mining, social network analysis, workflow management
1. Introduction
This paper builds on concepts from business processmanagement (workflow management in particular) and sociometry (social network analysis in particular).
Business process management is concerned withprocess-aware information systems, i.e., systems supporting the design, analysis, and enactment of operational business processes. Typical examples of such process-aware systems are workflow management systems where the process is driven by an explicit process model (Jablonski and Bussler, 1996; Leymann and Roller, 1999; Aalst and Hee, 2002). However, in many other process-aware infor-mation systems the process model is less explicit and users can deviate from the ‘‘normal flow’’, i.e., these systems allow for more flexibility.
Sociometry, also referred to as sociography, refers to methods presenting data on interpersonal relationships in graph or matrix form (Burt and Minor, 1983; Scott, 1992; Wasserman and Faust, 1994). The term sociometry was coined by Jacob Levy Moreno who conducted the first long-range socio-metric study from 1932 to 1938 at the New York State Training School for
Girls in Hudson, New York (Moreno, 1934). As part of this study, Moreno used sociometric techniques to assign residents to various residential cot-tages. He found that assignments on the basis of sociometry substantially reduced the number of runaways from the facility. Many more sociometric studies have been conducted since then by Moreno and others. In most applications of sociometry, the assessment is based on surveys (also referred to as sociometric tests). With the availability of more electronic data, new ways of gathering data are enabled (Feldman, 1987). By analyzing the history of a user’s e-mail interactions, personal networks can be extracted. One of the first social-networked tools developed for this purpose is ContactMap (Nardi et al., 2002). BuddyGraph (http://www.buddygraph.com) and MetaSight (http://www.metasight.co.uk) are other examples. By using logs on e-mail traffic as a starting point, meaningful organizational patterns can be distin-guished (see e.g., Ogata et al., 2001; Nardi et al., 2002; Begole et al., 2002; Farnham et al., 2004a, b; Fisher and Dourish, 2004). Similarly, information on the Web can be used for the analysis of social networks (Culotta et al., 2004). For example, Usenet data has been used to characterize the ‘‘authority’’ of individuals based on posting patterns (Smith, 1999).
For the analysis of social networks around business processes such ap-proaches are less useful, since they are based on unstructured information. For example, when analyzing e-mail it is difficult, but also crucial, to dis-tinguish between e-mails corresponding to particular activities within a business process (e.g., the decision with respect to a loan request) and e-mails representing less relevant operational details (e.g., scheduling a meeting). Fortunately, many enterprise information systems store relevant events in a more structured form. For example, workflow management systems typically register the enabling, start and completion of activities (Jablonski and Bussler, 1996; Leymann and Roller, 1999; Fischer, 2001; Aalst and Hee, 2002). ERP systems like SAP log all transactions, e.g., users filling out forms, changing documents, etc. Business-to-business (B2B) systems log the ex-change of messages with other parties. Call center packages but also general-purpose CRM systems log interactions with customers. These examples show that many systems have some kind ofevent logoften referred to as ‘‘history’’, ‘‘audit trail’’, ‘‘transaction file’’, etc. (Agrawal et al., 1998; Grigori et al., 2001; Sayal et al., 2002; Aalst et al., 2003).
When people are involved in events, logs will typically contain information on the person executing or initiating theevent. We only consider events both referring to an activityand acase(Aalst et al., 2003). The case (also named process instance) is the ‘‘thing’’ which is being handled, e.g., a customer order, a job application, an insurance claim, a building permit, etc. The activity (also named task, operation, action, or work-item) is some operation on the case, e.g., ‘‘contact customer’’. An event may be denoted by (c, a, p) wherecis the case,ais the activity, andpis the person. Events are ordered in
time allowing the inference of causal relations between activities and the corresponding social interaction. For example, if (c, a1, p1) is directly fol-lowed by (c,a2, p2), there is some handover of work fromp1top2(note that both events refer to the same case). If this pattern (i.e., there is some hand-over of work fromp1top2) occurs frequently but there is never a handover of work from p1to p3 althoughp2 and p3 have identical roles in the organiza-tion, then this may indicate that the relation between p1 and p2 is stronger than the relation betweenp1 andp3. Using such information it is possible to build a social network expressed in terms of a graph (‘‘sociogram’’) or matrix. Social Network Analysis (SNA) refers to the collection of methods, tech-niques and tools in sociometry aiming at the analysis of social networks (Burt and Minor, 1983; Scott, 1992; Wasserman and Faust, 1994). There is an abundance of tools allowing for the visualization of such networks and their analysis. A social network may be dense or not, the ‘‘social distances’’ be-tween individuals may be short or long, etc. An individual may be a so-called ‘‘star’’ (directly linked to many other individuals) or an ‘‘isolate’’ (not linked to others). However, also more subtle notions are possible, e.g., an individual who is only linked to people having many relationships is considered to be a more powerful node in the network than an individual having many con-nections to less connected individuals.
The work presented in this paper applies the results from sociometry, and SNA in particular, to events logs in today’s enterprise information systems. The main challenge is to derive social networks from this type of data. This paper presents the approach, the various metrics that can be used to build a social network, our tool MiSoN (Mining Social Networks),1 and a case study. The paper extends the results presented in (Aalst and Song, 2004) by providing concrete metrics and demonstrating these using a case study.
The case study, used to demonstrate the applicability of our approach, has been conducted within a Dutch national public works department employing about 1000 civil servants. Based on the particular process of handling in-voices, we constructed several social networks using the various metrics de-fined in this paper. As a starting point we used an event log with about 5000 cases and more than 33,000 events. One of the metrics we applied was the handover of work mentioned before, i.e., the strength of the link from person p1to personp2is calculated based on the number of times one activity byp1is followed by an activity by p2 for the case (e.g., an invoice). The resulting social networks were analyzed using a variety of SNA techniques and the outcomes were discussed with the management of the Dutch national public works department.
The paper is organized as follows. Section 2 introduces the concept of process mining. Section 3 focuses on the mining of organizational relations, introducing concepts from SNA but also showing which relations can be derived from event logs. Section 4 defines the metrics we propose for mining
organizational relations. We propose metrics based on (possible) causality, metrics based on joint cases, metrics based on joint activities, and metrics based on special event types (e.g., delegation). Then we present our tool MiSoN. Section 6 discusses the case study. Section 7 presents related work. Finally, Section 8 concludes the paper.
2. Process mining: An overview
The goal of process mining is to extract information about processes from transaction logs (Aalst et al., 2003). We assume that it is possible to record events such that (i) each event refers to anactivity(i.e., a well-defined step in the process), (ii) each event refers to a case (i.e., a process instance), (iii) each event refers to aperformer(the person executing or initiating the activity), and (iv) events are totally ordered. Anevent logis a collection of events. Any kind of transactional information system, e.g., ERP, CRM, or workflow manage-ment systems, will offer this information in some form (Jablonski and Bussler, 1996; Leymann and Roller, 1999; Fischer, 2001; Aalst and Hee, 2002).
To clarify notions such as activity, case, performer, and event log, let us consider some examples.
– Consider the cancer treatment process in a hospital. Each case in this process refers to a patient having cancer. Examples of activities that may take place are visits of the patient to the hospital for chemother-apy, consultation of a specialist, a bone marrow transplant, etc. The performers are all kinds of health-care professionals, e.g., doctors, spe-cialists, nurses, surgeons, oncologists, radiologists, etc. An event may be the administration of chemotherapy to a patient by a nurse at a gi-ven point in time. The egi-vent log for the cancer treatment process will contain all events relevant for this process.
– Another example is the processing of job applications. Each case refers to a job application. Possible activities are confirming the application, inviting the applicant for an interview, reimbursing the travel costs, making a decision, doing a medical test, etc. The performers in the pro-cess include the personnel officers, department managers, doctors, etc. An example of an event is the invitation of an applicant for an inter-view by a personnel officer. The event log for the job application pro-cess will contain more such events ordered in time.
– The last example comes from the scientific domain. Consider the reviewing process for a journal. The cases are papers that are submitted to the journal. Examples of activities are the reviewing of a paper, the acceptance of a paper, and the notification of authors. Among the per-formers in this process are reviewers, area editors, editors in chief, authors, and editorial assistants. An example of an event is the notifica-tion of the corresponding author by an editorial assistant.
A more abstract example of an event log is shown in Table I. Each row refers to a single event, e.g., the last row refers to the execution of activity D by Pete for the 4th case.
Many information systems offer the information shown in Table I in some form. Any workflow management system will provide the information shown in Table I (and more). Note that we do not assume the presence of a workflow management system. The only assumption we make, is that it is possible to collect logs with event data. For example, ERP systems, CRM systems, HRM systems, hospital information systems, reviewing systems, etc. offer this information in some form. Nevertheless, it may take some efforts to extract this information in the right form.
Event logs, such as the one shown in Table I, can be used to construct models that explain some aspect of the behavior registered. The termprocess miningrefers to methods for distilling a structured process description from a set of real executions (Agrawal et al., 1998; Grigori et al., 2001; Sayal et al., 2002; Aalst et al., 2003). The term ‘‘structured process description’’ may be interpreted in various ways, ranging from a control-flow model expressed in terms of a classical Petri net to a model incorporating organizational, tem-poral, informational, and social aspects. In Section 7, references to the state-of-the-art using these interpretations are given. In this paper, however, we focus on the social aspect of mining event logs.
Table I. An event log
Case identifier Activity identifier Performer
Case 1 Activity A John
Case 2 Activity A John
Case 3 Activity A Sue
Case 3 Activity B Carol
Case 1 Activity B Mike
Case 1 Activity C John
Case 2 Activity C Mike
Case 4 Activity A Sue
Case 2 Activity B John
Case 2 Activity D Pete
Case 5 Activity A Sue
Case 4 Activity C Carol
Case 1 Activity D Pete
Case 3 Activity C Sue
Case 3 Activity D Pete
Case 4 Activity B Sue
Case 5 Activity E Clare
Case 5 Activity D Clare
2.1. DISCOVERING SOCIAL NETWORKS
When distilling a process model from an event log, the focus is on the various process activities and their dependencies. When deriving roles and other organizational entities, the focus is on the relation between people or groups of people and the process. Another perspective is to focus on the relations among individuals (or groups of individuals) acting in the process, in other words: the social network. Consider for example the event log of Table I. Although Carol and Mike can execute the same activities (B and C), Mike is always working with John (cases 1 and 2) and Carol is always working with Sue (cases 3 and 4). Probably Carol and Mike have the same role but based on the small sample shown in Table I it seems that John is not working with Carol and Sue is not working with Carol.2These examples show that an event log can be used to derive relations between performers of activities, thus resulting in a sociogram. For example, it is possible to generate a sociogram based on the transfers of work from one individual to another as is shown in Figure 1. Each node represents one of the six performers and each arc rep-resents that there has been a transfer of work from one individual to another. The definition of ‘‘transfer of work from A to B’’ is based on whether for the same case an activity executed by A is directly followed by an activity executed by B. For example, both in case 1 and 2 there is a transfer from John to Mike. Figure 1 does not show frequencies. However, for analysis proposes these frequencies can be added. The arc from John to Mike would then have weight 2. Typically, we do not use absolute frequencies but weighted frequencies to get relative values between 0 and 1. Figure 1 shows that work is transferred to Pete but not vice versa. Mike only interacts with John, Carol only interacts with Sue. Clare is the only person transferring work to herself.
For a simple network with just a few cases and performers the results may seem trivial. However, for larger organizations with many cases it may be possible to discover interesting structures. Sociograms as shown in Figure 1 can be used as input for SNA tools that can visualize the network in various ways, compute metrics like the density of the network, analyze the role of an individual in the network (for example the ‘‘centrality’’ or ‘‘power’’ of a performer), and identify cliques (groups of connected individuals). Section 3
John Sue
Mike
Carol Pete
Clare
will discuss this aspect in more detail and Section 4 will provide concrete metrics to derive sociograms from event logs.
2.2. OTHER TYPES OF MINING
Table I contains theminimal informationwe assume to be present in an event log. Using the information one can also discover other models (i.e., not just sociograms). For example, we have developed techniques and tools to dis-cover the process model. Figure 2 shows the resulting Petri net model after applying our a-algorithm (Aalst et al., 2004) to Table I. The model shows that the process always starts withAand ends withD. In between these tasks eitherBandCare executed orEalone.BandCare concurrent, i.e., they can be executed in any order. Given the focus of this paper, we will not elaborate further on process discovery. See Section 7 for pointers to related work.
In many applications, the event log contains atime stampfor each event and this information can be used to extract additional causality information. In addition, a typical log also contains information about thetype of event, e.g., a start event (a person selecting an activity from a worklist), a complete event (the completion of a activity), a withdraw event (a scheduled activity is re-moved), etc. Moreover, we are also interested in the relation between attri-butes of the case and the actual route taken by a particular case or allocation of work to workers. For example, when handling traffic violations: Is the make of a car relevant for the routing of the corresponding traffic violation? (e.g., People driving a Ferrari always pay their fines in time.) Another example directly related to SNA would be to see whether the sociograms for different types of cases (e.g., private and corporate customers) differ.
The presence of timing information and information on cases/activities allows for more advanced forms of process mining, e.g., methods trying to explain the performance indicators like flow times in term of the attributes/ performers of cases. Another interesting application of process mining is
A
B
C
D E
Figure 2. A process model based on the event log shown in Table I discovered by the
fraud detection, i.e., detecting suspicions patterns that may indicate security violations (cf. four eyes principle (Aalst and Hee, 2002)).
2.3. COMPLETENESS AND NOISE
For this simple example treated so far (i.e., Table I), it is quite easy to gen-erate the process model shown in Figure 2 or the sociogram shown in Figure 1. For more realistic situations there are however a number of com-plicating factors:
– Completeness. For larger workflow models and models exhibiting alter-native and parallel routing, the workflow log will typically not contain all possible routes. Consider 10 activities which can be executed in par-allel. The total number of interleavings is 10! = 3628800. It is not real-istic that each interleaving is present in a log. Moreover, certain paths through the process model may have a low probability and therefore remain undetected. Similar remarks hold for the organizational model and social network. For example, a person has a role but just by coinci-dence did not execute some or all activities corresponding to that role. Another example is that two individuals work together frequently but during the data collection period one of them was on a sabbatical leave. As a result the log is not complete in the sense that it captures possible and/or typical behavior.
– Noise. Parts of the log may be incorrect, incomplete, or refer to excep-tions. Events can be logged incorrectly because of human or technical errors. Events can be missing in the log if some of the activities are manual or handled by another system/organizational unit. Events can also refer to rare or undesired events. Consider for example the work-flow in a hospital. If due to time pressure the order of two events (e.g., make X-ray and remove drain) is reversed, this does not imply that this would be part of the regular medical protocol and should be supported by the hospital’s workflow system. Also two causally unrelated events (e.g., take blood sample and death of patient) may happen next to each other without implying a causal relation (i.e., taking a sample did not result in the death of the patient; it was sheer coincidence). Clearly, exceptions which are recorded only once should not automatically be-come part of the regular workflow.
2.4. LEGAL ISSUES AND ETHICAL ISSUES
To conclude this section, we point out legal issues relevant when mining event logs. Clearly, event logs can be used to systematically measure the perfor-mance of employees. The legislation with respect to issues such as privacy and protection of personal data differs from country to country. For example,
Dutch companies are bound by the Personal Data Protection Act (Wet Bescherming Persoonsgegevens) which is based on a directive from the European Union. The practical implications of this for the Dutch situation are described in (CBP n.d.; Hulsman and Ippel, 1994; Sauerwein and Linnemann, 2001). Event logs are not restricted by these laws as long as the information in the log cannot be traced back to individuals. If information in the log can be traced back to a specific employee, it is important that the employee is aware of the fact that her/his activities are logged and the fact that this logging is used to monitor her/his performance. Note that in a log we can deliberately abstract from information about the workers executing activities and still mine the process, organizational, and social structures (simply hide identities).3 Therefore, it is possible to avoid collecting information on the productivity of individual workers and legislation such as the Personal Data Protection Act does not apply. Nevertheless, the logs of most workflow sys-tems contain information about individual workers, and therefore, this issue should be considered carefully. Moreover, to use social network analysis as an operational tool to improve work processes, employees should approve and it is vital not to misuse the information gathered.
3. Mining organizational relations
In the previous section, we provided an overview of process mining. In this section, we focus on the main topic of this paper: mining organizational relations as described in Section 2.1. The goal is to generate a sociogram that can be used as input for standard software in the SNA (Social Network Analysis) domain.
The motivation for doing this is twofold. First of all, existing systems record information about human activity. This information can be structured in the form of a sociogram. Second, there is a wide variety of mature tech-niques and tools to analyze such sociograms. Therefore, it is both interesting and feasible to use this as a starting point for investigating the social context of work processes. A better understanding of this social context may reveal a mis-alignment between the information system and its users and may provide insights that can be used to increase the efficiency and effectively of processes and organizations.
In this section, we first introduce the fundamentals of SNA and then focus on the question how to derive sociograms from event logs.
3.1. SOCIAL NETWORK ANALYSIS
Applications of SNA range from the analysis of small social networks to large networks. For example, the tool InFlow (http://www.orgnet.com) has been used to analyze terrorist network surrounding the September 11th 2001
events. However, such tools could also be used to analyze the social network in a classroom. In literature, researchers distinguish between sociocentric (whole) and egocentric(personal) approaches. Sociocentric approaches con-sider interactions within a defined group and concon-sider the group as a whole. Egocentric approaches consider the network of an individual, e.g., relations among the friends of a given person. From a mathematical point of view both approaches are quite similar. In both cases the starting point for analysis is a graph where nodes represent people and the arcs/edges represent relations. Although this information can also be represented as a matrix, we use the graph notation. The graph can be undirected or directed, e.g., A may like B but not vice versa. Moreover, the relations may be binary (they are there or not) or weighted (e.g., ‘‘+’’ or ‘‘)’’, or a real number). The weight is used to qualify the relation. The resulting graph is named a sociogram(Scott, 1992; Wasserman and Faust, 1994). Note that Figure 1 shows an example of sociogram with directed links which are not weighted.
In a mathematical sense a sociogram is a graph (P,R) wherePis the set of individuals (in the context of process mining referred to as performers) and RPP(Scott, 1992; Wasserman and Faust, 1994). If the graph is undi-rected,Ris symmetric. If the graph is weighted, there is an additional function Wassigning a value to all elements ofR. When looking at the graph as awhole there are notions likedensity, i.e., the number of elements inRdivided by the maximal number of elements. For example the density of the graph shown in Figure 1 is 8/(6 * 6)=0.22. Another metric based on weighted graphs is the maximal geodesic distance in a graph. The geodesic distance of two nodes is the distance of the shortest path in the graph based on Rand W.
When looking at one specific individual (i.e., a node in the graph), many notions can be defined (Scott, 1992; Wasserman and Faust, 1994). If all other individuals are in short distance to a given node and all geodesic paths (i.e., shorted path in the graph) visit this node, clearly the node is very central (like a spider in the web). There are different metrics for this intuitive notion of centrality. The Bavelas–Leavitt index of centrality is a well-known example that is based on the geodesic paths in the graph (Bavelas, 1948). Let i be an individual (i.e., i2P) and Dj,k the geodesic distance from an individual j
to an individual k. The Bavelas–Leavitt index of centrality is defined as BLðiÞ ¼ ðPj;kDj;kÞ=ð
P
j;kDj;iþDi;kÞ. Note that the index divides the sum of
all geodesic distances by the sum of all geodesic distances from and to a given resource. Other related metrics are closeness (1 divided by the sum of all geodesic distances to a given resource) and betweenness(a ratio based on the number of geodesic paths visiting a given node) (Freeman, 1977; Freeman, 1979; Burt and Minor, 1983; Scott, 1992; Wasserman and Faust, 1994). Other notions include the emission of a resource (i.e., Pj Wi,j), the reception of a
resource (i.e., Pj Wj,i), and the determination degree (i.e.,
P
j Wj,i) Wi,j)
interesting metric is thesociometric status which is determined by the sum of input and output relations, i.e.,PjDj,i+Di,j. All metrics can be normalized by
taking the size of the social network into account (e.g., divide by the number of resources). Using these metrics and a visual representation of the network one can analyze various aspects of the social structure of an organization. For example, one can search for densely connected clusters of resources and structural holes (i.e., areas with few connections), cf. (Burt and Minor, 1983; Scott, 1992; Wasserman and Faust, 1994).
Let us apply some of these notions to the sociogram shown in Figure 1 where the arcs indicate (unweighted) frequencies. The sociometric status of Clare is 3 (if we include self-links, otherwise 1), the sociometric status of Pete is 2, the emission of John is 2, the emission of Pete is 0, the reception of Pete is 2, the reception of Sue is 1, the determination degree of Mike is 0, etc. The Bavelas–Leavitt index of centrality of John is 4.33 while the same index for Sue is 3.25. The numbers are unweighted and in most cases these are made relative to allow for easy comparison. Tools like AGNA, Egonet, InFlow, KliqueFinder, MetaSight, NetForm, NetMiner, NetVis, StOCNET, UCI-NET, and Visone are just some of the many SNA tools available. For more information on SNA we refer to (Burt and Minor, 1983; Bernard et al., 1990; Scott, 1992; Wasserman and Faust, 1994).
3.2. DERIVING RELATIONS FROM EVENT LOGS
After showing the potential of SNA and the availability of techniques and tools, the main question is: How to derive meaningful sociograms from event logs? To address this question we identify differentmetrics. Each metric as-signs a weight Wi,j to the relationship between individualsi and j. IfWi,j is
above a certain thresholds, it will be included inR(i.e., (i, j)2Rif and only if Wi,j> s for anyi, j2P). This way we get a weighted graph (P,R, W) that
can be used by tools such as AGNA and NetMiner. In this paper, we will focus on four types of metrics that can be derived from event logs: (1) metrics based on (possible) causality, (2) metrics based on joint cases, (3) metrics based on joint activities, and (4) metrics based on special event types.
Metrics based on(possible)causalitymonitor for individual cases how work moves among performers. One of the examples of such a metric ishandover of work. Within a case (i.e., process instance) there is a handover of work from individualito individualjif there are two subsequent activities where the first is completed by i and the second byj. This notion can be refined in various ways. For example, knowledge of the process structure can be used to detect whether there is really a causal dependency between both activities. It is also possible to not only consider direct succession but also indirect succession using a ‘‘causality fall factor’’b, i.e., if there are three activities in-between an activity completed byiand an activity completed byj, the causality fall factor
is b3. A related metric is subcontractingwhere the main idea is to count the number of times individual j executed an activity in-between two activities executed by individual i. This may indicate that work was subcontracted from i toj. Again all kinds of refinements are possible.
Metrics based on joint casesignore causal dependencies but simply count how frequently two individuals are performing activities for the same case. If individuals work together on cases, they will have a stronger relation than individuals rarely working together.
Metrics based on joint activitiesdo not consider how individuals work to-gether on shared cases but focus on the activities they perform. The assumption here is that people doing similar things have stronger relations than people doing completely different things. Each individual has a ‘‘profile’’ based on how frequent they conduct specific activities. There are many ways to measure the ‘‘distance’’ between two profiles thus enabling many metrics. Metrics based on special event typesconsider the type of event. Thus far we assumed that events correspond to the execution of activities. However, there are also events like reassigning an activity from one individual to another. For example, ififrequently delegates work tojbut not vice versa it is likely thatiis in a hierarchical relation with j. From an SNA point of view these observa-tions are particularly interesting since they represent explicit power relaobserva-tions. The sociogram shown in Figure 1 is based on the causality metric hand-over of work. In the next section, we will define the metrics in more detail.
4. Metrics
In this section, we define the metrics we have developed to establish rela-tionships between individuals from event logs. We address all four types introduced in Section 3.2. Recall that each metric will assign a weightWi,jto
the relationship between individuals i and j. Before we define the various metrics in detail, we introduce a convenient notation for event logs.
Definition 4.1 (Event log). LetAbe a set of activities (i.e., atomic workflow/ process objects, also referred to as tasks) and P a set of performers (i.e., resources, individuals, or workers).E=A· Pis the set of (possible) events, i.e., combinations of an activity and a performer (e.g., (a, p) denotes the execution of activity a by performer p). C=E* is the set of possible event sequences (traces describing a case).L2 BðCÞis anevent log. Note thatBðCÞ is the set of all bags (multi-sets) over C.
Note that this definition of an event slightly differs from the informal notions used before. First of all, we abstract from additional information such as time stamps, data, etc. Secondly, we do not consider the ordering of events corresponding to different cases. For convenience, we define two operations on events: pa(e)=a andpp(e)=p for some evente=(a,p).
4.1. METRICS BASED ON(POSSIBLE) CAUSALITY
Metrics based on causality take into account both handover of work and subcontracting. The basic idea is that performers are related if there is a causal relation through the passing of a case from one performer to another. For both situations, three kinds of refinements are applied. First of all, one can differentiate with respect to the degree of causality, e.g., the length of handover. It means that we can consider not only direct succession but also indirect succession. Second, we can ignore multiple transfers within one in-stance or not. Third, we can consider arbitrary transfers of work or only consider those where there is a causal dependency (for the latter we need to know or be able to derive the process model). Based on these refinements, we derive 23=8 variants for both the handover of work and subcontracting metrics. These variants are all based on the same event log. Before defining the metrics, some of the basic notions that can be applied to a single case c=(c0, c1, . . .) are specified.
Definition 4.2. (.; .) LetLbe a log. Assume that!denotes some causality relation derived from the process model. For a1, a22 A, p1, p22P, c=(c0, c1,. . .)2L, andn2N: p1.ncp2¼ 90i<jcjnppðciÞ ¼p1^ppðciþnÞ ¼p2 jp1.ncp2j ¼ X 0i<jcjn 1 ifppðciÞ ¼p1^ppðciþnÞ ¼p2 0 otherwise p1.ncp2¼ 90i<jcjnppðciÞ ¼p1^ppðciþnÞ ¼p2^paðciÞ !paðciþnÞ jp1.ncp2j ¼ X 0i<jcjn 1 ifppðciÞ ¼p1^ppðciþnÞ ¼p2^paðciÞ !paðciþnÞ 0 otherwise
p1.ncp2denotes the function which returnstrueif within the context of casec
performers p1 and p2 both executed some activity such that the distance between these two activities is n. For example, for case 1 shown in Table I, John.1c Mikeequals 1 (i.e., true) andJohn.3c Peteequals 1 (i.e., true). In this definition, if the value of n equals 1, it refers to direct succession. If n is greater than 1, it refers to indirect succession. However, it ignores both multiple transfers within one instance and causal dependencies. jp1.ncp2j
denotes the function which returns the number of timesp1.ncp2in the casec.
In other words, it considers multiple transfers within one instance. p1.ncp2
and jp1.ncp2j are similar to p1.ncp2 and jp1.ncp2j but in addition they take
into account whether there is a real causal dependency. For example, con-sider case 1 shown in Table I. The order of events is: A (John), B (Mike), C (John), and D (Pete). If we calculate the relationships among activity B, C, and D,Mike.1c Johnequals 1 andMike.1c Peteequals 0. However,Mike.1c
activity conducted by John there is not a causal dependency between B and C because both activities are in parallel. However, there is causal dependency between activity B and D (see Figure 2) and, therefore,Mike.2
c Peteequals
1. The information on causality can be added if the process model is known. If necessary, this information can also be derived from the log by using for example the a-algorithm (Aalst et al., 2004).
Using such relations, we define handover of work metrics. Based on three kinds of refinements mentioned before, eight variants are derived as follows.
Definition 4.3 (Handover of work metrics). LetLbe a log. Forp1,p22Pand some b(0 < b< 1): p1.Lp2¼ X c2L jp1.1cp2j ! = X c2L jcj 1 ! p1._Lp2¼ X c2L^p1.1 cp2 1 0 @ 1 A=jLj p1.bLp2¼ X c2L X 1n<jcj bn1jp1.ncp2j 0 @ 1 A= X c2L X 1n<jcj bn1ðjcj nÞ 0 @ 1 A p1._bLp2¼ X c2L X 1n<jcj^p1.n cp2 bn1 0 @ 1 A= X c2L X 1n<jcj bn1 0 @ 1 A p1.Lp2¼ X c2L jp1.1cp2j ! = X c2L jcj 1 ! p1._Lp2¼ X c2L^p1.1 cp2 1 0 @ 1 A=jLj p1.bLp2¼ X c2L X 1n<jcj bn1jp1.ncp2j 0 @ 1 A= X c2L X 1n<jcj bn1ðjcj nÞ 0 @ 1 A p1._bLp2¼ X c2L X 1n<jcj^p1.n cp2 bn1 0 @ 1 A= X c2L X 1n<jcj bn1 0 @ 1 A
p1.Lp2means dividing the total number of direct successions fromp1top2in a process log by the maximum number of possible direct successions in the log. p1.L_ p2 ignores multiple transfers within one instance (i.e., case). For
example, in Table I, John.LMikeequals 2/14 andJohn.L_ Mikeequals 2/5. Note that metric .Ldefines a weight functionW, i.e.,p1.Lp2¼Wp1;p2 is the
weight of the link fromp1top2in the corresponding sociogram. As indicated before, a threshold may be used to remove links from the sociogram.
p1.bLp2 and p1._bLp2 deal with indirect succession by introducing a
events in-between two performers, the causality fall factor is bn: p1 .bL p2
considers all possible successions, while p1._bLp2 ignores multiple transfers
within one case. For example, in Table II, ifbequals 0.5, thenJohn.L Pete equals 2.5/19.5 and John.L_ Peteequals 2.5/8.5. If we use a bclose to 1, the effect of the distance between performers decreased. For example, suppose that only case 1 exists in Table I, we calculate the handover of metrics from John in Activity A to Mike, John in Activity B, and Pete, according to various values of b. Table II shows the results. If the value b increases in value, the variance of resulting values decreases.
The remaining four metrics p1.Lp2; p1._Lp2; p1.bLp2, and p1._bLp2 are
similar to the previous four kinds of metrics, but take into account real causal dependencies. For example, p1.Lp2 means that the total number of direct
successions from p1 to p2 in a log is divided by the maximum number of possible direct successions in the log when p1 and p2 are causally related. Note that each of the eighth metrics defines a different weight functionWand implicitly another sociogram.
From above definitions, we derive general formulations of the metrics. The eight metrics mentioned can be merged into the following four metrics.
Definition 4.4 (General forms of handover of work metrics). LetL be a log.
For p1, p22P, some b(0 <b £1) andk2N.
p1.b;Lkp2¼ X c2L X 1nminðjcj1;kÞ bn1jp1.ncp2j 0 @ 1 A , X c2L X 1nminðjcj1;kÞ bn1ðjcjnÞ 0 @ 1 A p1._b;Lkp2¼ X c2L X 1nminðjcj1;kÞ^p1.n cp2 bn1 0 @ 1 A , X c2L X 1nminðjcj1;kÞ bn1 0 @ 1 A p1.b;Lkp2¼ X c2L X 1nminðjcj1;kÞ bn1jp1.ncp2j 0 @ 1 A , X c2L X 1nminðjcj1;kÞ bn1ðjcjnÞ 0 @ 1 A p1._b;Lkp2¼ X c2L X 1nminðjcj1;kÞ^p1.n cp2 bn1 0 @ 1 A , X c2L X 1nminðjcj1;kÞ bn1 0 @ 1 A Table II. Handover of work metrics according to the causality fall factorb
Beta John.bL Mike John. b LJohn John. b Lpete 0.1 0.3116 (1/3.21) 0.0312 (0.1/3.21) 0.0031 (0.01/3.21) 0.5 0.2352 (1/4.25) 0.1176 (0.5/4.25) 0.0588 (0.25/4.25) 0.9 0.1783 (1/5.61) 0.1604 (0.9/5.61) 0.1444 (0.81/5.61)
In these alternative formulations, we introduce a ‘‘calculation depth factor’’ k. When we calculate metrics, kspecifies maximum degree of causality. For example, ifkequals 3, it considers the case of direct succession, one event in between two performers, and two events in-between two performers. Note that if b=1, k=1, then p1 .1L;1 p2¼p1.Lp2, and if k> max(|c|), then
p1.b;
k
L p2¼p1.bLp2. This rule is also applied to the other three metrics.
Further, when we calculate the metrics, a suitable value forkis important for the efficiency of calculation. Logs are typically very large. Therefore con-sidering all possible successions may be inefficient.
After defining metrics for handover of work we now consider another class of metrics based on (possible) causality:subcontracting metrics. In the case of subcontracting, the three refinements mentioned before can also be applied. However the concept of direct and indirect succession is changed. Direct succession means there is only one activity in-between two activities executed by one performer. While indirect succession means, there are multiple activities in-between two activities executed by one performer. We also introduce causality fall factorbfor indirect succession. For example, assume that there are four activities. Both the first and the fourth activity are exe-cuted by a performer i, while the second and third activity are executed by performer j andkrespectively. In this situation, we can derive two relations which are from a performer i to a performer j and from a performer i to a performer k. Again we use a causality fall factor b. The second and third refinements are the same as for handover of work. Before defining metrics, the basic notions applied to a single casec=(c0, c1, . . .) are specified.
Definition 4.5. (
; ) LetL be a log. Assume that fi denotes somecau-sality relation. In the context ofLand fi, we define a number of relations. For a1;a22A;p1;p22P;c¼ ðc0;c1;. . .Þ 2L;jcj>2;n2N, andn> 1: p1
ncp2¼ 90i<j<iþn<jcjppðciÞ ¼p1^ppðcjÞ ¼p2^ppðciþnÞ ¼p1 jp1ncp2j ¼ X 0i<jcjn X i<j<iþn 1 ifppðciÞ ¼p1^ppðcjÞ ¼p2^ ppðciþnÞ ¼p1 0 otherwise p1ncp2¼ 90<j<iþn<jcjppðciÞ ¼p1^ppðcjÞ ¼p2^ppðciþnÞ ¼p1^paðciÞ !paðcjÞ !paðciþnÞ jp1ncp2j ¼ X 0i<jcjn X i<j<iþn 1 if ppðciÞ ¼p1^ppðcjÞ ¼p2^ppðciþnÞ ¼p1 ^paðciÞ !paðcjÞ !paðciþnÞ 0 otherwise 8 < :p1
ncp2denotes the function which returns trueif performerp2executed an activity in-between two activities executed by performerp1and distance be-tween these two activities executed by performer p1 is n. For example, for case 1 shown in Table I, John 2c Mike equals 1. However, it ignores bothmultiple transfers within one instance and causal dependencies. |p1
cn p2| denotes the function which returns the number of timesp1cnp2in the case c. In other words, it considers multiple transfers within one instance.p1ncp2and jp1
ncp2j are similar top1 cnp2and |p1cn p2| but in addition they take into account whether there is a real causal dependency. For example, con-sider case 1 shown in Table I.Johnnc Mikeequals 0, because activity B and C do not have a causal dependency.Using such relations, we define subcontracting metrics. Again eight variants are identified.
Definition 4.6 (In-between metrics). Let L be a log. For p1, p22P, c=(c0, c1,. . .)2L, |c| > 2, and some b(0 <b < 1): p1
Lp2¼ X c2L jp12cp2j X c2L ðjcj 2Þ p1_Lp2¼ X c2L^p12 cp2 1 =jLj p1bLp2¼ P c2L P 2n<jcj bn2jp1ncp2j P c2L P 2n<jcj bn2ðjcj nÞðn1Þ p1_bLp2¼ X c2L X 2n<jcj^p1n cp2 bn2 X c2L X 2n<jcj bn2 p1Lp2¼ X c2L jp12cp2j X c2L ðjcj 2Þ p1_Lp2¼ X c2L^r12 cp2 1 =jLj p1bLp2¼ P c2L P 2n<jcj bn2jp1ncp2j P c2L P 2n<jcj bn2ðjcj nÞðn1Þ p1_bLp2¼ X c2L X 2n<jcj^p1n cp2 bn2 X c2L X 2n<jcj bn2p1
Lp2means dividing the total number of direct subcontracting occurrences betweenp1andp2in a process log by the maximum number of possible direct subcontracting occurrences in the log. p1_Lp2 ignores multiplesubcon-tracting occurrences within one instance (i.e., case). For example, in Table I, John
LMikeequals 2/9 andJohn_LMikeequals 2/5.p1Lbp2andp1_bLp2deal with the situation where the distance between these two activities exe-cuted by performerp1is greater than 2. Again we introduce a ‘‘causality fall factor’’bin a fashion similar to the handover of work metrics. If within the context of a case there are n events in-between two activities executed by the same performer, the causality fall factor isbn.p1
bLp2considers all possible subcontracting occurrences, while p1_bLp2 ignores multiple subcontractingwithin one case. For example, in Table II, ifbequals 0.5, thenJohn
LMikeequals 2/13 and John.L_ Mikeequals 2/7. Again p1
L
p2;p1L
_ p2;p1bLp2,and p1
_b
example,p1
L
p2means that the total number of direct subcontracting from p1top2in a process log is divided by the maximum number of possible direct subcontracting in the log whenp1 andp2are causally related.As before we can derive more general formulations for the metrics. The eight metrics mentioned above can be merged into four metrics as shown in the following definition.
Definition 4.7 (General forms of in-between metrics). LetLbe a log. Forp1, p22P, someb (0 <b £1) andk2Nðk>1Þ p1
b;Lkp2¼ P c2L P 2nminðjcj1;kÞ bn2jp1ncp2j = P c2L P 2nminðjcj1;kÞ bn2ðjcjnÞðn1Þ p1_b;Lkp2¼ P c2L P 2nminðjcj1;kÞ^p1n cp2 bn2 = P c2L P 2nminðjcj1;kÞ bn2 p1b;Lkp2¼ P c2L P 2nminðjcj1;kÞ bn2jp1ncp2j = P c2L P 2nminðjcj1;kÞ bn2ðjcjnÞðn1Þ p1_ b;k L p2¼ P c2L P 2nminðjcj1;kÞ^p1n cp2 bn2 = P c2L P 2nminðjcj1;kÞ bn2Again we also introduce a ‘‘calculation depth factor’’k. When calculating the metrics,kspecifies maximum distance between two activities executed by one performer. For example, ifkequals 3, it considers the case of one activity in between two activities executed by one performer and two activities in be-tween two activities executed by one performer. Note that ifb=1,k=2, then p1
1,2L p2=p1 L p2, and ifk> max(|c|), thenp1 bL,kp2=p1 bLp2.4.2. METRICS BASED ON JOINT CASES
For this type of metrics we ignore causal dependencies and simply count how often two individuals are performing activities for the same case.
Definition 4.8 (Working together metrics). Let L be a log. For
p1;p22P:p1fflLp2¼Pc2Lp1fflcp2=Pc2Lgðc;p1Þ if Pc2L g(c, p1) „ 0, otherwise p1fflLp2¼0, where for c¼ ðc0;c1;. . .Þ 2L:p1fflcp2¼1 if 90i;j<jcj^i6¼jppðciÞ ¼p1^ppðcjÞ ¼p2, otherwise p1fflcp2¼0:gðc;p1Þ ¼1 if 90i<jcjppðciÞ ¼p1, otherwiseg(c, p1)=0
Note that in this definition we divide the number of joint cases by the number of cases in which p1 appeared. It is important to use a relative notation. For example, suppose thatp1 participates in three cases,p2 partic-ipates in six cases, and they work together three times. In this situation, p1 always work together with p2, butp2does not. Thus, the value for p1fflLp2
has to be larger than the value forp2fflLp1. Let us apply this metric to analyze
the relationship between John and Pete based in the log shown in Table I. In the log, John appeared in two cases, Pete in four cases, and they work together on two cases. Thus,JohnfflLPete= 2/2 andPetefflLJohn= 2/4.
Moreover, alternative metrics can be composed by taking the distance between activities into account, e.g., use variants likeðp1BbLp2þp2B
b Lp1Þ=2
or ðp1B_bLp2þp2B_bLp1Þ=2.
4.3. METRICS BASED ON JOINT ACTIVITIES
To calculate the metrics based on joint activities, first we make a ‘‘profile’’ based on how frequent individuals conduct specific activities. In this paper, we use aperformer by activity matrix to represent these profiles. This matrix simply records how frequent each performer executes specific activities.
Definition 4.9. (n) LetLbe a log. Forp12P,a12A, andc=(c0,c1,. . .)2L:
p14ca1¼ X 0i<jcj 1 ifpaðciÞ ¼a1^ppðciÞ ¼p1 0 otherwise p14La1¼ X c2L p14ca1
Note that n defines a matrix with rowsP and columns A. Table III shows
the performer by activity matrix derived from Table I.
After creating the matrix, we measure the distance between two performers by comparing the corresponding row vectors. A simple distance measure is Minkowski distance which can be seen as a generalization of the Euclidean distance. But the Minkowski distance only gives good results if performers execute comparable volumes of work. Therefore, we also use the Hamming distancewhich does not consider the absolute frequency but only whether it is 0 or not. Another metric is Pearson’s correlation coefficient which is fre-quently used to find the relationship among cases.
Table III. The performer by activity matrix
Performer Activity A Activity B Activity C Activity D Activity E
John 2 1 1 0 0 Sue 3 1 1 0 0 Mike 0 1 1 0 0 Carol 0 1 1 0 0 Pete 0 0 0 4 0 Clare 0 0 0 1 1
Definition 4.10. ð4MDL ;n;4HD
L ;4PCL Þ LetLbe a log and nLbe a performer
by activity matrix. For p1, p22P, n2{1,2,3,. . .}:
p14MDL ;np2¼ X a2A jðp14LaÞ ðp24LaÞjn 1=n p14HDL p2¼ X a2A dðp14La;p24LaÞ =jAj wheredðx;yÞ ¼ 0 ifðx>0^y>0Þ _ ðx¼y¼0Þ 1 otherwise p14PCL p2¼ P a2Aðððp14LaÞ XÞððp24LaÞ YÞÞ= ffiffiffiffiffiffiffiffiffiffiffiffiffiffiffiffiffiffiffiffiffiffiffiffiffiffiffiffiffiffiffiffiffiffiffiffiffiffiffiffiffiffiffiffiffiffiffiffiffiffiffiffiffiffiffiffiffiffiffiffiffiffiffiffiffiffiffiffiffiffiffiffiffiffiffiffiffiffiffiffiffiffiffiffiffi P a2Aððp14LaÞ XÞPa2Aððp24LaÞ YÞ q whereX¼X a2A ðp14LaÞ=jAj; Y¼ X a2A ðp24LaÞ=jAj
The Minkowski distance nMDL ,nhas a parameter n: n = 1 is the Rectilinear
distance also referred to as Manhattan distance, n=2 is the Euclidean distance, and for large values of n the metric approximates the Chebyshev distance. The Hamming distancenHDL does not have a parameter but could
be extended with some threshold value. In the case of Pearson’s correlation coefficient, the result ranges from +1 to)1. A correlation of +1 means that there is a perfect positive linear relationship between variables. A correlation of )1 means that there is a maximal negative linear relationship between variables. In other words, if the distance between performers is small, the correlation is closer to 1, if it is large, the correlation is closer to )1.
To illustrate the limitations of simple metrics like the Minkowski distance we consider Table III. Clearly, from an intuitive point of view the distance between Sue and Carol should be smaller than the distance between Carol and Clare because Carol and Clare have no activities in common. The Minkowski distance (n=1) between Sue and Carol equals 3 and the distance between Carol and Clare equals 4. However, if Sue would have executed activity B and activity C also three times, the distance between Sue and Carol would be 7 and thus incorrectly suggest that Carol is closer to Clare than to Sue. The Hamming distance is more robust and would indicate in both cases that Carol is closer to Sue: Sue nHDL Carol equals 1/5 and CarolnHDL Clare
equals 4/5. If we calculate the Pearson’s correlation coefficient,SuenPCL Carol
equals 0.2182 and Carol nPCL Clare equals )0.6667. Hence, the result of
Pearson’s correlation leads to the same conclusion as the Hamming distance. Note that if the volume of work varies significantly, the metrics are not suitable. For example, it is difficult to compare the profile of a part-time worker with a full-time worker. Thus, in some cases we first apply the logk (X+1)
function on the values of the performer by activity matrix, i.e., use a loga-rithmic scale fornL. Note that we need to add ‘‘+1’’ to avoid negative values.
4.4. METRICS BASED ON SPECIAL EVENT TYPES
The types of metrics mentioned in previous subsections do not consider event types. They more or less assume that all events correspond to the completion of an activity. But events can contain various event types such as schedule, assign, withdraw, reassign, start, suspend, resume, pi_abort, ate_ abort, com-plete, autoskip, manualskip, and unknown.4For example,schedulerefers to the enabling of a task for a specific case,assignrefers to the allocation of such an enabled task to a user, startrefers to the actual start of a task, andcomplete refers to the completion of a task. Event types such as withdraw, reassign, suspend, resume, pi_abort, and ate_abortmay refer to exceptions which are interesting from the viewpoint of SNA. See (Aalst et al., 2003) for some more information on the various event types.
In this subsection, we take into account metrics based on special event types. In particular, we concentrate on the reassign event type. To define metrics based on special event types, we suppose that log lines have an event type. For convenience, we define an operation on events:pet(e) = event type
for some event e=(a, p). Note that Definition 4.1 could be extended to capture event types such as used by commercial systems. In the next section we define an XML format to capture this information.
Before defining metrics, the basic notations used for a single case c=(c0,c1,. . .) are specified as follows.
Definition 4.11 ( follow;5). Let L be a log. For p1, p22P, c=(c0, c1,
. . .)2L, and some event typeevent type:
followðc;i;jÞ ¼paðciÞ ¼paðcjÞ ^ 8i<k<jpaðckÞ 6¼paðciÞ; for 0i<j<jcj p15event typec p2¼ 9oi<j<jcjfollowðc;i;jÞ ^ppðciÞ ¼p1^ petðciÞ ¼event type^ppðcjÞ ¼p2 jp15event typec p2j ¼ X 0i<jcj 1 if9i<j<jcjfollowðc;i;jÞ ^ppðciÞ ¼p1 ^petðciÞ ¼event type^ppðcjÞ ¼p2 0 otherwise 8 > < > :
In a log, there may be several events that correspond to the same activity. If the activityais reassigned from a performerp1to a performerp2, we can find two events ciand cjsuch that ci=(a, p1),pet(ci)=ÔreassignÕ, cj =(a, p2), and pet(cj) is some event type. Thus, we needfollowto find a next event which is
related toci.p15event typec p2 denotes the function which returns true if within
the context of the casecperformersp1andp2both executed the same activity andp1was responsible for a specific type of event andp2is the first performer of some event for the same activity. jp15event typec p2j denotes the function
which returns the number of times p15event typec p2 in the case c. Using such
relations, we define reassignment metrics. Recall that reassign is a special event type corresponding to the delegation from one performer to another.
Definition 4.12 (Reassignment metrics). LetLbe a log. For p1, p22P: p15‘Lreassign’p2¼ ðP c2L jp15‘creassign’p2jÞ=ðP c2L ðjcj 1ÞÞ p15_‘Lreassign’p2¼ ð P c2L^p15‘reassign’ c p2 1Þ=jLj
p15‘Lreassign’p2is obtained by dividing the total number of reassignments from p1top2in the event log by the maximum number of reassignments in the log. For example, if there are 10 events in a log and John has reassigned an activity to Mikeonce, John 5‘Lreassign’ Mikeequals 1/9. p15_‘reassign’p2 ignores
multiple reassignment within one instance.
In this section, we formalized the metrics introduced in Section 3.2. It is important to note that each of the metrics is derived from some logLand the result can be represented in terms of a weighted graph (P,R,W), where P is the set of performers,Ris the set of relations, andWis a function indicating the weight of each relation (see Section 3.1). For example, the basic hand-over of work metric .L defines R¼ fðp1;p2Þ 2PPjp1.Lp26¼0g
andWðp1;p2Þ ¼p1.Lp2. For the Hamming distanceR={(p1,p2)2P·P|p1
nHDLp2 „ 1} andW(p1,p2)=1) (p1 nHDL p2). For the Pearson’s correlation
coefficient R={(p1, p2)2P · P | p1 nLPCp2 ‡a} (where a is some threshold value between )1 and 1) and W(p1, p2)=(1+(p1nPCL p2))/2. In other words, given an event logLeach metric results in a sociogram that can be analyzed using existing SNA tools.
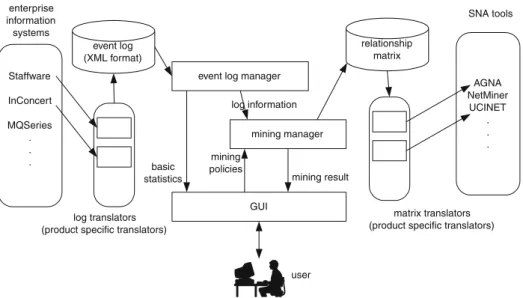
Staffware InConcert MQSeries . . . event log (XML format)
event log manager
mining manager GUI AGNA NetMiner UCINET . . . SNA tools matrix translators (product specific translators) log translators
(product specific translators)
relationship matrix enterprise information systems basic statistics log information mining policies mining result user
5. MiSoN
This section introduces our toolMiSoN (Mining Social Networks). MiSoN has been developed to discover relationships between individuals from a range of enterprise information systems including workflow management systems such as Staffware, InConcert, and MQSeries, ERP systems, and CRM systems. Based on the event logs extracted from these systems MiSoN constructs soci-ograms that can be used as a starting point for SNA. The derived relationships can be exported in a matrix format and used by most SNA tools. With such tools, we can apply several techniques to analyze social networks, e.g., find interaction patterns, evaluate the role of an individual in an organization, etc. MiSoN has been developed using Java including XML-based libraries such as JAXB and JDOM, and provides an easy-to-use graphical user interface. Figure 3 shows the architecture of MiSoN. The mining starts from a tool-independent XML format which includes information about processes, cases, activities, event times, and performers. From enterprise information systems recording event logs, we can export to this XML format.
Figure 4 shows the XML schema describing this format. It is an extension of the DTD suggested in (Aalst et al., 2003). The schema has the Work-flowLogelement as a root element. It hasData, Source, andProcesselements. The Sourceelement contains the information about software or system that was used to record the log (e.g., Staffware). The Processelement represents the process where the process log belongs. Note that there may be multiple Process elements in a log. EachProcess element may hold multipleProcess Instance elements that correspond to cases. The AuditTrailEntry element represents a log line, i.e., a single event. It contains WorkflowModelElement, EventType, Timestamp, and Originator elements. For SNA, the Workflow-ModelElement, EventType, andOriginatorelements are most important. The WorkflowModelElement refers to the activity (or subprocess) the event cor-responds to. TheEventTypespecifies the type of the event, e.g.,schedule(i.e., a task becomes enabled for a specific instance),assign(i.e., a task instance is assigned to a user), start (the beginning of a task instance), complete (the
completion of a task instance), andreassign (as discussed in Section 4.4). In total, we identify 12 events. Last but not least theOriginatorelement refers to the performer. To make the format more expressive, we define the Data element and other elements have it as a sub tags. If users want to specify more information than the basic elements, they can record the additional infor-mation using theDataelement. Such information can be used for other types of process mining such as performance analysis, process knowledge extrac-tion, etc.
After reading an event log that conforms to the XML schema, MiSoN provides functionalities for displaying user statistics and event log statistics. Using the metrics defined in Section 4, MiSoN constructs relationships be-tween individuals. When calculating the relationships, the user can select suitable metrics and set relevant options. The result can be displayed using a matrix representation and a graph representation, but it can also be exported to SNA tools. Exported data contains the number of performers, names of performers, and a relationship matrix.
To illustrate MiSoN we have used an event log as generated with Staff-ware, which was converted to the XML format. For this log, we only con-sider the ‘‘released by’’ event type to make sociograms. This event corresponds to thecompleteevent type in our XML format. We have tested MiSoN with several metrics mentioned in the previous section. Figure 5
shows a screenshot of MiSoN when displaying the mining result of handover of work metrics.
MiSoN can export the mining result using the AGNA-translator (but also other tools like UCINET and NetMiner). AGNA (cf. http://www.geoci-ties.com/imbenta/agna/) is an SNA tool that allows for a wide variety of sociometric analysis techniques. For example, AGNA supports various no-tions of centrality including the Bavelas–Leavitt index described in Section 3.1. John and Sue have the highest Bavelas–Leavitt index (the value is 4.2), while Clare has the smallest value (2.8). Figure 6 shows the analysis using the tool AGNA. It also shows the network structure of result.
MiSoN can also export the mining result to other SNA tools like UCINET (cf. http://www.analytictech.com) and NetMiner (cf. http://www.netmin-er.com). In fact, in the case study described in the next section we will mainly use NetMiner to analyze the social network.
6. Case study
6.1. CONTEXT
To demonstrate how our metrics can be applied to real workflow logs and what kinds of analysis can be performed, we employed real workflow log data and carried out a case study. The case study we describe here involved one of the twelve provincial offices of the Dutch national public works department, employing about 1000 civil servants. For reasons of confiden-tiality, we cannot disclose the name of this specific office.
The office’s primary responsibility is the construction and maintenance of the road and water infrastructure within its provincial borders. For this purpose, it subcontracts various parties such as road construction companies, cleaning companies, and environmental agencies. Also, the provincial office purchases services and products to support its construction and maintenance activities on the one hand (e.g., mechanical tools, fuel, and traffic signs) and its administrative activities on the other (e.g., office supplies).
The process we dealt with concerns the handling of invoices, as received by the provincial office in question. In general, the handling of an invoice in-volves several validation steps and, if the invoice is approved, it is completed by payment. On a yearly basis, the provincial office processes some 20,000 invoices from its various subcontractors and suppliers.
The provincial office has implemented its own proprietary workflow management system to support the processing of invoices. This system re-cords transaction information between activities. We extracted a process log and analyzed it. Since the extracted data are also stored in a relational database, we first developed a translator which converts the process log in the database to an XML file using the format described in the previous section. The process consists of 17 real activities, aside from logistic steps and splits. The log data contains 4,988 cases. The number of total log lines (i.e., events) is 33,603 and 43 employees participated in the process execution. The log holds no information about reassignments. Hence, we cannot apply the reassignment metrics presented in Section 4.4. However, all other metrics we discussed in Section 4 have been applied in this case study.
6.2. METRICS APPLICATION
We applied our metrics to the log data and derived several social networks. Moreover, by applying several SNA techniques, we tried to find the char-acteristics of the social network.
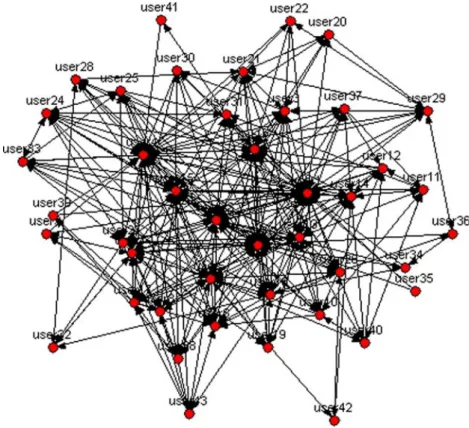
Figure 7 shows a social network which was derived by applying the handover of work metrics. The network represents how cases are transferred among performers. As indicated in Section 4, there are three refinements possible for the handover of work metrics. To generate this network, we take
into account direct succession and multiple transfers in a case, but we ignore the real process structure, i.e., we use the metricBLintroduced in Definition
4.3. The network has 43 nodes and 406 links. The density of the network is 0.225 and it has no isolated nodes.
Figure 7. Social network based on the handover of work metricBL.
Table IV. Performers having high values for (1) betweenness, (2) in-closeness, (3) outclose-ness, and (4) power when analyzing the social network shown in Figure 7 Ranking Name Betweenness Name In-closeness Name Out-closeness Name Power 1 user1 0.152 user1 0.792 user23 0.678 user4 4.102 2 user4 0.141 user4 0.792 user1 0.667 user1 2.424 3 user23 0.085 user16 0.75 user4 0.656 user30 1.964 4 user5 0.079 user23 0.689 user5 0.635 user17 1.957 5 user16 0.065 user2 0.667 user13 0.625 user7 1.774 6 user13 0.057 user15 0.618 user18 0.616 user8 1.394 7 user18 0.052 user5 0.609 user2 0.606 user2 1.347 8 user2 0.049 user7 0.592 user16 0.58 user23 1.098 9 user7 0.04 user13 0.568 user7 0.572 user16 1.058 10 user31 0.029 user18 0.568 user17 0.556 user18 0.581
In order to find people who are located in the center of the network, we calculate several centrality values such as betweenness, in and out closeness, and power (Bonacich, 1987) of each node. Normally, the nodes which are the most central have a powerful position in the network. Table IV shows the top 10 ranked performers among the people involved based on (1) betweenness (i.e., the extent to which a node lies between all other pair of nodes on their geodesic paths), (2)in-closeness(i.e., the inverse of the sum of distances from all the other nodes to a given node, which is then normalized by multiplying it by the number of nodes minus 1), (3) out-closeness (i.e., the normalized inverse of the sum of distances from a node to all the other nodes), and (4) power(i.e., Bonacich’s metric based on the principle that nodes connected to
Table V. Summary of arc weights for various values ofb
Beta Sum Average Standard deviation Minimum value Maximum value
0.1 1.000025 0.000541 0.003269 0 0.086734
0.3 1.000091 0.000541 0.002895 0 0.074274
0.5 1.000001 0.000541 0.002631 0 0.065751
0.7 1.000011 0.000541 0.002522 0 0.063232
0.9 0.999979 0.000541 0.002586 0 0.067214
powerful nodes are also powerful (Bonacich, 1987)). In this table, we find thatuser 1anduser 4have larger values than others in most measurements.5 When generating a social network related to the handover of metrics, we can also consider indirect succession using a ‘‘causality fall factor’’ b. By applying various values ofb, we generate several social networks. Despite the value ofb, the derived networks have the same structure except the weight of arcs. Table V shows the sum, average, standard deviation, minimum value, and maximum value of the arc weights based on different values ofb. If we use a smallb, the value of arcs between performers who have the relationship
Table VI. A list of people having a high degree of in-/out-closeness based on the subcon-tracting network shown in Figure 8
Ranking Name In-closeness Name Out-closeness
1 user4 0.262 user4 0.262 2 user1 0.214 user1 0.214 3 user16 0.214 user7 0.167 4 user18 0.19 user13 0.143 5 user5 0.167 user5 0.167 6 user7 0.167 user16 0.214 7 user13 0.143 user18 0.19 8 user19 0.143 user14 0.095 9 user10 0.119 user23 0.119 10 user17 0.119 user27 0.119
Figure 9. Social network based on the working together metric (left) and the ego net-work ofuser41(right).
of direct succession is larger than between others. However, if we use a large value of b, these differences decrease.
To find subcontracting relationships between people, we apply in-between metrics. Figure 8 shows the resulting social network. The network has 43 nodes and 146 links. The density of the network is 0.081 and eight nodes are isolated from the network. In this network, the direction of arcs is important. The start node of an arc represents a contractor, while the end node of an arc represents a subcontractor. Table VI shows the ten people of highest in-degree and in-degree of centrality (based on the in-closeness and out-closeness calculated by NetMiner).
Figure 9 shows the social network derived by applying the working to-gether metrics and the ego network (Mitchell, 1969) corresponding touser41. In the ego network, the nodes represent the people working together with user41 according to this metric. Note thatuser41 works together withuser1, user4, user23, user26, and user31. The average size of ego network of the generated network is 24.698 and the standard deviation of this value is 9.709.
Figure 10. Social network derived from Pearson’s correlation coefficient (threshold value 0.75).
This means that the social network suggests that an employee on average works with 24 people.
Applying the metrics based on joint activities, we calculate the distance between people. Figure 10 shows the social network which is derived by applying Pearson’s correlation coefficient. From the performer by task ma-trix, we first apply log10(x+1), then calculate the distances between people. We get 5 clusters and two isolated nodes. The nodes in the same cluster play the same role. In this case, the bridge node can be interpreted as a person who has multiple roles. In the network, user8, user28, user37, and user43 have multiple roles.
Finally, we explore how cases are transferred among groups. To calculate case transfers among groups, we combine the handover of work metrics with a role model. In this case study, we use the results of correspondence analysis (Clausen, 1998) as a role model of performers. (Of course, we can also use the results of the metrics based on joint activities.) Correspondence analysis is frequently used in biological science to analyze ecological systems based on species scores for specific locations (Gauch, 1982). In this paper, we apply correspondence analysis to find relationships between activities and per-formers. We first make a performer by activity matrix from the workflow logs. Then, by applying correspondence analysis to the matrix, we derive the relationship between activities, between performers, and between activities and performers. Figure 11 shows the graphical result of applying corre-spondence analysis. In the figure, boxes represent activities and circles
resents performers. Closely positioned nodes indicate a strong correspondence from a work handover perspective between the respective users and/or tasks. (Although the distance between user nodes and task nodes should not be interpreted as an absolute measure.) From this figure, performers and activ-ities are classified into five groups. Table VII shows the results. In the remainder we will use these five groups as a role model.
Figure 12(a) shows the social network of handover of work metrics con-sidering the role model given in Table VII. By putting the nodes in the same group closely, we have reconstructed the original network. And by summing Table VII. The result of correspondence analysis: users are clustered into five groups
Group Performers Activities
group1 user1, user2, user4, user16, user23, user30, user35 task2, task3, task15, task21, task22 group2 user3, user24, user25, user40
group3 user5, user13, user32, user43 task8, task19 group4 user6, user8, user9,user12, user15, user22, user31,
user39, user41
task18
group5 user7, user10, user11, user14, user17, user18, user19, user20, user21, user26, user27, user28, user29, user33, user34, user36, user37, user38, user42
task5, task7, task11, task13, task16, task17, task20
Figure 12. Social network based on handover of work metric using the five groups shown in Table VII.