Effects of Using Composite Core on Relative Permeability Tests
by
Munirah binti Zaliran 14774
Dissertation submitted in partial fulfilment of the requirements for the
Bachelor of Engineering (Hons) (Petroleum)
JANUARY 2015
Universiti Teknologi PETRONAS 32610 Bandar Seri Iskandar Perak Darul Ridzuan
CERTIFICATION OF APPROVAL
Effects of Using Composite Core on Relative Permeability Tests
by
Munirah binti Zaliran 14774
A project dissertation submitted to the Petroleum Engineering Programme
Universiti Teknologi PETRONAS in partial fulfilment of the requirement for the
BACHELOR OF ENGINEERING (Hons) (PETROLEUM)
Approved by,
______________________ (Dr. Mohammed Idrees Ali)
UNIVERSITI TEKNOLOGI PETRONAS BANDAR SERI ISKANDAR, PERAK
CERTIFICATION OF ORIGINALITY
This is to certify that I am responsible for the work submitted in this project, that the original work is my own except as specified in the references and acknowledgements, and that the original work contained herein have not been undertaken or done by unspecified sources or persons.
_________________________ MUNIRAH BINTI ZALIRAN
ABSTRACT
This project entitled The Effects of Composite Core on relative Permeability Tests. Relative permeability test in this project is a Special Core Analysis in order to determine the relative permeability of the core plug. Relative permeability is the ratio of effective permeability of fluid at certain saturation to absolute permeability of fluid at total saturation. Composite core consist of several cores that put together during relative permeability test. It will focus on the usage of composite core during the tests to differentiate the value of relative permeability that obtain between single core and composite core. In addition, the arrangements for each single core in composite core also give effects on relative permeability tests. Unsteady state method will be used in order to determine the relative permeability value. The calculation adopted from Johnson, Bossler and Naumann (JBN) method. The experiment conducted in the laboratory by using Benchtop Permeability System. This project importance is to determine the relative permeability by using composite core because in the real reservoir, it is consists of different types of rock that have different value of relative permeability. Hence, the usage of composite core in relative permeability tests can describe the real situations of reservoir.
ACKNOWLEDGEMENT
First and foremost, gratitude to Almighty for His blessings that made all things possible throughout Final Year Project I and II. A particular note of thanks is given to Dr Mohammed Idrees Ali, the project supervisor who never refuses to offer assistance, guidance, supports and ideas throughout the study.
The author would also like to express my appreciation to Mdm. Helmayeni, a lab technologist of Core Analysis laboratory who have been undeniably helpful towards the project completion.
Last but not least, not to exclude, a million of thanks for the author’s parents; Mr. Zaliran bin Darus and Mdm. Rohani binti Ishak for the inspirations and endless support through the thick and thin for all this while. Not to be forgotten, gratitude to the author’s fellow colleagues, and to those who has contributed directly or indirectly towards accomplishing the objectives of this Final Year project.
TABLE OF CONTENTS
CHAPTER 1: INTRODUCTION 1.1 Project Background ...1 1.2 Problem Statement ...2 1.3 Objective ...3 1.4 Scope of Study...4CHAPTER 2: LITERATURE REVIEW 2.1 Relative Permeability Concept ...5
2.1.1 Two-phase Relative Permeability ………...8
2.1.2 Drainage and Imbibition Process ………9
2.1.3 Johnson, Bossler and Naumann (JBN) method ………11
2.2 Composite Core ...13
CHAPTER 3: METHODOLOGY 3.1 Summary of Project Flow ………14
3.1.1. Summary of Project Flow of FYP1 ……….…………15
3.1.2. Summary of Project Flow of FYP2 ……….…………16
3.2 Material and Equipment ………...17
3.2.1 Material and Description ………...17
3.2.2 Equipment and Function ………...18
3.3 Theory: Johnson, Bossler and Naumann (JBN) method ………..21
3.4 Gantt Chart ………...26
3.4.1 Timeline for FYP ………..26
3.4.2 Timeline for FYP 2 ………...27
3.5 Key Milestones ………28
3.6 Experiment Procedure ………..29
CHAPTER 4: RESULTS AND DISCUSSION 4.1 Final Year Project 1 ……….32
4.2 Final Year Project 2 ……….34
4.2.2 Water Saturation of Sample Cores ………37
4.2.3 Determination of Brine Average Permeability ……….39
4.2.4 Viscosity of Mineral Oil ………...43
4.2.5 Relative Permeability of Single Core ………...46
4.2.6 Relative Permeability of Composite Core ………49
CHAPTER 5: CONCLUSION AND RECOMMENDATION 5.1 Project Conclusion ………...50
5.2 Recommendation ……….51
REFERENCES ...52
LIST OF FIGURE
Figure 1: Steady state Waterflood Procedure ………..………6
Figure 2: Unsteady State Waterflood Procedure ……….7
Figure 3: Typical Two-phase Flow Behaviour ………9
Figure 4: Hysteresis effects in relative permeability ……….10
Figure 5: Summary of Project Flow FYP1 ………15
Figure 6: Summary of Project Flow FYP 2 ………..………...16
Figure 7: Key Milestones of FYP 2 ...28
Figure 8: Procedure of Laboratory Experiment ……….29
Figure 9: Three core plugs named as L2, M1 and M5 ………...32
Figure 10: Effect of grain size and sorting on permeability ………..33
Figure 11: Graph of Porosity versus Confining Pressure ………..34
Figure 12: The saturation process of core plug ………..36
Figure 13: Plot of Delta P versus Time for M5 core plug ……….38
Figure 14: Plot of Permeability versus Time for M5 core plug ……….38
Figure 15: Graph of Flowrate versus Pressure Gradient of L2 core ...39
Figure 16: Darcy’s Law equation with their units ...40
Figure 17: Relationship between Shear Stress and Shear Rate ………..41
Figure 18: 100 Z283 series glass ………...42
Figure 19: 200 49B series glass ……….42
Figure 20: Drainage of M5 single core shows Graph of Delta P versus Time ……..45
Figure 21: Drainage of M5 single core shows Graph of Permeability versus Time ..45
Figure 22: Graph of Relative Permeability versus Water Saturation for Single Core Drainage ……….46
Figure 23: Imbibition of M5 single core shows Graph of Delta P versus Time ……47
Figure 24: Imbibition of M5 single core shows Graph of Permeability versus Time ……….47
Figure 25: Graph of Relative Permeability versus Water Saturation for Single Core Imbibition ………...48
Figure 26: Graph of Relative Permeability versus Water Saturation for Single Core Drainage and Imbibition ………48 Figure 27: Drainage of decreasing composite core shows Graph of Delta P versus Time ………...49 Figure 28: Drainage of decreasing composite core shows Graph of Permeability versus Time ………49 Figure 29: Graph of Relative Permeability versus Water Saturation for Composite Core Drainage Decreasing Permeability ………50 Figure 30: Imbibition of decreasing composite core shows Graph of Permeability versus Time ………50 Figure 31: Imbibition of decreasing composite core shows Graph of Permeability versus Time ………51 Figure 32: Graph of Relative Permeability versus Water Saturation for Composite Core Imbibition Decreasing Permeability ……….51 Figure 33: Graph of Relative Permeability versus Water Saturation for Composite Core Drainage & Imbibition Decreasing Permeability ………..52 Figure 34: Drainage of increasing composite core shows Graph of Permeability versus Time ………52 Figure 35: Drainage of increasing composite core shows Graph of Permeability versus Time ………53 Figure 36: Graph of Relative Permeability versus Water Saturation for Composite Core Drainage Increasing Permeability ……….53 Figure 37: Graph of Relative Permeability versus Water Saturation for Single and Composite Core in Drainage process ……….54 Figure 38: Graph of Relative Permeability versus Water Saturation for Single and Composite Core in Imbibition process ………..54 Figure 39: Graph of Relative Permeability versus Water Saturation for Composite Core in Drainage process ………...55 Figure 40: Graph of Flowrate versus Pressure Gradient of M1 core ……….61 Figure 41: Graph of Flowrate versus Pressure Gradient of M5 core ...62
LIST OF TABLE
Table 1: Differences between oil-wet and water-wet ………11
Table 2: Material Used and Description ………17
Table 3: Equipment Used and Function ……….18
Table 4: Gantt chart of FYP 1 ………26
Table 5: Gantt chart of FYP 2 ………27
Table 6: Porosity and Permeability of L2, M1 and M5 core plugs ………34
Table 8: Summary of brine volume and water saturation ………..37
Table 9: Brine Average Permeability for L2, M1 and M5 cores ...41
Table 10: Value of Kinematic and Dynamic Viscosity ……….43 Table 11: Summary of Relative Permeability of Single Core and Composite Core .56
1
CHAPTER 1
INTRODUCTION
1.1 Project Background
This project entitled ‘Effect of Using Composite Core on Relative Permeability Tests’. This project undergone numerous studies such as through previous research papers, website searching and reading books and journals. This project has been conducted in the laboratory as the result only will be known after several laboratory procedures including measurement, conducting experiments and result analysis. Relative permeability is the ratio of the effective permeability of the phase to the absolute permeability if there is two or more fluids flow at the same time. In this project the fluids are mineral oil and brine water.
The factors that affecting relative permeability in terms of physical parameters are fluid saturations, wettability, capillary end effect, saturation history (hysteresis effects), physical rock properties, overburden stress, clay and fines content, viscosity, temperature, magnitude of initial phase saturations, interfacial tension, immobile or trapped phase and displacement rates and capillary outlet phenomena (Bennion et al., 1991).
Composite core is the individual cores that put together in relative permeability tests. In this study, minimum of three single cores of different permeability will be used. The reasons on why we use composite core because there is limitation in core plug. Single core usually associated with capillary end effects problem. Capillary end effect is discontinuity of capillary in the wetting phase at the outlet end of the core sample. It will give effect on saturation and relative permeability measurement. Maximum length of core that can be used during the experiment in the laboratory is 3 inches. This is because the equipment that is provided in the laboratory called as Benchtop Permeability System (BPS) only can afford 3 inches length of core. In addition, the usage of composite core will also overcome capillary end effect. This is because the capillary end effect value is negligible by using JBN calculation method.
2 1.2 Problem Statement
Relative permeability test is Special Core Analysis (SCAL) that used for reservoir simulation to determine reservoir behaviour. Among the tests that involved in measuring relative permeability, composite core usage is one of the procedures that give effect on the value of relative permeability.
The first problem statement is the limitation of using long core plug that can recover capillary end effect. The equipment in the laboratory only can accommodate 3 inches long core plug. This is called as limitation of equipment. Instead of using long core plug, composite core were used. There are differences between using single core and composite core in terms of relative permeability value that will be obtained.
The second problem statement is result of ordering in composite core during relative permeability tests. There are two permeabilities ordering of single cores has been conducted during the studies which are ascending order and descending order.
3 1.3 Objective
There are two objectives of this project:
1. To determine the effect of discontinuity in capillary in composite core on the result of relative permeability test.
2. To investigate the effect of ordering of single core with different permeabilities in composite core in relative permeability tests.
For the first objective, the comparison in relative permeability value will be determined between the usage of single core and composite core. In addition, this project has determined on which ordering of individual cores in composite core that give the most similar value with single core. There are three types of single core ordering which are; ascending, descending and Huppler’s ordering. However, due to time constraint only ascending and descending ordering was conducted.
4 1.4 Scope of Study
The scope of study in this project is focusing on two things. The first scope is relative permeability of composite core with the length of 3 inches with limitation of equipment. Most probably, three single cores with the length of 1 inch each that used as the equipment can only accommodate the core plug with the maximum length of 3 inches.
The second scope of study is the effect of discontinuity in composite core. Composite core use with the purpose of to reduce capillary end effect might will resulting in other problems. For example is error in permeability value obtained due to discontinuity of the cores and each core have different diameter value where the value that keyed in the simulator is based only on average value. Besides that, comparison analysis is a part of the scope of study in this project.
5
CHAPTER 2
LITERATURE REVIEW
In this review, several previous literatures have been selected to be primarily reviewed with some other supporting literatures. This section shall be divided into two sections which are Relative Permeability Concepts and Composite Core.
2.1 Relative Permeability Concept
According to Schlumberger’s Oilfield Glossary website (2014), effective permeability is defined as the ability to flow a particular fluid when other immiscible fluids are present in the reservoir. Effective permeability usually measured directly in the laboratory on small core plugs. Absolute permeability is the ability for the fluid to flow through a rock when there is only single fluid exists. Hence, relative permeability is the ratio of effective permeability to absolute permeability of the fluid at total saturation.
Relative permeability calculation allows comparison of the fluid on their ability to flow in the presence of each other. Relative permeability on reservoir core samples can be determined by a lot of methods including steady state, unsteady state and centrifugal method.
According to Bennion (1991), steady state method is method where a fixed ratio of two or more immiscible fluids is simultaneously forced to flow through a test sample. The test will be run until pressure and saturation is established. Relative permeability value can be obtained directly from two-phase steady state displacement tests at certain saturation level. This is among the benefits of using this method where no manipulation or special treatment of data is required. However, steady state method requires high cost and it is quite complex thus it is less preferred compared to unsteady state method (Langaas, 1996). Figure 1 shows the procedure of steady state method waterflood procedure.
6
Figure 1: Steady state Waterflood Procedure (Adopted from Relative Permeability, by Dr. Paul Glover, 2012, Scotland)
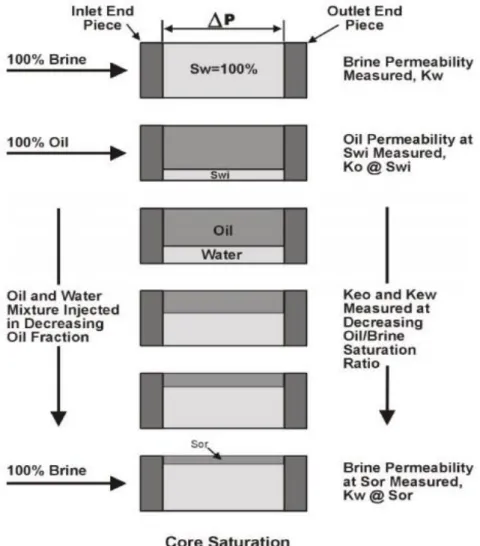
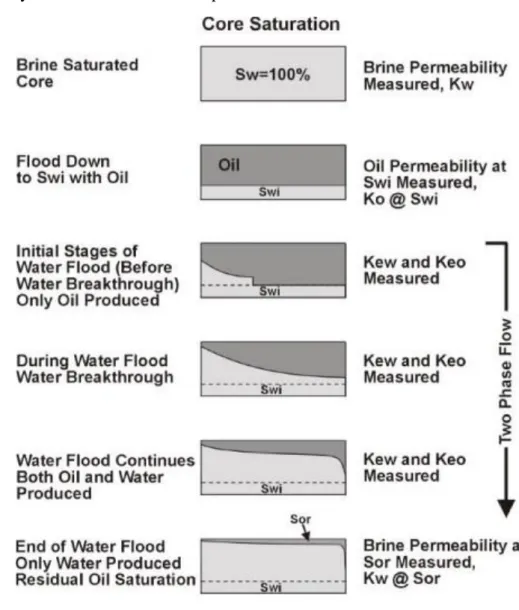
In other way around, unsteady state method is where the fluid theory initially described by Buckley and Leverett (1942), to describe fluid flow through porous media. Buckley and Leverett method was modified by Welge (1952), to facilitate the prediction of relative permeability ratios at given saturation levels in core analysis test. Unsteady state method is much simpler than steady state method.
According to Bennion (1991), the test is run by the displacement of a single phase through the core. The core initially saturated nonwetting and wetting phase and is at the minimum saturation of the phase to be injected. The disadvantages of using unsteady state method are this method easy to be influenced by capillary end effects and rate-dependent instability effects. In addition, there is potential that between
7
displacing and displaced will not reach equilibrium. Figure 2 shows the procedure of unsteady state method waterflood procedure.
Figure 2: Unsteady State Waterflood Procedure (Adopted from Relative Permeability, by Dr. Paul Glover, 2012, Scotland)
Centrifugal method in general have had limited acceptance due to the small size of the core samples in other meaning that the small core sample cannot be utilize to conduct those types of tests at pressure and temperature of reservoir conditions (Bennion, 1991).
The usage of relative permeability is very extensive in wide areas of reservoir engineering. Recently, relative permeability value will be used in matching, predicting and optimizing reservoir performance. Relative permeability graph will be
8
plotted and any depletion in the relative permeability value will be analysed in order to increase the production of oil by using many simulation models. According to Thomas et al. (1991), relative permeability will be affected by numerous physical factors such as temperature, viscosity, wettability, fluid saturations, immobile trapped phases, capillary outlet phenomena, physical rock properties, displacement rates, overburden stress, hysteresis effect, magnitude of initial phase and clay and fines content.
2.1.1 Two-Phase Relative Permeability
When there are wetting and nonwetting phase flowing in a reservoir rock, each phase follows separate and distinct part. Figure 3 shows a typical set of relative permeability curves for a water oil system. We consider that the water as the wetting phase. In Figure 3, it indicates that the distribution of the phases based on their wetting characteristics results in nonwetting and wetting phase relative permeability. (Tarek, 2006).
9
Figure 3: Typical Two-phase Flow Behaviour (Adopted from Reservoir Engineering Handbook, by Tarek Ahmed, 2006, USA)
Other than two phases wetting characteristics, residual saturation is another important phenomenon in two-phase relative permeability. Residual saturation is the saturation at which the displaced phase ceases to be continuous, flow of the displaced phase will cease. From this concept, the maximum recovery of the reservoir can be determined. Tarek (2006) stated that the saturation at which the fluid just starts to flow is called the critical saturation. The evidence can be referring to the previous to examine of the relative permeability curve.
10
2.1.2 Drainage and Imbibition Process
Hysteresis is the difference in permeability when changing the saturation history. The rock sample is initially saturated with the wetting phase. Then, the wetting phase is displacing by nonwetting phase. Relative permeability data that obtained during the process recorded as drainage. During the laboratory experiment, the core will first be saturated with water.
The core later injected by oil where the core displaces the water to a residual. The objective of desaturation is to establish the original fluid saturations that are found when the reservoir first discovered. Later, the wetting phase is reintroduced into the core and will continuously increasing. This process is called as imbibition. The drainage and imbibition process can be described as Figure 4. (K. Langaas, 1996).
Figure 4: Hysteresis effects in relative permeability (Adopted from Reservoir Engineering Handbook, by Tarek Ahmed, 2006, USA)
11
The relative permeability value of both drainage and imbibition process is recorded Note that the imbibition process causes the wetting phase to lose its mobility at lower value of water saturation than does the drainage process. Both processes have similar effects on wetting phase curve. The comparison between the oil-wet system and water-wet system is tabulated in the Table 1.
Table 1: Differences between oil-wet and water-wet
Criteria Water-system Oil-system
Water saturation Equal
Intersection point of the two curves
Greater than 50% Less than 50%
Relative permeability to water at maximum water saturation
Less than 0.3 Greater than 0.5
Connate water saturation Greater than 25% Less than 15%
2.1.3 Johnson, Bossler and Naumann (JBN) method
According to T.M Tao (1984), JBN method is an explicit method to measure relative permeability by computation of derivatives of measured saturation and pressure drop data used with experiments. The effect of capillary pressure is negligible in using JBN method. The calculations that involved in JBN method are straightforward and a priori functional forms of the relative permeabilities need not be assumed.
However, the disadvantage of using JBN method is that derivatives of measured data must be estimated where the effect of small measurement errors becomes amplified. JBN method has been used more than fifty years to calculate relative permeability that can be estimated from displacement experiments. (T.M. Tao, 1984).
In order to satisfy assumption on capillary pressure negligence, the experiment will be performing at a high flooding rate (Q = 1.0 cc/s), which is for oil-water rock system. According to K. Li et. al (2002), certain problems appear when the
12
experiments were conducted at very high flooding rates. First, the relative permeabilities measured at high injection rates do not represent the real value of reservoir relative permeabilities where the values are believed very low which is about 1 ft/day or less than 3 ft/day.
Secondly, for some low permeable cores and unconsolidated sandstone, high injection rates may not be applied. The needed working pressure to apply high flow rates in core samples with low permeability may be over the maximum pressure of the instrument. (K. Li et. al, 2002).
13 2.2 Composite Core
Composite core is two or more single cores that put together in relative permeability tests. In the real world, each different component will have different properties. Ordering of the composite core will be crucial for the between correspondence true and measured permeability. Huppler (1969) neglected capillary effects and presented arrangement of single core based on the permeability of the single core itself. Assumptions that been used are each single core have similar individual relative permeability curves and waterflood unsteady state displacement.
K. Langaas et al. (1996) state that the best ordering is in the descending order where the higher permeability will be at the inlet meanwhile the lowest permeability will be at the outlet of composite core. When the single core were put in ascending, descending and Huppler’s ordering, it shows that the relative permeabilites for descending ordering shows significantly highest value of relative permeabilities as compared to ascending and Hupper’s ordering. Ascending and Huppler’s ordering are essentially the same, where Huppler’s ordering resulting in somewhat higher relative permeabilities.
Huppler (1969), added that composite core also useful where end effects would invalidate results from tests on single core. During waterflood testing, there are several assumptions were been used. The assumptions are that all core sections are homogenous and isotropic, all core sections have almost similar relative permeability curves and the contact between sections is good. Besides, the assumptions are all core section has nearly identical residual oil and connate water value. The flooding rate is assumed high enough to make capillary end effect not important in all core sections.
14
CHAPTER 3
METHODOLOGY
Methodology is the rules and procedure that employed in a particular discipline, in this case is reservoir permeability tests. This chapter is divided to several sections which are; i) summary of project flow FYP 1 & FYP 2, ii) material & equipment used iii) theory behind the experiment iv) Gantt chart v) Key Milestones and vi) procedure steps laboratory experiment.
3.1 Summary of Project Flow
This summary of project flow summarize all the components that involved in order to complete this Final Year Project. Summary of project flow categorized as two parts because there are Part 1 for FYP 1 and Part 2 for FYP 2.
3.1.1 Summary of Project Flow FYP 1
15
Figure 5: Summary of Project Flow FYP1
Project
title
selected:
The
Effects
of
Composite Core on Relative Permeability
tests
Searching
for
literature
material
from
previous studies including books, journal and
conference paper
The objectives of the project were set up
Submitted Extended Proposal to supervisor
Proposal defence was done in front of
Internal Examiner and Supervisor
Laboratory
experiment work was started.
Core
plugs
absolute
permeability
and
porosity determined
Submission of Interim Report draft
Submission of Interim Report
Conclusion from FYP I and recommendation
for FYP II
16
3.1.2 Summary of Project Flow FYP 2
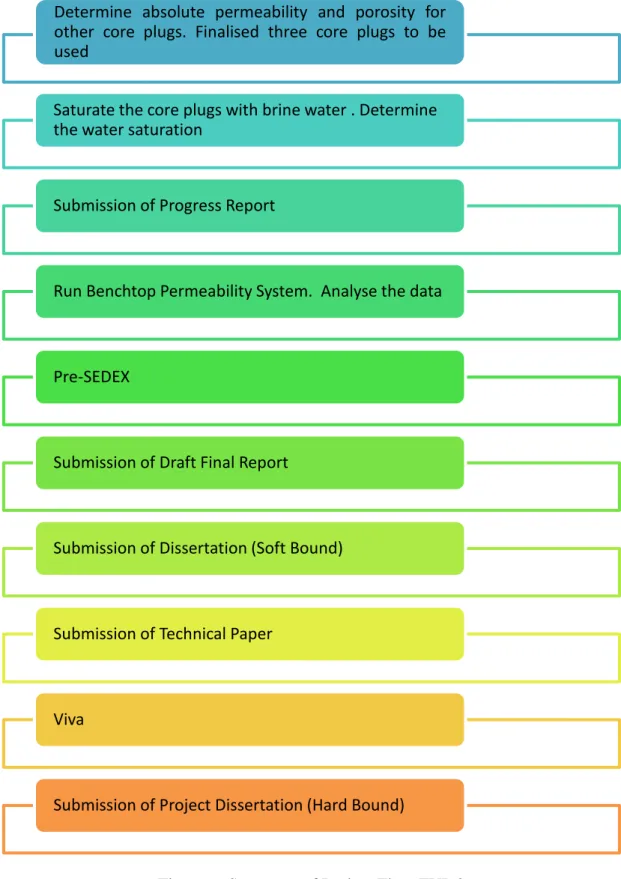
The summary of flow of project for FYP 1 summarize as in Figure 6.
Figure 6: Summary of Project Flow FYP 2
Determine absolute permeability and porosity for other core plugs. Finalised three core plugs to be used
Saturate the core plugs with brine water . Determine the water saturation
Submission of Progress Report
Run Benchtop Permeability System. Analyse the data
Pre-SEDEX
Submission of Draft Final Report
Submission of Dissertation (Soft Bound)
Submission of Technical Paper
Viva
17 3.2 Material and Equipment
This project involves experiment that has been conducted in the laboratory. This section is divided to two parts which are Material used and Equipment used.
3.2.1 Material used
Table 2: Material Used and Description
Photo Material Description
Berea Sandstone core Sedimentary rock. Composed of quartz and held together by silica. The grain are mainly sand-sized. Three samples used in this project named as L1, M1 and M5.
Mineral oil Mixtures of alkane. Odourless and colourless. In this project, the mineral oil will be injected during drainage process.
Brine water Concentration of 24000 ppm. The mixture of Sodium Chloride (NaCl) and distilled water. Used to saturate the core plug and injected during imbibition.
18
3.2.2 Equipment used
Table 3: Equipment Used and Function
Photo Equipment Function
Benchtop Permeability System (BPS)
Manually operated system designed to determine permeability value of liquid. Can accommodate 3 inches-long core plug. The main equipment used in this project.
POROPERM To determine properties of core plug such as absolute permeability, porosity, grain volume, pore volume and Klinkerberg slip factor. Weight Balance To measure the dry and
wet weight of the core. Also, to measure the weight of the liquid drop during displacement method (drainage and imbibition).
Glass Capillary Viscometer
To determine kinematics viscosity of mineral oil.
19
Desiccator Used during sample
cores saturation with brine under vacuum condition to ensure that the brine filled in the pores of the core.
Electronic Digital Display Calliper
Calliper used to measure the dimension of the core plug such as length of the core plug and its diameter.
Digital Stopwatch To measure the time taken for the first drop of brine during imbibition to appear and first drop of mineral oil during drainage.
Magnetic Stirrer Rotating magnetic field causing the stir bar immersed mixture of distilled water and Sodium Chloride to spin very quickly, thus stirred it.
20
Diaphragm Vacuum Pump Sucked all the air out from desiccator and leave the condition inside the desiccator as a vacuum.
Core Cutting Saw To cut the core plug to 1-inch size by using its blade with high precision.
21
3.3 Theory: Calculation using Johnson, Bossler and Naumann (JBN) method
In this experiment, Johnson, Bossler and Naumann (JBN) method is considered to be used to calculate relative permeability of core plug. JBN method is explicit methods that require the computation of derivatives of measured data (saturation and pressure drop) and the effects of capillary pressure are negligible. JBN method not requires trial-and-error or iterative procedure as it is straightforward.
The following important relations used in JBN method:
𝑋(𝑡)|
𝑠𝑤= 𝑊
𝑖𝐿𝑓′
𝑤(3-1)
𝑊𝑖 =
∫ 𝑞 𝑑𝑡0𝑡𝑖 𝐴𝐿∅ (3-2)∆𝑝 =
𝑞𝜇𝑤 𝑘∫
𝑓𝑤 𝑘𝑟𝑤 𝐿 0𝑑𝑥
(3-3)𝑆
𝑎𝑣𝑔= 𝑆
𝐿+ 𝑊
𝑖𝑓
𝑜(𝑆
𝐿)
(3-4)𝑄
𝑜= 𝐴𝐿∅(𝑆
𝑎𝑣𝑔− 𝑆
𝑤𝑟)
(3-5)𝑓
𝑤= 1 − 𝑓
𝑜= [1 +
𝑘𝑟𝑜𝜇𝑤 𝑘𝑟𝑤𝜇𝑜]
−1 (3-6) 𝑑𝑆𝑎𝑣𝑔 𝑑𝑊𝑖= 𝑓
𝑜(𝑆
𝐿)
(3-7)𝐼
𝑟=
𝑞𝜇𝑜𝐿 ∆𝑝𝑘 (3-8)22 𝑑[ 1 𝑊𝑖𝐼𝑟] 𝑑[ 1 𝑊𝑖]
=
𝑓𝑜(𝑆𝐿) 𝑘𝑟𝑜(𝑆𝐿) (3-9)𝑆
𝑎𝑣𝑔= 𝑆
𝑤𝑟+
𝑄𝑜 𝐴𝐿∅ (3-10)The steps used to estimate the relative permeabilities are summarized as follows: 1) Use Equation (3-10) to calculate Savg.
2) Use Equation (3-2) to calculate Wi. 3) Use Equation (3-8) to calculate Ir. 4) Estimate derivatives dSavg/dWiand
𝑑 [
1
𝑊
𝑖𝐼
𝑟] /𝑑[
1
𝑊
𝑖]
5) Use Equation (3-7) and (A-9) to calculate kro (SL).
6) Use Equation (3-6) to calculate krw (SL).
7) Use Equation (3-4) to calculate SL.
Note: All steps are simple calculations, with the exception of the estimation of the derivatives in Step 4.
23 where:
Nomenclature
d = derivative operator
𝑆𝑎𝑣𝑔 = average water saturation, fraction W = PV injected
𝑓 = fractional flow 𝐼𝑟 = relative injectivity
q = volumetric injection rate, 𝑐𝑚𝑠3
𝑘𝑟 = relative permeability 𝑘 = 𝑎𝑏𝑠𝑜𝑙𝑢𝑡𝑒 𝑝𝑒𝑟𝑚𝑒𝑎𝑏𝑖𝑙𝑖𝑡𝑦, 𝑚𝑑 𝐿 = 𝑡𝑜𝑡𝑎𝑙 𝑙𝑒𝑛𝑔𝑡ℎ 𝑜𝑓 𝑐𝑜𝑟𝑒 𝑠𝑎𝑚𝑝𝑙𝑒, 𝑓𝑡 [𝑚] 𝑀 = 𝑛𝑢𝑚𝑏𝑒𝑟 𝑜𝑓 𝑠𝑖𝑚𝑢𝑙𝑎𝑡𝑒𝑑 𝑒𝑥𝑝𝑒𝑟𝑖𝑚𝑒𝑛𝑡𝑠 ∆𝑝 = 𝑝𝑟𝑒𝑠𝑠𝑢𝑟𝑒 𝑑𝑟𝑜𝑝 𝑎𝑐𝑟𝑜𝑠𝑠 𝑡ℎ𝑒 𝑐𝑜𝑟𝑒, 𝑝𝑠𝑖 [𝑘𝑃𝑎] 𝑄𝑜= 𝑐𝑢𝑚𝑢𝑙𝑎𝑡𝑖𝑣𝑒 𝑜𝑖𝑙 𝑝𝑟𝑜𝑑𝑢𝑐𝑡𝑖𝑜𝑛, 𝑐𝑚3 𝑆𝐿 = 𝑤𝑎𝑡𝑒𝑟 𝑠𝑎𝑡𝑢𝑟𝑎𝑡𝑖𝑜𝑛 𝑎𝑡 𝑡ℎ𝑒 𝑜𝑢𝑡𝑙𝑒𝑡 𝑒𝑛𝑑, 𝑓𝑟𝑎𝑐𝑡𝑖𝑜𝑛 𝑆𝑟 = 𝑟𝑒𝑠𝑖𝑑𝑢𝑎𝑙 𝑠𝑎𝑡𝑢𝑟𝑎𝑡𝑖𝑜𝑛, 𝑓𝑟𝑎𝑐𝑡𝑖𝑜𝑛 𝑡 = 𝑡𝑖𝑚𝑒, 𝑠𝑒𝑐𝑜𝑛𝑑𝑠 𝑥 = 𝑠𝑝𝑎𝑡𝑖𝑎𝑙 𝑐𝑜𝑜𝑟𝑑𝑖𝑛𝑎𝑡𝑒 𝛿 = 𝑒𝑟𝑟𝑜𝑟 Subscripts o = oil w = water
26 3.4 Gantt Chart
This section provides on timeline of Final Year Project from the beginning until the end. Hence, it is divided into two parts which are Timeline for FYP 1 and Timeline for FYP 2.
3.4.1 Timeline for FYP 1
Table 4: Gantt chart of FYP 1
No. Detail/ Week 1 2 3 4 5 6 7 8 9 10 11 12 13 14
1. Project topic selected: Effects of Composite Core on Relative Permeability Tests
2. Research work on previous research papers, books, journals and website
3. Submission of Extended Proposal
4. Proposal Defence with Internal Examiner: Prof Mariyamni 5. Prepared documents to enter laboratory
6. Experiment started: Select core samples and run using POROPERM
7. Submission of Interim Draft Report 8. Submission of Interim Report
27 3.4.2 Timeline for FYP 2
Table 5: Gantt chart of FYP 2
No. Detail/ Week 1 2 3 4 5 6 7 8 9 10 11 12 13 14 15
1. Project Work Continued: Brine prepared, core plug saturated, average permeability of brine determined
2. Submission of Progress Report
3. Project Work Continued: Mineral oil viscosity was determined, single core relative permeability conducted, core plugs been cut, composite core relative permeability was determined
4. Poster Presentation with Internal Examiner: Prof Dr. Mohannad 5. Submission of Draft Final Report
6. Submission of Dissertation (soft bound) 7. Submission of Technical Paper
8. Viva
28 3.5 Key Milestones
Figure 7: Key Milestones of FYP 2 Week 1 -6 - Project Work Continues until Brine Saturation ACHIEVED Week 7- 10 - Submission of Progress Report - Run Benchtop Permeability System - Pre-SEDEX ACHIEVED Week 11-13 -Submission of Draft Final report - Submission of Dissertation (soft bound) - Submission of Technical Paper ACHIEVED Week 15 - VIVA - Submission of Project Dissertation (hard bound) - Project DONE
29 3.6 Experiment Procedure
This project involving experiment that has been conducted in the Core Analysis Laboratory. Hence, there are several steps and procedures has been followed to ensure the success of the experiment. Figure 8 shows the steps of the experiment:
1
• Three core plugs was chosen named as L1, M1 and M5. Each core has the length of 3 inches with different values of absolute permeability. Different value is essential in order to make comparison between each core plug in composite core.
2
• Then, the cores was cleaned using Carbon Dioxide (CO2) to eliminate any other impurities.
3
• After that, the cores then been dried by using the oven. Now, the core considered as cleaned.
4
• The dimension for each core plug was measured and recorded. For examples are the weight, diameter and length of the core plug.
5
• By using POROPERM, the rock properties such as porosity, absolute permeability and pore volume will be determined. The POROPERM used to flow the Helium gas into the rock pore.
6
• Then, the brine was designed and prepared. 24 gram of Sodium Chloride (NaCl) was mixed with 1 litre of distilled water to produce 24 000 ppm concentration of brine.
30
7
• By using desiccator, the core plugs then saturated by using the brine. The pump sucked all the air out and leave the condition inside the desiccator as a vacuum. The saturation process was about 24 hours.
8
• Next, the core plug was run by using Benchtop Permeability System (BPS) to determine its brine average permeability. Three injections with different flowrates was conducted. Injection pressure must be less than 200 psi.
9
• During the experiment, the time taken, pressure changes and flowrate of outlet will be jotted down. The graph of Flowrates versus Injection Pressure was plotted. By using Microsoft Excel, equation and R-squared value of the graph can be displayed .
10
• R-squared is a measure of the goodness of the fit of the trendline of the data. If the value is approaching 1, it is good. The average permeability of the brine was determined by using the gradient of the graph and application of Darcy's Law.
11
• Then, one of the core plug from three samples was chosen to be run using BPS for injection with mineral oil and brine again. Before that, the viscosity of mineral oil was determined by using glass capillary viscometer.
12
• The single core that has been run was saturated again by using the brine. After that, each core plug was cut to a length that less than 1 inch using Core Cutting Saw.
13
• The composite core then been installed in BPS and was let to run again. The mineral oil injected to measure the relative permeability value. Then, the composite core was run by injecting the brine again. This process called as imbibition.
31
Figure 8: Procedure of Laboratory Experiment
14
• During the experiment was run, the weight for the droplets of liquid was measured for each minute. The time taken for the first drop displacing liquid starts to appear was jotted down.
15
• By using JBN calculation, the relative permeability value was calculated.
16
• The comparison between relative permeability value between single core and composite core was made.
CHAPTER 4
RESULTS AND DISCUSSION
4.1 Choosing the Core Plug
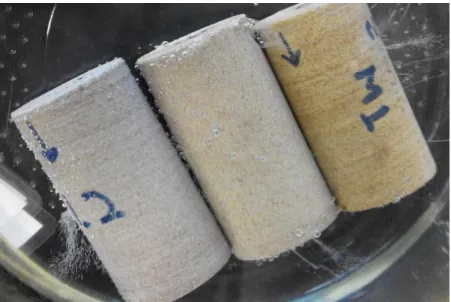
Before conducting the experiment, the core plug that wanted to be used throughout the experiment was chosen. After several considerations such as the porosity and the difference value of absolute permeability for each core plug, the core plugs that used throughout this project was L2, M1 and M5.
Figure 9: Three core plugs named as L2, M1 and M5
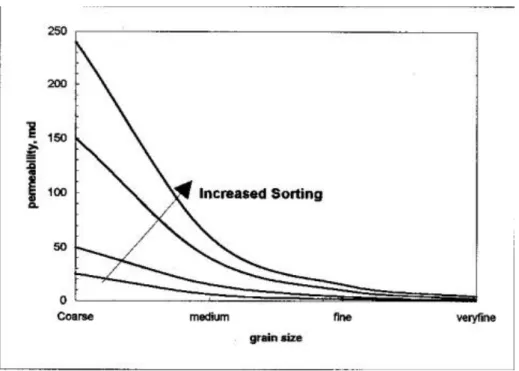
These core plugs were chosen because these three core plugs have significant difference of permeability values. Among these three core plugs, L2 is the one that has tightest sandstone structure. Hence, the times taken to complete one run of porosity and absolute permeability determination is longer compared to the other two core plugs.
As the grain size increase, so the pore throat size and permeability subsequently increase. Permeability will be increase from coarse to very fine grains. (http://infohost.nmt.edu/).
33
Figure 10: Effect of grain size and sorting on permeability (Adopted from Relative Permeability, by Dr. Paul Glover, 2012, Scotland)
4.1.1 Determination of Porosity and Absolute Permeability
By using equipment named as POROPERM, the value of porosity and absolute permeability determined. The injection pressure used was 150 psia and it is fixed throughout the experiment. If possible, injection pressure should be lower as there should be a big gap between confining pressure and injection pressure. The difference between confining pressure and injection pressure is effective pressure. During the experiment each core plug was run many times as possible to ensure the results obtained are genuine.
In addition, three values of confining pressure were used for each core plug to find the effect of the effective pressure on the pore volume and porosity. The values are 300 psia, 350 psia and 400 psia. However, confining pressure of 400 psia is actually will be used throughout this project because it will create larger pressure gradient between confining pressure and injection pressure. The result of the POROPERM
34
run is tabulated and the graph of Porosity versus Confining Pressure plotted as follow:
Table 6: Porosity and Permeability of L2, M1 and M5 core plugs SAMPLE
NAME WEIGHT (gram) DIAMETER (mm) LENGTH (mm) CONFINING PRESSURE (psia) POROSITY (fraction) PERMEABILITY (mD) L2 189.202 38.50 75.97 400 19.8 16.025 350 18.9 18.775 300 18.5 16.147 M1 172.007 37.70 72.10 400 19.7 63.639 350 19.5 63.276 300 18.8 63.099 M5 185.838 38.39 76.90 400 22.2 200.346 350 21.2 199.598 300 19.3 200.483
Figure 11: Graph of Porosity versus Confining Pressure
18 18.5 19 19.5 20 20.5 21 21.5 22 22.5 270 290 310 330 350 370 390 410 Por o si ty (% )
Confining Pressure (psia)
Porosity vs Confining Pressure
L2 M1 M5
35
Theoretically, as the confining pressure increase, porosity should be decrease. The reason is because when the high pressure is applied, the rock pore will become very tight thus the ability of the rock to hold the fluid will be decrease. Ironically, this experiment shows the opposite graph trend from the theory.
In this experiment, when the confining pressure increases, the porosity is decrease. The experiment was repeated for two times and for each core plug and confining pressure, the experiment was repeated for three times. The result still shows the same pattern. It can be concluded that under high confining pressure, grain crushing and strong rock fragment compaction occurs in highly deformed specimens. This leads to high porosity in the rock pore. (Alain et.al, 2006).
4.1.2 Water Saturation of Sample Cores
Once porosity and permeability measured are done, the core plugs then was saturated with brine inside the desiccator. The diaphragm vacuum pump was run to suck all the air out from the desiccator to create vacuum condition inside the desiccator. This vacuum condition is vital for the easiness of the brine to fill up the rock pore of sandstone.
The good water saturation to be reaching is 100%. Brine first was designed and prepared by mixing 1 litre of distilled water with 24 gram of Sodium Chloride (NaCl). This mixture produces 24 000 ppm of brine concentration. Then, by using desiccators and pump, the core plug soaked into the brine for several days until completely saturated.
36
Figure 12: The saturation process of core plug
After several days, the core plugs were removed from the desiccators and be kept in the beaker that soaking in brine water to prevent the core plugs from getting dry. Before put the core plugs into the beaker, the wet weight for each core plugs were measured. This is vital to measure the wet weight before the water saturation value can be calculated.
To calculate the water saturation of L2 core, the steps are as follow: 1. Measure the difference of core dry weight and wet weight:
𝐵𝑟𝑖𝑛𝑒 𝑤𝑒𝑖𝑔ℎ𝑡 = 206.472 − 189.202 = 17.27 𝑔𝑟𝑎𝑚
2. Calculate the brine volume:
𝐵𝑟𝑖𝑛𝑒 𝑣𝑜𝑙𝑢𝑚𝑒 = Brine weight Brine density
= 17.27 1.01534∗ = 17.0091 𝑐𝑐
37 3. Calculate water saturation:
𝑊𝑎𝑡𝑒𝑟 𝑠𝑎𝑡𝑢𝑟𝑎𝑡𝑖𝑜𝑛 =Brine volume Pore volume
=17.0091 17.4690
= 0.97367 ⩳ 97%
The value of water saturation obtained about 97% which is almost 100% water saturation. The summary of water saturation of core plugs is as in the Table 8.
Table 8: Summary of brine volume and water saturation
SAMPLE NAME DRY WEIGHT (g) WET WEIGHT (g) BRINE VOLUME (cc) = Sw (%) L2 189.202 206.472 17.0090807 97.36722595 M1 172.007 187.771 15.52583371 97.75742168 M5 185.838 205.417 19.28319578 97.51793151
4.1.3 Determination of Brine Average Permeability
After the core plugs has been saturated with water, the core plugs then was run using Benchtop Permeability System (BPS) to determine the average permeability of the brine in the core plug. The BPS was run at several value of flow rate until reach stability. For examples are 1.2 cc/min, 1.5 cc/min and 1.8 cc/min to compare the values of average permeabilities obtained. The data from BPS then transferred to the computer simulator hence the graph of Delta P versus Time and Permeability versus Time was plotted.
38
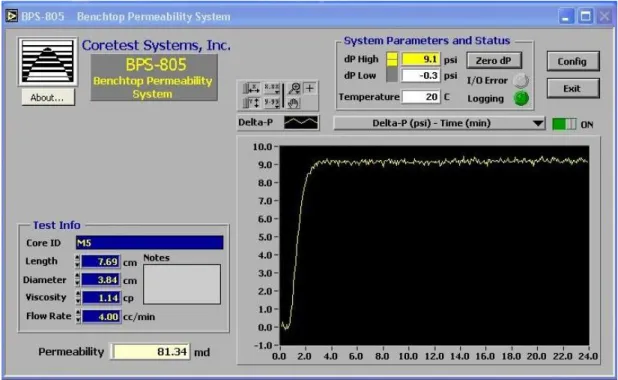
Figure 13: Plot of Delta P versus Time for M5 core plug
Figure 14: Plot of Permeability versus Time for M5 core plug
Figure 13 and Figure 14 show the graphs that has reached their stability in term of pressure differential and permeability. Using Microsoft Excel, the graph of Flowrates versus Injection Pressure was plotted. Equation of the plot and R-squared value of the graph can be displayed. R-squared is a measure of the goodness of the fit of the
39
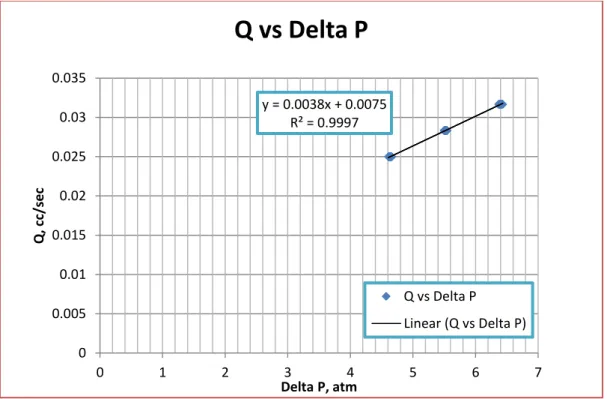
trendline of the data. If the value is approaching 1, it is considered as good. Figure 15 shows the example of the graph plotted for L2 core. The unit of Pressure and Flowrate should be converted first to Darcy’s unit to ensure the calculation of average permeability obtained will be correct.
Figure 15: Graph of Flowrate versus Pressure Gradient of L2 core
The average permeability of the brine was determined by using the gradient of the graph and application of Darcy's Law. Darcy’ Law stated as in Figure 16.
y = 0.0038x + 0.0075 R² = 0.9997 0 0.005 0.01 0.015 0.02 0.025 0.03 0.035 0 1 2 3 4 5 6 7 Q, c c/ sec Delta P, atm
Q vs Delta P
Q vs Delta P Linear (Q vs Delta P)40
Figure 16: Darcy’s Law equation with their units
From the Figure 16, the gradient of the graph where:
𝑚 =
𝑘 𝐴𝜇 𝐿
(C-1)
We rearrange the equation (C-1) and obtained permeability, k as:
𝑘 =
𝑚 𝜇 𝐿𝐴
Take the m value from the graph in Figure 15 as the example, where m=0.0038, μ=1.136 centipoise, L=7.597 cm, A=11.6416 cm2.
𝑘 =
(0.0038)(1.136)(7.597)(11.6416)
41
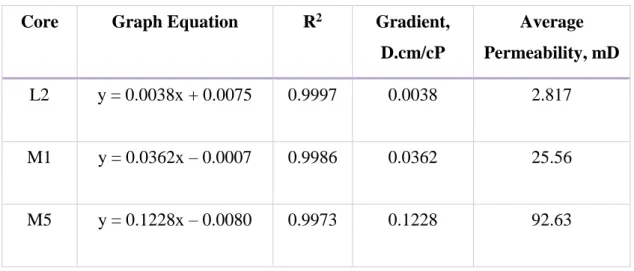
For the other two cores, the graph of Flowrate versus Delta P and the permeability calculation as in Appendices. The summary of brine average permeability for each core plug was tabulated as in Table 9.
Table 9: Brine Average Permeability for L2, M1 and M5 cores Core Graph Equation R2 Gradient,
D.cm/cP Average Permeability, mD L2 y = 0.0038x + 0.0075 0.9997 0.0038 2.817 M1 y = 0.0362x – 0.0007 0.9986 0.0362 25.56 M5 y = 0.1228x – 0.0080 0.9973 0.1228 92.63
4.1.4 Viscosity of Mineral Oil
The viscosity of mineral oil was determined by using glass capillary viscometer. The reason for using these glass capillary viscometer is because this type of viscometer can determine dynamics viscosity for Newtonian fluid as Mineral Oil is Newtonian fluid. Newtonian fluid is any fluid that exhibits a viscosity that remains constant regardless of any external stress that is placed upon it, such as mixing or a sudden application of force (www.wisegeek.org, 2015).
Figure 17: Relationship between Shear Stress and Shear Rate (Adopted from Shyne Coleman, 2010, United States)
42
Two codes of glass capillary viscometer was used to validate the values of kinematic viscosity obtained. For each code of glass capillary viscometer, fixed constant value in the unit of cSt/s was given in the manual booklet. The experiment was conducted by inverted the instrument. Next, suction of Mineral oil was applied to one side of the tube. Then, the instrument turned to the normal vertical position. Mineral oil was allowed to travel upwards to another side of the instrument. Another side of glass capillary viscometer have two to three bulbs. The time taken in seconds for the Mineral oil to travel from one bulb to another bulb jotted down. Figure 18 and 19 show two glass capillary instrument used.
Figure 18: 100 Z283 series glass Figure 19: 200 49B series glass
To obtain the value of kinematic viscosity, the time taken for the Mineral oil to flow from one bulb to another bulb multiply with the constant. The unit for kinematic viscosity is cSt. Then, kinematic viscosity will be multiply by the density of the Mineral oil. Dynamic viscosity is determined. Equation (D-1) and (D-2) shows the calculation of kinematic and dynamics viscosity for 200 49B of glass capillary viscometer for first run. The temperature for this experiment fixed at 22 °C.
43 𝐾𝑖𝑛𝑒𝑚𝑎𝑡𝑖𝑐 𝑉𝑖𝑠𝑐𝑜𝑠𝑖𝑡𝑦 = 𝐸𝑓𝑓𝑙𝑢𝑥 𝑇𝑖𝑚𝑒 𝑥 𝑉𝑖𝑠𝑐𝑜𝑚𝑒𝑡𝑒𝑟 𝐶𝑜𝑛𝑠𝑡𝑎𝑛𝑡 (D-1) 𝐾𝑖𝑛𝑒𝑚𝑎𝑡𝑖𝑐 𝑉𝑖𝑠𝑐𝑜𝑠𝑖𝑡𝑦 = 339 𝑠 𝑥 0.03313𝑐𝑆𝑡 𝑠 = 11.23 𝑐𝑆𝑡 𝐷𝑦𝑛𝑎𝑚𝑖𝑐 𝑉𝑖𝑠𝑐𝑜𝑠𝑖𝑡𝑦 = 𝐾𝑖𝑛𝑒𝑚𝑎𝑡𝑖𝑐 𝑉𝑖𝑠𝑐𝑜𝑠𝑖𝑡𝑦 𝑥 𝑀𝑖𝑛𝑒𝑟𝑎𝑙 𝑜𝑖𝑙 𝐷𝑒𝑛𝑠𝑖𝑡𝑦 (D-2) 𝐷𝑦𝑛𝑎𝑚𝑖𝑐 𝑉𝑖𝑠𝑐𝑜𝑠𝑖𝑡𝑦 = 17.66 𝑐𝑆𝑡 𝑥 0.838 𝑔/𝑚𝐿 = 9.41 𝑐𝑃
The experiment was repeated two times for validation of the result that obtained during the first run. The experiment also repeated by using different code of capillary glass viscometer. The values of dynamic viscosity resulted from the experiment are 8.06 cP to 9.41 cp where we can consider it is about 10 cP at 22 °C.
Table 10: Value of Kinematic and Dynamic Viscosity Capillary
Glass Code
Run Time (s) Constant (cSt/s) Kinematic Viscosity (cSt) Dynamic Viscosity (cP) 200 49B 1 339 0.03313 11.23 9.41 2 330 10.93 9.16 100 Z283 1 638 0.01565 9.98 8.36 2 614 9.61 8.05
44
4.1.5 Relative Permeability of Single Core
In order to reach first objective of the project, the core plug should undergone drainage and imbibition process as a single core so that comparison between the single core and composite core relative permeability values obtained can be made. Due time constraint, only one core have been selected to be tested as single core. The optimum injection rate for this tests are 2.0 cc/min. This value was chosen because based on the observation from the determination of brine average permeability previously. 2.0 cc/min gives the best result on the graph and the time taken for the first drop of displacing liquid to appear is not too short. The time taken for the first drop of displacing liquid must be invalid if the injection rate used is too high. Surely the pressure gradient will increasing extremely and exceed 200 psi thus the experiment has to be stopped if the injection rate is too high. This injection rate (2.00 cc/min) also suitable to be applied during the composite core experiment thus comparison can be made easily.
Between these three cores, M5 was chosen to be run as single core. This is because M5 have good permeability and porosity, thus the test that conducted on M5 was easier compared to other two cores. First, the single core was injected by Mineral oil and then followed by injecting the brine. During drainage process, the wetting phase was displaced by nonwetting phase until nonwetting phase reach stability in term of Pressure gradient and permeability. The first drop of Mineral oil appears was considered as breakthrough had occurred. During this run, the first drop of Mineral oil was at 38 minutes after the Mineral oil starts to be injected. Figure 20 and 21 show the graph of Delta P versus Time and graph of Permeability versus Time.
45
Figure 20: Drainage of M5 single core shows Graph of Delta P versus Time
46 Swi was calculated by using the formula:
𝑆𝑤𝑖: 𝑃𝑜𝑟𝑒 𝑉𝑜𝑙𝑢𝑚𝑒 − (𝐵𝑟𝑖𝑛𝑒 𝑆𝑎𝑡𝑢𝑟𝑎𝑡𝑒𝑑 𝐶𝑜𝑟𝑒 𝑊𝑒𝑖𝑔ℎ𝑡 − 𝑂𝑖𝑙 𝑆𝑎𝑡𝑢𝑟𝑎𝑡𝑒𝑑 𝐶𝑜𝑟𝑒 𝑊𝑒𝑖𝑔ℎ𝑡𝐷𝑒𝑛𝑠𝑖𝑡𝑦 𝑜𝑓 𝑊𝑎𝑡𝑒𝑟 − 𝐷𝑒𝑛𝑠𝑖𝑡𝑦 𝑜𝑓 𝑀𝑖𝑛𝑒𝑟𝑎𝑙 𝑂𝑖𝑙 ) 𝑃𝑜𝑟𝑒 𝑉𝑜𝑙𝑢𝑚𝑒 = 19.774 − ( 205.417 − 200.850 1.01534 − 0.838 ) 19.744 = 18.47 %
Figure 22: Graph of Relative Permeability versus Water Saturation for Single Core Drainage
By using Johnson, Bossler and Naumann correlation in Microsoft Excel, the values of relative permeability was determined. From Figure 22, during drainage process, the value of Kro at irreducible water saturation are 1.0 and the value of Krw at residual oil saturation are 0.08.
0.0 0.1 0.2 0.3 0.4 0.5 0.6 0.7 0.8 0.9 1.0 0 0.1 0.2 0.3 0.4 0.5 0.6 0.7 0.8 0.9 1 0 0.2 0.4 0.6 0.8 1 R e lat iv e P e rm e a b ilit y t o W a te r, K rw Rela tiv e P e rm e a b ility to Oil, K ro Saturation, Sw
RELATIVE PERMEABILITY TO OIL (Kro) TO WATER (Krw) versus WATER SATURATION
Krw Kro
47
Figure 23: Imbibition of M5 single core shows Graph of Delta P versus Time
48
Figure 25: Graph of Relative Permeability versus Water Saturation for Single Core Imbibition
From Figure 25, during imbibition process, the value of Kro at irreducible water saturation are 0.01 and the value of Krw at residual oil saturation are 0.06.
Figure 26: Graph of Relative Permeability versus Water Saturation for Single Core Drainage and Imbibition
0 0.1 0.2 0.3 0.4 0.5 0.6 0.7 0.8 0.9 1 0 0.1 0.2 0.3 0.4 0.5 0.6 0.7 0.8 0.9 1 0 0.2 0.4 0.6 0.8 1 Rela tiv e P e rm e a b ility to W a te r, K rw Rela tiv e P e rm e a b ility to Oil, K ro Water Saturation, Sw
RELATIVE PERMEABILITY TO OIL (Kro) TO WATER (Krw) versus WATER SATURATION
Kro Krw 0 0.1 0.2 0.3 0.4 0.5 0.6 0.7 0.8 0.9 1 0 0.1 0.2 0.3 0.4 0.5 0.6 0.7 0.8 0.9 1 0 0.2 0.4 0.6 0.8 1 Rela tiv e P e rm e a b ility to W a te r, K rw Rela tiv e P e rm e a b ility to Oil, K ro water Saturation, Sw]
RELATIVE PERMEABILITY TO OIL (Kro) TO WATER (Krw) versus WATER SATURATION
Kro Drainage Krw Drainage Krw Imbibition Kro Imbibition
49
Figure 26 plotted shows that, during drainage process, value of Kro is higher compared to in imbibition process. Krw values shows low significant changes in both process.
4.1.6 Relative Permeability of Composite Core
For composite core, the experiments were run to compare between the arrangement of single cores in composite core. There were two types of ararngement which are increasing and decreasing. For decreasing arrangemnet, drainage and imbibition were run. However, for increasing arrangement, only drainage was done due to time constraint. Still, comparison of composite core of drainage of decreasing arrangemnet and drainage of increasing arrangemnet can be made.
Figure 27: Drainage of decreasing composite core shows Graph of Delta P versus Time
Figure 28: Drainage of decreasing composite core shows Graph of Permeability versus Time
50
Figure 29: Graph of Relative Permeability versus Water Saturation for Composite Core Drainage Decreasing Permeability
From Figure 29, during drainage process, the value of Kro at irreducible water saturation are 0.8 and the value of Krw at residual oil saturation are 0.06.
Figure 30: Imbibition of decreasing composite core shows Graph of Permeability versus Time 0 0.1 0.2 0.3 0.4 0.5 0.6 0.7 0.8 0.9 1 0 0.1 0.2 0.3 0.4 0.5 0.6 0.7 0.8 0.9 1 0 0.2 0.4 0.6 0.8 1 Rela tiv e P e rm e a b ility to W a te r, K rw Rela tiv e P e rm e a b ility to Oil, K ro water Saturation, Sw
RELATIVE PERMEABILITY TO OIL (Kro) TO WATER (Krw) versus WATER SATURATION
Kro Krw
51
Figure 31: Imbibition of decreasing composite core shows Graph of Permeability versus Time
Figure 32: Graph of Relative Permeability versus Water Saturation for Composite Core Imbibition Decreasing Permeability
From Figure 32, during imbibition process, the value of Kro at irreducible water saturation are 0.7 and the value of Krw at residual oil saturation are 0.06.
0 0.1 0.2 0.3 0.4 0.5 0.6 0.7 0.8 0.9 1 0 0.1 0.2 0.3 0.4 0.5 0.6 0.7 0.8 0.9 1 0 0.2 0.4 0.6 0.8 1 Re la tiv e P e rm e a b ilit y t o Wa te r, K rw Rela tiv e P e rm e a b ility to Oil, K ro water Saturation, Sw]
RELATIVE PERMEABILITY TO OIL (Kro) TO WATER (Krw) versus WATER SATURATION
Kro Krw
52
Figure 33: Graph of Relative Permeability versus Water Saturation for Composite Core Drainage & Imbibition Decreasing Permeability
Figure 33 shows combination of drainage and imbibition for composite core in decreasing values of permeability.
Figure 34: Drainage of increasing composite core shows Graph of Permeability versus Time 0 0.1 0.2 0.3 0.4 0.5 0.6 0.7 0.8 0.9 1 0 0.1 0.2 0.3 0.4 0.5 0.6 0.7 0.8 0.9 1 0 0.2 0.4 0.6 0.8 1 Rela tiv e P e rm e a b ility to W a te r, K rw Rela tiv e P e rm e a b ility to Oil, K ro water Saturation, Sw]
RELATIVE PERMEABILITY TO OIL (Kro) TO WATER (Krw) versus WATER SATURATION
Kro Decrease Comp
Krw Decrease Comp Krw Inc Comp
53
Figure 35: Drainage of increasing composite core shows Graph of Permeability versus Time
Figure 36: Graph of Relative Permeability versus Water Saturation for Composite Core Drainage Increasing Permeability
From Figure 36, during drainage process, the value of Kro at irreducible water saturation are 0.018 and the value of Krw at residual oil saturation are 0.02.
0 0.1 0.2 0.3 0.4 0.5 0.6 0.7 0.8 0.9 1 0 0.1 0.2 0.3 0.4 0.5 0.6 0.7 0.8 0.9 1 0 0.2 0.4 0.6 0.8 1 Rela tiv e P e rm e a b ility to W a te r, K rw Rela tiv e P e rm e a b ility to Oil, K ro water Saturation, Sw]
RELATIVE PERMEABILITY TO OIL (Kro) TO WATER (Krw) versus WATER SATURATION
Kro Krw
54
4.2.7 Comparison Single Core and Composite Core
Figure 37 shows during drainage process, Kro of single core having higher value compared to composite core meanwhile the values of Krw in Figure 38 shows that composite core having higher values compared to single core.
Figure 37: Graph of Relative Permeability versus Water Saturation for Single and Composite Core in Drainage process
Figure 38: Graph of Relative Permeability versus Water Saturation for Single and Composite Core in Imbibition process
0 0.2 0.4 0.6 0.8 1 0 0.1 0.2 0.3 0.4 0.5 0.6 0.7 0.8 0.9 1 0 0.2 0.4 0.6 0.8 1 Rela tiv e P e rm e a b ility to W a te r, K rw Rela tiv e P e rm e a b ility to Oil, Kro water Saturation, Sw]
RELATIVE PERMEABILITY TO OIL (Kro) TO WATER (Krw) versus WATER SATURATION
Kro Drainage Single
Krw Drainage Single
Krw Drainage Comp
Kro Drainage Comp
0 0.2 0.4 0.6 0.8 1 0 0.1 0.2 0.3 0.4 0.5 0.6 0.7 0.8 0.9 1 0 0.2 0.4 0.6 0.8 1 Rela tiv e P e rm e a b ility to W a te r, K rw Rela tiv e P e rm e a b ility to Oil, K ro water Saturation, Sw]
RELATIVE PERMEABILITY TO OIL (Kro) TO WATER (Krw) versus WATER SATURATION
Kro Imb Single
Krw Imb Single
Krw Imb Comp
55
4.1.8 Comparison between Ordering in Composite Core
Figure 39: Graph of Relative Permeability versus Water Saturation for Composite Core in Drainage process
Figure 39 shows that decreasing permeability of single core ordering having higher Krw value compared to increasing permeability of single core ordering where the values are 0.06 and 0.02 respectively. Same goes to Kro values, decreasing permeability of single core ordering have higher value compared to increasing permeability of single core ordering where the values are 0.08 and 0.018 repesctively. The summary of the result are tabulated in the Table 11.
0 0.1 0.2 0.3 0.4 0.5 0.6 0.7 0.8 0.9 1 0 0.1 0.2 0.3 0.4 0.5 0.6 0.7 0.8 0.9 1 0 0.2 0.4 0.6 0.8 1 Rela tiv e P e rm e a b ility to W a te r, K rw Rela tiv e P e rm e a b ility to Oil, K ro water Saturation, Sw]
RELATIVE PERMEABILITY TO OIL (Kro) TO WATER (Krw) versus WATER SATURATION
Kro Decrease Comp
Krw Decrease Comp Krw Inc Comp
56
Table 11: Summary of Relative Permeability of Single Core and Composite Core
Type of Core Process Ordering Kro Krw
Single Core Drainage N/A 1.00 0.08
Imbibition 0.01 0.06 Composite Core Drainage Decreasing 0.80 0.06 Imbibition 0.07 0.06 Drainage Increasing 0.018 0.02
57
CHAPTER 5
CONCLUSION AND RECOMMENDATION
4.1 Project Conclusion
There are several conclusions that can be made from the project. From this project, it is understood that the usage of composite core will give effects on relative permeability tests.
Experiment has been to determine absolute permeability of the core plugs. It shows that the core plug that has high porosity does not necessarily have high value of absolute permeability. The water saturation obtained is 97% which is almost 100% hence considered as a success.
The relative permeability of single core and composite core during the tests are showing significant difference in the values hence the first objective has been met.
In addition, the arrangement of single core in composite core whether ascending of or descending of absolute permeability also give different result on relative permeability. In conclusion, this project has successfully met the objectives.
58 4.2 Recommendation
The experiment to determine the value of the absolute permeability and porosity was conducted two times for each core plug. It is found that, both parameters have different value between the experiment that has been done for first and second time. It is recommended that, the POROPERM has to be shut down for each core plug to ensure that each core plug receive adequate gas. Other than that, it is recommended that after first experiment, the core plug should be kept in the safe place. This to ensure that the core plug is not fall on the floor or contaminated.
It is better if simulation on optimum injection rate of Benchtop Permeability System can be done to confirm that the injection rate selected is the most accurate one. Besides, it is recommended if the experiment can be repeat for three times to ensure the validation of relative permeability that will be obtain. These recommendation hope to be done in the future project of the effects of using composite core on relative permeability tests.
59
REFERENCES
A. Y. Dandekar, (2007). Petroleum Reservoir Rock and Fluid Properties. United Kingdom: Taylor & Francis Group.
Cannon Instrument. 18 March 2015 <http://
https://www.cannoninstrument.com/catalog/glass_capillary_viscometers_brochure_z 05.pdf>.
C. V. Alain, C. Robert, P. Thisabnagu, 2006. Multiphysics Coupling and Long Term Behaviour in Rock Mechanics. Belgium: CRC Press.
D. B. Bennion, 1991. Recent Improvements in Experimental and Analytical Techniques for the Determination of Relative Permeability Data from Unsteady State Flow Experiemnts, SPE paper presented at the SPE 10th Technical Conference and Exposition in Port of Spain, Trinidad.
D. Yuqi, O. Bolaji, L. Dacun, 2004. Literature Review on Methods to Obtain Relative Permeability Data, paper presented at the 5th Conference & Exposition on Petroleum Geophysics in Hyderabad, India.
Dwinell, 20 March 2015 <http://www.drilling-mud.org/>.
E. F. Johnson, D. P. Bossler, V.O. Naumann, 1958. Calculation of Relative Permeability from Displacement Experiments, SPE paper Tulsa, Okla.
J. Heaviside and C.J.J Black, 1983. Fundamentals of Relative Permeability: Experimental and Theoretical Considerations, SPE paper presented at the 58th Annual Technician Conference and Exhibition in San Francisco, SA.
60
J. T. Bartley and D.W. Ruth, 2001. Experimental Investigation of Unsteady State Relative Permeability in Sand Packs, SCA paper presented at Universiti of Manitoba in Manitoba, Canada.
K. Langaas, S. Ekrann, E. Ebeltoft, 1996. The Impact of Using Composite Cores on Core Analysis Results, SCA paper presented at the Special Core Analysis Conference in Stavanger, Norway.
M. Honarpour and L. Koederitz, A.H. Harvey, 1990. Relative Permeability of Petroleum Reservoirs. Florida: CRC Press Inc.
S. T. Jones and W. O. Roszelle, 1978. Graphical Techniques for Determining Relative Permeability from Displacement Experiments. SPE paper.
T. Ahmed, (2006). Reservoir Engineering Handbook. Burlington: Gulf Professional Publishing.
T. M. Tao, 1984. Accuracy of JBN Estimates of relative Permeability: Part 1- Error Analysis, SPE Paper presented at A&M University in Texas, USA.
T. M. Tao, 1984. Accuracy of JBN Estimates of relative Permeability: Part 2- Algorithms, SPE Paper presented at A&M University in Texas, USA.
P. Glover, 2013. Relative Permeability, University of Nottingham, UK.
Y. Zekri, R. A. Almehaideb, 2002. Relative Permeability Measurements of Composite Cores an Experimental Approach, SPE paper presented at SPE Asia Pacific Oil and Gas Conference and Exhibition in Melbourne, Australia.