UNIVERSITY OF THE WESTERN CAPE
Autonomous Facial Expression
Recognition using the Facial Action
Coding System
by
Nathan de la Cruz
A thesis submitted in fulfillment for the degree of Master of Science
in the Faculty of Science
Department of Computer Science
Supervisor: Mehrdad Ghaziasgar Co-supervisor: James Connan
March 2016
I, Nathan de la Cruz, declare that this thesis “Autonomous Facial Expression Recog-nition using the Facial Action Coding System” is my own work, that it has not been submitted before for any degree or assessment at any other university, and that all the sources I have used or quoted have been indicated and acknowledged by means of com-plete references. Signature: . . . Date: . . . . i 16 March 2016
“Imagination is more important than knowledge. For knowledge is limited to all we now know and understand, while imagination embraces the entire world, and all there ever will be to know and understand.”
Albert Einstein
Abstract
The South African Sign Language research group at the University of the Western Cape is in the process of creating a fully-fledged machine translation system to automati-cally translate between South African Sign Language and English. A major component of the system is the ability to accurately recognise facial expressions, which are used to convey emphasis, tone and mood within South African Sign Language sentences. Traditionally, facial expression recognition research has taken one of two paths: either recognising whole facial expressions of which there are six i.e. anger, disgust, fear, happi-ness, sadhappi-ness, surprise, as well as the neutral expression; or recognising the fundamental components of facial expressions as defined by the Facial Action Coding System in the form of Action Units. Action Units are directly related to the motion of specific muscles in the face, combinations of which are used to form any facial expression. This research investigates enhanced recognition of whole facial expressions by means of a hybrid ap-proach that combines traditional whole facial expression recognition with Action Unit recognition to achieve an enhanced classification approach.
Keywords
South African Sign Language, Facial Expression Recognition, Facial Action Coding Sys-tem, Action Units, Whole Facial Expressions, Face Detection, Haar Features, Dense Optical Flow, Support Vector Machine.
iii
I would like to thank all of my loved ones for their support and encouragement through-out the duration of my thesis. I would especially like to thank Cassidy for her words of wisdom and motivation and always being there in times of stress. Your words inspired and uplifted me. I am so grateful to have you in my life. Also, thank you for reviewing and editing my work and making sure I sounded smarter than what I actually am. I would like to thank my mother for her prayers and her unwavering support. You would sacrifice the world for me and for that reason I am truly blessed.
I would like to thank my supervisor, Mehrdad Ghaziasgar for his guidance and patience with me. You have gone above and beyond what is expected of a supervisor. I thank you for all of your help in the completion of this research. To my co-supervisor James Connan, Thank you for your support and guidance on how to approach this research. And finally, to my colleagues Roland, Waleed and Kenzo, I thank you for always making it a pleasure to come to campus everyday. You all have made my experience at the University of the Western Cape a good one.
Contents
Declaration of Authorship i
Abstract iii
Keywords iii
Acknowledgements iv
List of Figures viii
List of Tables x
Abbreviations xii
1 Introduction 1
1.1 Background and Motivation . . . 1
1.2 Research Question . . . 4 1.3 Research Objectives . . . 4 1.4 Premises . . . 5 1.5 Methodology . . . 5 1.6 Thesis Outline . . . 7 2 Related Work 8 2.1 Action Unit Recognition Systems . . . 8
2.2 Whole Facial Expression Recognition Systems . . . 14
2.3 Hybrid Facial Expression Recognition Systems . . . 20
2.4 Summary and Conclusion . . . 26
3 Image Processing Techniques for Facial Expression Recognition 28 3.1 Face Detection and Segmentation . . . 28
3.1.1 Haar-Like Wavelet Feature Detection. . . 29
3.1.2 Integral Image . . . 30
3.1.3 AdaBoost Learning Algorithm . . . 31
3.1.4 Producing a Rejection Cascade of Weak Classifiers . . . 31
v
3.1.5 Analysis of the Viola-Jones Face Detection System . . . 32
3.2 Feature Extraction . . . 33
3.2.1 Dense Optical Flow Tracking . . . 33
3.2.2 Farneback Dense Flow Polynomial Expansion . . . 35
3.2.3 Estimation of Displacement . . . 36
3.3 Classification . . . 37
3.3.1 SVM Classification Process . . . 38
3.3.2 Adaptation of the SVM for Non-Linear Problem Classification . . 41
3.3.3 Kernel Functions . . . 42
3.3.4 Multi-class SVM Classification Techniques. . . 42
3.3.4.1 One-Versus-All . . . 43
3.3.4.2 One-Versus-One . . . 43
3.3.4.3 Directed Acyclic Graph . . . 43
3.4 Summary . . . 44
4 Design and Implementation of the Facial Expression Recognition Sys-tem 45 4.1 Face Detection and Segmentation . . . 45
4.1.1 Whole Face Segmentation . . . 47
4.1.2 Upper Face Segmentation . . . 48
4.1.3 Lower Face Segmentation . . . 48
4.2 Feature Extraction . . . 49 4.3 Classification . . . 51 4.3.1 WFE Method. . . 51 4.3.2 AU Method . . . 51 4.3.3 HybridWFEFirst Method . . . 56 4.3.4 HybridAUFirst Method . . . 56 4.4 Training of Classifiers . . . 59 4.4.1 Training Dataset . . . 59 4.4.2 SVM Optimization Procedure . . . 60
4.4.3 Training of the AU Classifiers . . . 60
4.4.4 Training of the Whole Facial Expression Multi-Class Classifiers . . 61
4.5 Summary . . . 63
5 Design and Implementation of the Facial Expression Recognition Sys-tem 64 5.1 AU Recognition Accuracy Experiment . . . 65
5.1.1 Criterion for a Correctly Recognised AU . . . 65
5.1.2 Experimental Procedure . . . 65
5.1.3 Results and Analysis . . . 66
5.1.3.1 Overview of Results . . . 67
5.1.3.2 Global VS Local Segmentation for AU Recognition. . . . 71
5.2 Facial Expression Recognition Accuracy Experiment . . . 73
5.2.1 Criterion for a Correctly Recognised Facial Expression . . . 73
5.2.2 Experimental Procedure . . . 73
5.2.3 Results and Analysis . . . 74
5.2.3.1 WFE Method Accuracy Results and Analysis. . . 74
5.2.3.2 AU Method Accuracy Results and Analysis . . . 77
5.2.3.3 HybridWFEFirst Method Accuracy Results and Analysis 79
5.2.3.4 HybridAUFirst Method Accuracy Results and Analysis . 81
5.2.3.5 Comparison of Methods . . . 83
5.3 Summary and Conclusions . . . 87
6 Conclusion 89
6.1 Future Work . . . 90
6.2 Concluding Remarks . . . 91
A Additional Test Results 92
Bibliography 97
List of Figures
1.1 The DSR methodology’s iterative cycle [69]. . . 6
2.1 Custom template consisting of 22 feature points used by Kapoor et al. [37]. 9 2.2 The set of upper face AUs recognised by Kapooret al.’s system [37]. . . . 9
2.3 System overview of Lien et al.’s system [44]. . . 11
2.4 AUs recognised by Lien et al.’s system and their descriptions [44]. . . 12
2.5 An example of the feature point tracking used by Lien et al. [44]. . . 12
2.6 An example of dense optical flow computation [44]. . . 13
2.7 Features that are manually placed on the image in the normalisation method used by Cohnet al. [11]. . . 14
2.8 The six basic emotional expressions [13]. . . 15
2.9 Active Appearance Models Used by Datcu and Rothkranz [13]. . . 15
2.10 Isolated frontal face obtained by Mushfieldt et al.’s face segmentation procedure [49]. . . 17
2.11 Isolated side-view of the face obtained by Mushfieldtet al.’s face segmen-tation procedure [49]. . . 18
2.12 The normalisation procedure used by Mushfieldt et al. to correct for misalignment of the face [49]. . . 18
2.13 Superimposed grid of feature points used by Schweigeret al. [62]. . . 19
2.14 Facial points inserted on the frontal-view of the face as used by Panticet al. [55]. . . 21
2.15 Facial points inserted on the side view of the face, used by Panticet al. [55]. . . 23
2.16 An example of the feature map used by Panticet al. [55]. . . 23
2.17 Active contour models computed for the eyebrows, eyes and mouth by Panticet al. [55]. . . 24
2.18 Manually initialised regions drawn on the face by Yacoob and Davis [74]. 25 3.1 Haar-like features [68]. . . 29
3.2 A visual description of the integral image representation [68]. . . 30
3.3 An example of an integral image computed from a target image [68]. . . . 31
3.4 Computation a haar-like feature using lookups from the integral image [68]. 31 3.5 A rejection cascade of weak classifiers [68]. . . 32
3.6 Various examples of the Viola-Jones face detection algorithm in operation [68]. . . 32
3.7 Example frames of running and writing and their resultant dense optical motion flows [40]. . . 35
3.8 The dense flow displacement computation over two frames [24]. . . 37
3.9 A two-class classification problem [12]. . . 38
viii
3.10 The optimal hyperplane that separates the two classes with a maximum
margin [12]. . . 39
3.11 Directed Acyclic Graph of a 4-class problem [58]. . . 44
4.1 Processing overview of the proposed FER system.. . . 46
4.2 The Viola-Jones algorithm detects the face. . . 47
4.3 The Viola-Jones algorithm detects the eye-pair. . . 47
4.4 Isolated face after the whole face segmentation procedure. . . 48
4.5 Isolated face after the upper face segmentation procedure. . . 48
4.6 Isolated face after the lower face segmentation procedure. . . 48
4.7 An example motion flow, showing its independent horizontal and vertical flows. . . 50
4.8 The six basic emotional expressions recognised. . . 52
4.9 An overview of theWFE method. . . 52
4.10 An overview of theAU method. . . 53
4.11 Depictions and descriptions of the 16 AUs in the upper and lower face. . . 54
4.12 An overview of theHybridWFEFirst method. . . 57
4.13 An overview of theHybridAUFirst method. . . 58
5.1 Graphical depiction of the AU classifier recognition accuracy results for the global segmentation method (“GS”) and local segmentation method (“LS”). . . 68
5.2 Depictions and descriptions of the 16 AUs in the upper and lower face. . . 69
5.3 A graph depicting the average of the GS and LS accuracy for each AU (on the right vertical axis), sorted in ascending order of the number of training examples available for each AU (on the left vertical axis). . . 70
5.4 A graph depicting the average of the GS and LS accuracy for each AU (on the right vertical axis), sorted in ascending order of the number of training examples available for each AU (on the left vertical axis). . . 71
5.5 Recognition accuracy of the WFE method. . . 75
5.6 Recognition accuracy of the AU method. . . 78
5.7 Recognition accuracy of the HybridWFEFirst method. . . 80
5.8 Recognition accuracy of the HybridAUFirst method. . . 82
5.9 A graphical depiction of the average accuracy of each method across all six emotions. . . 84
5.10 A graphical depiction of the accuracy of each FER method per expression. 86
List of Tables
2.1 AU recognition accuracy of Kapoor et al.’s system [37]. . . 10
2.2 Head gesture accuracy of Kapoor et al.’s system [37]. . . 10
2.3 Number of samples in the Cohn-Kanade dataset used by Datcu and Rothkranz [13]. . . 16
2.4 Confusion matrix of the static approach of Datcu and Rothkranz [13]. . . 16
2.5 Confusion matrix of the temporal approach of Datcu and Rothkranz [13]. 17
2.6 Frontal and rotated FER accuracy of Mushfieldt et al.’s system [49]. . . . 18
2.7 Confusion matrix of Schweiger et al.’s classifier [62]. . . 20
2.8 Production rules used by Pantic et al. to infer the six basic emotional expressions from combinations of AUs [55]. . . 20
2.9 Facial features used by Pantic et al. to characterise frontal and rotated faces [55]. . . 22
2.10 Mouth and chin features used by Panticet al. to characterise frontal faces only [55]. . . 22
2.11 Confusion matrix of Panticet al.’s classifier [55]. . . 24
2.12 Yacoob and Davis’ dictionary that describes the local directional motions in the mouth region, where W denotes the rectangular window around the feature [74]. . . 25
3.1 Processing time (in ms) per frame of the three dense optical flow methods compared by Le Bek, averaged over 100 frames [40]. . . 35
4.1 Production rules used to infer the six basic emotional expressions using AUs [55]. . . 55
4.2 Intrinsic accuracy Vi of, and the type of segmentation (“Segm. Type”) used by, each final AU classifier. . . 55
4.3 Reference maximum value MPj of the production rule Pj of each
expres-sion Ej. . . 56 4.4 Number of positive sequences available in the dataset for each AU and
the number of sequences used to train each AU classifier. . . 61
4.5 Optimized parameter values for each AU classifier for global and local segmentation. . . 62
4.6 Number of sequences available in the dataset for each emotion and the number of sequences of each emotion used to train the multi-class classifiers. 62
4.7 Optimized parameter values for the multi-class classifier of theWFE and
HybridAUFirst method. . . 63
5.1 Number of positive sequences available in the dataset for each AU and the number of sequences used to test each AU classifier. . . 66
x
5.2 AU classifier recognition accuracy results for the global segmentation
method (“GS”) and local segmentation method (“LS”). . . 67
5.3 The testing data used in the FER accuracy experimentation. . . 74
5.4 Facial expression recognition results of the WFE method. . . 74
5.5 Confusion matrix of theWFE method accuracy results. . . 76
5.6 Facial expression recognition results of the AU method. . . 77
5.7 Confusion matrix of theAU method accuracy results. . . 78
5.8 Facial expression recognition results of the HybridWFEFirst method.. . . 79
5.9 Confusion matrix of theHybridWFEFirst method accuracy results. . . 81
5.10 Facial expression recognition results of theHybridAUFirst method. . . 82
5.11 Confusion matrix of theHybridAUFirst method accuracy results. . . 83
5.12 Results of McNemar’s test for comparing the four FER methods. . . 85
A.1 AU classifier recognition accuracy results. . . 92
A.2 Facial expression recognition results of the four methods: AU, WFE, HybridWFEFirst and HybridAUFirst. . . 93
A.3 Confusion matrix of the WFE method accuracy results. . . 94
A.4 Confusion matrix of the AU method accuracy results. . . 94
A.5 Confusion matrix of the HybridWFEFirst method accuracy results.. . . . 94
A.6 Confusion matrix of the HybridAUFirst method accuracy results. . . 94
A.7 McNemar’s Test for the WFE and AU methods. . . 95
A.8 McNemar’s Test for the WFE and HybridWFEFirst methods.. . . 95
A.9 McNemar’s Test for the WFE and HybridAUFirst methods. . . 95
A.10 McNemar’s Test for the AU and HybridWFEFirst methods. . . 95
A.11 McNemar’s Test for the AU and HybridAUFirst methods. . . 95
A.12 McNemar’s Test for the HybridWFEFirst and HybridAUFirst methods. . 96
Abbreviations
FACS FacialAction Coding System
FER FacialExpression Recognition
AU Action Unit
WFE Whole FacialExpression
SASL SouthAfricanSignLanguage
DSR DesignScienceResearch
CUDA ComputeUnifiedDeviceArchitecture
SVM SupportVector Machines
HMM Hidden Markov Model
LDA LinearDiscriminant Analysis
PCA PrincipalComponent Analysis
AAM ActiveAppearance Model
CCA ConnectedComponents Analysis
ISFER IntegratedSystem forFacialExpressionRecognition
LBP LocalBinaryPatterns
GS GlobalSegmentation
LS LocalSegmentation
CPU Central Processing Unit
GPU GraphicsProcessing Unit
GB Gigabyte
GHz Gigahertz
RAM RandomAccessMemory
IR Infra -Red
BU-3DFE BinghamtonUniversity 3D FacialExpression
RBF RadialBasisFunction
DAG Directed AcyclicGraph
xii
ROI Region Of Interest
CK+ extendedCohn - Kanade
Chapter 1
Introduction
1.1
Background and Motivation
Facial expressions are universally indistinguishable; each are innate human traits that are commonly found all over the world, suggesting that they can be characterised and recognised. This idea is supported by the research of Ekman and Friesen which models muscle movements in the face and can be extended to characterise facial expressions [19,20].
It was not always a known fact that facial expressions are universal and consistent across cultures. It was a fiercely contested subject as anthropologists and psychologists had been grappling with this question for decades. Darwin suggested that facial expressions are universally similar based on his theory of evolution [17]. However, the research community were not convinced as there was no general consensus. Ekman and Friesen conducted studies on subjects from eastern and western cultures in 1971, and they concluded that facial expressions were indeed similar across cultures [17]. Even though the results of this study were well accepted, Russell questioned the fact that facial expressions could be universally recognised and wrote a paper critiquing Ekman and Friesen’s results in 1994 [60]. Later that year, Izard [35] and Ekman [16] responded to Russell’s critique with strong evidence, and refuted the claims that Russell made. Since then, it has been an established fact that facial expressions can be recognised across cultures.
The model developed by Ekman and Friesen is known as the Facial Action Coding Sys-tem (FACS) [18], where individual or combinations of distinct facial muscle movements are identified by Action Units (AUs) [15]. The FACS defines 44 unique AUs. Of these, 30 AUs are linked to the contraction of muscles in the face, made up of 12 muscles
1
situated in the upper region of the face and 18, situated in the lower region of the face. It was observed that over 7000 distinct AU combinations are possible [61]. Ekman found that a subset of AUs related to contractions in the face can be coded to describe six basic emotional expressions, namely: Happy, Sadness, Anger, Disgust, Fear and Surprise [19,20]. These are also referred to as whole facial expressions (WFEs).
A substantial amount of research has been geared towards recognising AUs using com-puter vision. Applications of these vary from deception detection [43, 57], to emotion detection [22] and sign language recognition [49]. The research presented in this thesis is done in the context of sign language recognition and undertaken as a part of the South African Sign Language (SASL) project at the University of the Western Cape.
The SASL project involves the development of a real-time machine translation system that seamlessly translates between English and SASL [30]. It is a necessary part of this system to use computer vision to extract semantic information from a video of a deaf person communicating in SASL. The semantic information extracted from sign language video is characterized by five fundamental sign language parameters [30,33, 49]: hand motion, hand orientation, hand location, hand shape, and facial expressions. The first four parameters are collectively referred to as manual gesture parameters.
The SASL project has carried out extensive research in recognising manual gesture parameters. Achmed [1, 2] developed a system that detects the location of the hands and motions of the arms. Brown [7,8] extended Achmed’s work to run on the Graphics Processing Unit (GPU) using the Compute Unified Device Architecture (CUDA) to enhance the processing speed of the existing system. Li [41,42] developed a hand shape estimation system utilizing a 3D avatar to render the hand shapes. Foster [25,26] used Li’s feature extraction procedure and carried out an extensive comparison of machine learning techniques to determine the most accurate and appropriate technique with the approach.
On a separate but related front, Rajah [59] and Naidoo [50, 51] developed systems to recognise SASL gestures based only on the extracted hand motion parameter. Nel [53,54] and Frieslaar [27,28] greatly extended the gesture recognition capabilities of these two systems by combining two parameters towards gesture recognition. Nel extracted and used the hand shape and location, while Frieslaar used the hand shape and motion to characterize gestures.
The SASL project has also carried out research into facial expression recognition, and this will be mentioned shortly. Facial expressions communicate non-verbal cues and help to convey tone in conversation. They are also an important component of sign language communication as mood and tonality are conveyed by the face, and both can be
misconstrued without facial expressions. Research has found that a deaf individual’s eye-gaze is concentrated mainly on the facial region when in a sign-language conversation, particularly around the mouth region [10,48].
For this reason, the proposed research focuses on recognising facial expressions. The majority of facial expression recognition (FER) systems fall into one of two major classes which shall henceforth be referred to as the “traditional” approaches. The first class of systems aim to recognise sub-units of facial expressions, mainly by recognising individual AUs or combinations of AUs, without any form of collation to infer, or concern towards recognising, WFEs [23,44,64]. The second class of systems aim to recognise WFEs on a global scale, disregarding AUs or any other facial subunits altogether [47,56].
A third class of systems also exists in the form of hybrid systems that first recognise smaller subunits of facial expressions such as AUs and subsequently use the recognised subunits as descriptors to recognise the six basic emotional expressions. One such system [55] does so by means of a set of production rules proposed by Ekman and Friesen [18]. These rules explicitly specify various AUs that are present while each of the six basic emotional expressions are performed. Generally, however, very little research has been conducted in this area, especially regarding using AUs to recognise WFEs. More impor-tantly, no comparisons have been carried out to determine how such hybrid approaches may compare with traditional WFE recognition approaches.
In terms of research into the recognition of facial expressions, the SASL project has mainly focused on the first class of systems in which AUs in the face are recognised using the FACS. Whitehill [70,71] recognised muscle movements in the face characterised by AUs using Haar features and the AdaBoost algorithm for classification. Whitehill compared the effectiveness of using global versus local segmentation in his endeavour. Sheikh [63] utilised Support Vector Machines (SVMs) trained on Gabor-filter images to create an AU recognition system and analyse the effect of noise degraded images on the system. Vadapalli [66, 67] developed an AU recognition system using Gabor filters to be trained using two machine learning techniques, namely, recurrent neural networks and SVMs. All of these systems were found to be highly successful at detecting and recognising AUs.
Along with the above research, the SASL project has also conducted research into recog-nising WFEs corresponding to the second class of systems. Mushfieldt [49] created a FER system that recognised the six basic emotional expressions at different levels of rotation and partial occlusion of the face. He used Local Binary Patterns (LBP) as his feature extraction technique and SVMs for classification.
This research seeks to transcend and combine the two classes that FER systems are grouped into by proposing and implementing hybrid systems that first recognise AUs and subsequently use the AUs as descriptors of the six basic emotional expressions to then recognise these expressions. More importantly, it pioneers an attempt at comparing such hybrid approaches with the traditional WFE approaches of FER under the same experimental conditions. This will help determine whether taking a hybrid approach is more advantageous than the traditional approaches.
When recognising AUs, an additional question that arises is whether to use features from the entire face—global segmentation of the face—or only local regions of the face in which each specific AU is known to occur—local segmentation—during recognition. It may be that global segmentation may provide invisible but important features from the entire face that may enhance AU recognition. On the other hand, it may be that carrying out local segmentation may lead to enhanced accuracy if the recognition of AUs is truly only dependent on the region of the face within which they occur. This comparison is also carried out in this research.
The proposed research utilizes a motion-based feature extraction technique in the form of dense optical flow to characterise facial expressions and AUs, and uses SVMs to detect AUs and recognise facial expressions.
1.2
Research Question
The following research questions are specified based on the previous section:
1. Can robust autonomous hybrid FER systems be created utilising the FACS towards recognition of WFEs?
2. How do the hybrid approaches compare with traditional whole FER approaches in terms of FER accuracy?
3. How does the use of local and global segmentation of the face during feature extraction compare towards AU recognition accuracy?
1.3
Research Objectives
The following objectives will be met in order to answer the research questions mentioned in the previous section:
1. Implement an autonomous FER strategy that uses facial features to recognise the six basic emotional expressions.
2. Implement an autonomous FER strategy that recognises AUs and uses these with Ekman and Friesen’s rules to infer and recognise the six basic emotional expres-sions.
3. Propose and implement hybrid FER systems that combine the two FER ap-proaches.
4. Compare the use of global segmentation to local segmentation in terms of AU recognition accuracy.
5. Compare the hybrid and traditional approaches in terms of whole FER accuracy.
1.4
Premises
The following assumptions are made in this research:
• It is assumed that the user will stand or sit facing the web camera. This assumption is justified as a sign language conversation usually involves persons facing each other.
• It is assumed that only one user is present in view of the web camera at any time while performing the facial expressions. This assumption is justified as it is typical for a person to isolate themselves when conversing in loud or busy environments.
• It is assumed that the user will be of arbitrary skin colour, in front of an arbitrary background and under natural lighting. These assumptions add significant com-plexity to the proposed implementation but are necessary given that the SASL requires a final system that allows for the most natural setting.
1.5
Methodology
This research utilises the Design Science Research (DSR) methodology to help guide the modelling, implementation and analysis of components necessary for the development of the proposed FER implementations, and to help address the research questions presented in a previous section. The DSR methodology was chosen for its scientific theoretical perspective, which is necessary as this research will require a more objective approach
Figure 1.1: The DSR methodology’s iterative cycle [69].
needing quantitative methods for analysis [29]. The DSR methodology’s iterative cycle can be defined by it’s six distinctive stages depicted in Figure 1.1[69].
These stages are elaborated on and contextualised as follows:
• Identify: This stage refers to recognising the problem, justifying the value of a solution and defining objectives for the specific problem. In Sections 1.1 of this chapter, the problem was clearly identified and the value of a solution was mo-tivated. Research questions that further constrained the research problem were put forward in Section 1.2 and Section 1.3 discussed the goals required to solve the research problem. Chapter 2 discusses current solutions and identifies and demonstrates the research problem in greater depth which is necessary for the identification stage. The chapter also provides a basis for the proposed implemen-tation in subsequent stages of the methodology.
• Build and Document: These stages can be grouped together according to Brocke and Buddendick[69]. These stages refer to the design and development process in which an artefact capable of solving the problem—the “solution”—is developed and the representation of the artefact is created and documented. Chapter 3 dis-cusses the methods and techniques that are used to develop the proposed artefact. Chapter4discusses the application of these methods and techniques in the context of this research. The chapter also represents and documents the creation of the solution in the form of clear descriptions, illustrations and flow diagrams.
• Select and Evaluate: These stages refer to establishing techniques to evaluate the developed solution. The evaluation criteria was described as “FER accuracy” in Section 1.2 but is further defined before testing and analysis is conducted. Chapter5discusses the method used to evaluate the solution and defines the eval-uation criteria used in greater detail and the solution is then tested and analysed according to that method.
• Communicate: This stage refers to identifying the effectiveness and novelty of the solution and using the results obtained as additional requirements for a possible further iteration of the DSR cycle to solve other instances of the problem. Chapter
6discusses the effectiveness, novelty and limitations of the proposed solution. This research limits itself to a single iteration of the DSR cycle but the chapter also puts forth recommendations for future work, thereby identifying potential areas of improvement for further iterations of the cycle in future.
1.6
Thesis Outline
The remainder of the thesis is arranged as follows:
Chapter 2: Related Work: This chapter discusses existing solutions in the field of FER under each of the categories of FER systems described in this chapter. This is used to further demonstrate the research problem and provide feedback into the proposed implementations.
Chapter 3: Image Processing Techniques for Facial Expression Recognition: This chap-ter discusses the face detection, face segmentation, feature extraction, and machine learning methods that are used in the proposed FER implementations.
Chapter 4: Design and Implementation of the Facial Expression Recognition Systems: This chapter provides an overview of the proposed FER systems and discusses the im-plementation of the proposed methods presented in Chapter3.
Chapter 5: Experimental Results and Analysis: This chapter defines the techniques used to evaluate and compare the FER systems. The FER systems are then trained, tested and analysed based on the evaluation criteria in order to provide a definitive answer to the research questions.
Chapter 6: Conclusion: This chapter concludes the thesis by providing a summary of the findings from the previous chapter, highlighting the novelty, effectiveness and limitations of the proposed FER system and provides directions for future work.
Chapter 2
Related Work
This chapter provides an overview of existing facial expression recognition (FER) sys-tems.
As mentioned in the previous chapter, FER systems are of three main types. The first two types are those that carry out recognition of whole facial expressions and those that recognise smaller fundamental features of facial expressions such as AUs within facial expressions. The third type of systems are those that are hybrid approaches i.e. they recognise smaller fundamental features of facial expressions and use them towards the recognition of whole facial expressions (WFEs).
The chapter will be subdivided into four sections. The first section discusses existing systems that perform AU recognition. The second section discusses existing systems that detect WFEs, referring to the six basic emotional expressions mentioned in the previous chapter. The third section discusses hybrid systems in which fundamental facial expression features are detected and then coded to recognise WFEs. Finally, the chapter is concluded by reflecting on the discussed FER systems and pinpointing the motivation that gives this research purpose.
2.1
Action Unit Recognition Systems
Kapoor et al. [37] developed an autonomous system that recognises AUs around the brow and eye region utilizing the FACS as a guideline. The system requires an Infra-Red (IR) camera to perform the preprocessing involving detecting the pupils using the red-eye effect. Once the pupils are detected, two custom templates of feature points are superimposed on the face. Figure 2.1 depicts the custom template consisting of eight
8
points around the contours of each eye and three points along each eyebrow, resulting in a total of 22 points describing the shape of the eyes and eyebrows.
Figure 2.1: Custom template consisting of 22 feature points used by Kapoor et al.
[37].
Instead of tracking the displacements of the points, the shape parameters of the eyes and eyebrows are used as feature descriptors for recognition. The AU recognition strategy uses Support Vector Machines (SVMs) as the classification method in which static frontal face images are trained and tested. The SVM is trained to recognise nine AUs or combinations of AUs along with the neutral expression. The set of AUs recognised by the system is depicted in Figure2.2. The system also recognises head shakes and head nods by tracking the pupils through a series of frames and using the movement as input to a trained Hidden Markov Model (HMM) where five observation symbols are defined namely, Up, Down, Left, Right and None.
Figure 2.2: The set of upper face AUs recognised by Kapoor et al.’s system [37].
Two databases were independently sourced to evaluate the effectiveness of the system. The first database consisted of spontaneous AUs acquired by filming eight children in a real-life learning situation. The children were asked to play a game known as Fripple Place [14]. The game required the children to use mathematical reasoning while completing a variety of puzzles. Each child was given 20 minutes to work on the puzzles, and two cameras recorded the facial expressions of each child during this time. A trained FACS expert labelled the videos, indicating the AUs that were present in each frame. A total of 80 frames were manually chosen to test the system. The system achieved
an average accuracy of 61.25% in recognizing combinations of AUs and the neutral expression. Table2.1 shows how well each combination of AUs were recognised.
Actual No. of Fully Partially Misses % Full
AUs Samples Recognised Recognised Misses Correct
1+2 12 9 1 2 75 1+2+5 19 11 3 5 57.9 1+2+6+7 2 0 2 0 0 1+4 2 0 2 0 0 4 10 5 0 5 50 5 5 5 0 0 100 7 6 3 0 3 50 4+7 4 2 1 1 50 6+7 1 0 0 1 0 Neutral 19 14 0 5 73.7 Total 80 49 9 22 61.25
Table 2.1: AU recognition accuracy of Kapoor et al.’s system [37].
The second database consists of 10 subjects comprising an equal number of male and female subjects. The subjects were asked to shake and nod their heads while being filmed. 110 sequences were collected; 62 head nod and 48 head shake sequences. The system was then tested using the HMM for classification and received a combined average accuracy of 78.46% in recognizing head shakes and head nods. Table 2.2 shows the recognition results for head shakes and head nods using a testing sample of 65 sequences.
Recognised Misses
Nods 30 7
Shakes 21 7
Table 2.2: Head gesture accuracy of Kapoor et al.’s system [37].
Lien et al. [44] conducted a study to compare four AU recognition strategies. The strategies utilize one of three feature extraction techniques: facial feature tracking, dense flow or high gradient component detection. The strategies also utilize one of two machine learning techniques: Hidden Markov Models (HMM) or Linear Discriminant Analysis (LDA). A system overview of Lien’s system is depicted in Figure 2.3.
The study aimed to detect 12 AUs following the FACS [18] guidelines. As such the face was segmented into an upper and lower region. The upper region consisted of three AUs in both the brow and eye area. The lower region consisted of six AUs in the mouth area. The descriptions and illustrations of the detected AUs are depicted in Figure2.4. The system detected not only individual AUs but combinations of AUs as well. Before segmenting the face, normalization of all the faces in the sequence was carried out by
Figure 2.3: System overview of Lienet al.’s system [44].
performing a perspective transformation. This was done as expressions often occur with slight head movement. For example, a subject may raise their head when surprised. The perspective transformation looks to keep the face at the same position and orientation throughout the image sequence but this comes at a high computational cost and slows down the system quite considerably.
The Lucas-Kanade optical flow algorithm [45] was used as the facial feature tracking technique as it was described as the standard technique to estimate feature point move-ment efficiently. The method, however, requires that the points be manually marked in the first frame and, considering that there are 38 points that need to be marked, this manual procedure becomes very time consuming. Six points are marked around the contours of the brows, eight points around the eyes, 10 points around the mouth and 14 points around the nose. Figure 2.5 shows an example of the feature point tracking where the points are manually located on the leftmost image and thereafter automati-cally tracked in the consecutive frames, resulting in the activation of AU 1+2 and AU 26.
The dense flow extraction method used in the study is based on the research of Wu et al. [73] who developed a method to track displacement vectors using a coarse-to-fine
Figure 2.4: AUs recognised by Lien et al.’s system and their descriptions [44].
Figure 2.5: An example of the feature point tracking used by Lienet al. [44].
Cai-Wang wavelet representation. The wavelet model does this by representing motion vectors by a linear combination of hierarchical basis functions. The basis functions are able to alter any function into wavelet coefficients of either coarse to fine scales. The Cai-Wang dense flow is sensitive to small movements and is much more consistent when used on smoothly textured images. The biggest downfall of the Cai-Wang dense flow method, which is a very significant downfall, is its severely slow computation speed. Even when Principal Component Analysis (PCA) is used to reduce the dimensions of the flow fields, the algorithm still takes approximately 20 minutes per pair of frames when computing on an SGI-Irix workstation. An example of this dense flow extraction technique is depicted in Figure2.6.
Figure 2.6: An example of dense optical flow computation [44].
The database used to train and test the system was independently sourced and consisted of 100 male and female adults of either European, Asian or African heritage between the ages of 18 and 35 years. The subjects sat directly in front of a camera and were asked to perform a series of facial expression sequences, each starting from the neutral expression, as is especially required for the HMM to use as its symbol sequence.
The two best performing strategies in the brow region were the dense flow tracking with HMMs which received an average recognition accuracy of 92% and facial feature point tracking with LDA receiving a recognition accuracy of 91%. The best performing strategy in the mouth region was once again the dense flow tracking with HMMs receiving an average recognition accuracy of 92%, followed by the facial feature tracking with HMMs which achieved an average recognition accuracy of 88%.
It is quite clear that dense flow with HMMs performed the best overall but required more computation, as a result of which the strategy was slower. However, it could be improved upon by substituting an affine transformation in place of the perspective transformation to align the faces. The affine transformation requires significantly less computation and, even though it is not as accurate when warping higher degrees of out of plane rotations, it performs well with relatively small movements of the head observed when performing various facial expressions. Also, the Cai-Wang dense flow algorithm can be substituted with either the Horn-Schunck [32], Lucas-Kanade [45] or Farneback [24] dense flow algorithms, all of which perform equally well in tracking movements in the face, and are more efficient at doing so.
Cohn et al. [11] developed a system to recognise a set of specific AUs using Ekman’s FACS guidelines [18]. The system normalizes the face in the image by manually marking the medial canthus and the philtrum on the face as depicted in Figure 2.7. The system does not require any segmentation procedure given the manual normalization method implemented. The system also requires additional manual marking on the face to track 10 points in the mouth region, six in the nose region, eight in the eye region and six in the brow region resulting in a total of 30 points being manually selected on the
face for tracking. The Lucas-Kanade optical flow algorithm [45] is used to track the selected points of the face from the neutral expression to the peak of the expression. The displacement of each point is then computed by subtracting the position of the point at the peak of the expression from the initial position at the beginning of the sequence. The displacements are then separated into vertical and horizontal matrices for either the brow, eyes, nose or mouth region. The displacements are then analysed and variance-covariance matrices are created. The variance-covariance matrices are then used to predict the AUs triggered.
Figure 2.7: Features that are manually placed on the image in the normalisation method used by Cohnet al. [11].
The database used to train and test the system consisted of 504 image sequences. 872 AUs were confirmed to be present in the database which were acquired from 100 subjects recorded in front of a simple background. The database was randomly divided into training and cross-validation sets. The system achieved and overall recognition accuracy of 87% in detecting AUs. The system achieved an 83% accuracy in the nose and mouth region, 88% accuracy in the eye region and 92% accuracy in the brow region.
2.2
Whole Facial Expression Recognition Systems
Datcu and Rothkranz [13] developed a system to recognise the six basic emotions de-picted in Figure2.8 and compare the use of recognition using static images to using se-quences of images for recognition. The FER system was developed to work autonomously using the Viola-Jones face detection algorithm [68] to isolate and segment the face in an image. Once the face is segmented Active Appearance Models (AAMs) are used to model each face. The AAMs carry out modelling of the face by acquiring the face shape and texture data from the image. The AAM then computes a mean face shape depicted in Figure2.9a and mean texture illustrated in Figure2.9b which accounts for the varied textures and shapes present in the training data. The mean face shapes and textures are
then applied to each face in the testing set so as to normalize the face, making features more accurate to track.
Figure 2.8: The six basic emotional expressions [13].
Both the static images and sequences of images use feature vectors containing 17 features. The 17 features pertain to the distance between modelled points on the face acquired from the AAM. The approach that uses static images – henceforth referred to as the “static approach” – only uses the frame at the peak of the expression of each sequence to extract the 17 features whereas the approach that uses sequences of images – henceforth
(a) (b)
Figure 2.9: Active Appearance Models Used by Datcu and Rothkranz [13].
referred to as the “temporal approach” – computes the variance between each feature of the 17-dimensional feature vector, from the neutral frame to the peak of the expression.
Once the feature vectors are extracted, the system utilises an SVM to categorise the six basic emotional expressions. The Cohn-Kanade database [36] was used to train and test the system. The Cohn-Kanade database is well established and widely used in the field of AU recognition and FER. The database consists of frontal face video sequences of each of the six basic facial expressions, each progressing from the neutral expression to the peak of the expression. The number of samples used in experimentation varied for each emotion, from as little as 30 sequences for Anger to 107 sequences for Happy. A summary of the number of samples used in the experimentation can be viewed in Table
2.3.
Emotion No. of Samples
Sadness 92 Surprise 105 Anger 30 Fear 84 Disgust 56 Happy 107
Table 2.3: Number of samples in the Cohn-Kanade dataset used by Datcu and Rothkranz [13].
The system achieved a recognition accuracy of 80% when trained and tested on static facial images compared to a recognition accuracy of 85% when trained and tested on sequences of facial images. Tables2.4and2.5depict confusion matrices for the static ap-proach and temporal apap-proach, respectively. It is quite clear that the temporal apap-proach to emotion detection outperformed the static approach as it achieved better results for each of the six basic emotions.
Actual Predicted(%)
Fear Surprise Sadness Anger Disgust Happy
Fear 84.70 3.52 3.52 4.70 1.17 2.35 Surprise 12.38 83.80 0.95 0 0 2.85 Sadness 6.45 3.22 82.79 1.07 3.22 3.22 Anger 3.44 6.89 6.89 75.86 6.89 0 Dusgust 0 0 7.14 10.71 80.35 1.78 Happy 7.54 8.49 2.83 3.77 4.71 72.65
Table 2.4: Confusion matrix of the static approach of Datcu and Rothkranz [13].
One important point to be noted is that the emotion Anger was misclassified as Fear 10.71% of the time when using the temporal approach compared to 3.44% when using the
Actual Predicted(%)
Fear Surprise Sadness Anger Disgust Happy
Fear 88.09 2.38 4.76 3.57 1.19 0 Surprise 0 88.67 2.83 8.49 0 0 Sadness 5.43 2.17 85.86 2.17 1.08 3.26 Anger 10.71 0 3.57 85.71 0 0 Dusgust 5.35 5.35 3.57 1.78 82.14 1.78 Happy 4.62 0 7.40 2.77 5.55 79.62
Table 2.5: Confusion matrix of the temporal approach of Datcu and Rothkranz [13].
static image approach. This suggests that there is a link between the facial movement of anger and fear over a specific time period.
Mushfieldt et al. [49] Developed a system that detects facial macro-expressions in the presence of rotations and partial occlusions of the face. The system is capable of de-tecting both frontal face images as well as side profile faces rotated to 60 degrees. As a result, a novel combined segmentation strategy that consists of two face segmentation methods, one for the frontal case and one for the rotated case, was implemented. The frontal face segmentation method employs the Viola-Jones object detection algorithm [68] to detect both the face and the eye pair in an image. Once the face and eye pair are detected, the face is segmented by taking the region formed using the height of the detected face and the width of the detected eye pair, resulting in a facial image devoid of background noise as is illustrated in Figure2.10.
Figure 2.10: Isolated frontal face obtained by Mushfieldt et al.’s face segmentation procedure [49].
The rotated face segmentation method employs a skin detection algorithm to find the face in an image. Morphological operators such as dilate and erode are then used to distinguish the skin pixels from the pixels that might get confused with the skin. Connected Components Analysis (CCA) [5] is implemented to locate all of the skin in the image. Finally a contour map is created and the side profile of the face is isolated as can be seen in Figure 2.11.
With regard to the frontal face, a normalization technique is used to curb the effects of small misalignment variance of the head. The normalization technique detects the
Figure 2.11: Isolated side-view of the face obtained by Mushfieldt et al.’s face seg-mentation procedure [49].
eye positions using the eye detection algorithm of Nasiri et al. [52]. This highlights the eyes in the image. Once the eyes are detected, they are aligned with each other and the horizontal axis by means of an affine transformation. An illustration of the normalization procedure is depicted in Figure2.12.
Figure 2.12: The normalisation procedure used by Mushfieldt et al. to correct for misalignment of the face [49].
Local Binary Patterns (LBPs) are used to characterise and extract the facial features of the normalized face. The features are then used as input to a multi-class SVM for training and classification of the six basic emotional expressions. The Binghamton University 3D Facial Expression (BU-3DFE) database was used to test the recognition accuracy of the system. The system achieved an average accuracy of 75% for frontal face images and achieved an average accuracy of 70% for facial images rotated 60 degrees. A summary of the average FER accuracy for each emotion using frontal and rotated faces can be viewed in Table2.6.
Emotion Frontal (%) Rotated (%)
Anger 82 62 Disgust 62 52 Fear 62 50 Happy 87 95 Sadness 70 85 Surprise 90 80 Average (%) 75 70
Table 2.6: Frontal and rotated FER accuracy of Mushfieldtet al.’s system [49].
Schweiger et al. [62] developed a system to detect the six basic emotional expressions using a dense motion flow approach. The system requires the face to be manually segmented by drawing a bounding box around the face in the first frame of the video sequence. The bounding box is drawn from the top of the eyebrows to the bottom of the chin, thereby removing all sources of noise, but also requiring that the face be in the same position throughout the video sequence. It should be noted that the forehead helps convey movement in the upper half of the face so, in choosing to ignore features in the forehead, the recognition accuracy may be affected.
Once the face is manually isolated, the face is further segmented into six sub-regions by a vertical line passing through the centre of the nose and two horizontal lines, one of which passes through the centres of the eyes, and the other, across the top of the upper lip. A grid of 64 equally separated points is then superimposed on the face with each sub-region containing a subset of points. Figure 2.13 depicts an example of the segmented face with a superimposed grid of points on the face. The 64 points are then tracked through the video sequence using the Lucas-Kanade tracking algorithm [45]. The displacements of each point are then computed, followed by a calculation of the average displacement of each sub-region, resulting in a six-dimensional feature vector.
Figure 2.13: Superimposed grid of feature points used by Schweigeret al. [62].
The feature vector is then fed into a fuzzy ARTMAP Neural Network [9] to classify the six basic emotional expressions. The fuzzy ARTMAP Neural Network was chosen for its incremental supervised learning of analogue multidimensional maps. A Neural Network is created for each emotional expression whereby the average displacement of the feature vectors are evaluated and measured against the category nodes of the network. The Cohn-Kanade database was used to train and test the system. The testing phase employed a leave-one-out cross validation technique to measure the average recognition accuracy of the system.
The system ultimately achieved an average recognition accuracy of 55.84%, but this in no way reflects the true results of the system as the emotions Happy, Sadness, Surprise
and Anger achieved high recognition accuracies while Fear and Disgust received low recognition accuracies, as is illustrated by the confusion matrix in Table 2.7. Schweiger states that the results for Fear and Disgust are inconclusive, given only 8 and 10 video sequences, respectively, available to test these two expressions. It should be noted, however, that omission of the forehead could have resulted in the low accuracies of these expressions since both expressions have a significant presence in that region.
Actual Predicted Total
Happiness Sadness Surprise Anger Fear Disgust
Happiness 57 0 2 6 4 3 72 Sadness 3 26 4 8 2 0 43 Surprise 2 0 53 0 0 4 59 Anger 4 3 0 31 1 2 41 Fear 5 1 0 2 0 0 8 Disgust 5 0 0 2 0 3 10
Table 2.7: Confusion matrix of Schweigeret al.’s classifier [62].
2.3
Hybrid Facial Expression Recognition Systems
Pantic et al. [55] developed a system to detect AUs before characterising the six ba-sic emotional expressions using production rules. The production rules are based on the work of Ekman and Friesen [20, 21] who claim that emotional expressions can be characterised by AUs. The production rules are depicted in Table 2.8.
Emotion AU-Coded Description (%)
Anger 4+7+(((23 or 24) with or not 17) or (16+(25 or 26)) or (10+16+(25 or 26))) with or not 2
Disgust ((10 with or not 17) or (9 with or not 17)) + (25 or 26)
Fear (1+4) + (5+7) + 20 + (25 or 26) Happy 6+12+16+(25 or 26)
Sadness 1+4+(6 or 7)+15+17+(25 or 26) Surprise (1+2)+(5 without 7)+26
Table 2.8: Production rules used by Pantic et al. to infer the six basic emotional expressions from combinations of AUs [55].
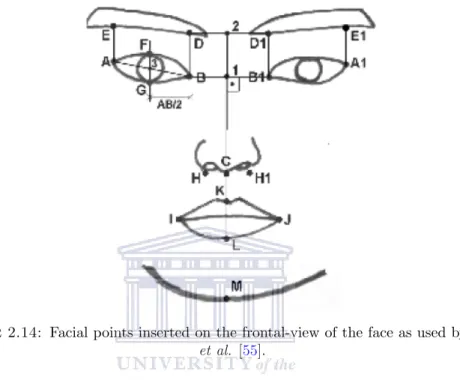
The system utilises both frontal and side view images to detect AUs. The system does not work with video sequences but instead utilizes still images. The frontal face model consists of 19 points manually inserted on the face as is depicted in Figure 2.14. Using these 19 facial points, 25 features are extracted using angles and distances between the
plotted points. The 25 features are illustrated in Table 2.9. The frontal face model consists of five additional features acquired from the shape of the mouth and chin. The mouth is represented by four specific shapes and the chin is represented by two specific shapes. A description of the five features concerned with the shape of the mouth and chin can be viewed in Table 2.10. The features are then coded to recognise a set of 27 unique AUs.
Figure 2.14: Facial points inserted on the frontal-view of the face as used by Pantic
et al. [55].
The side view model consists of 10 points marked along the contours of the side profile which is depicted in Figure2.15. The distance and curvature between the 10 points are coded to recognise 20 unique AUs. Ultimately, the models are combined to increase the quality of the face model, where the frontal view describes changes in the appearance of chin, mouth, nose, eyebrows and eyes and the side view describes changes in the appearance of the chin, jaw, mouth, nose and forehead. The combined model is also able to recognise a total of 29 unique AUs.
The system consists of two major components. The first component is known as the Integrated System for Facial Expression Recognition (ISFER) workbench. The ISFER workbench offers a wide array of feature extraction methods needed to analyse the face. The workbench first segments the face by reading in a given multi-resolution pyramid of the image and locates facial features using a raw feature map which represents a rough approximation of where the features are located. An example of the feature map is depicted in Figure 2.16. The workbench also acquires the side profile of the subject by employing Wojdelet al.’s [72] profile detector which uses the HSV colour space.
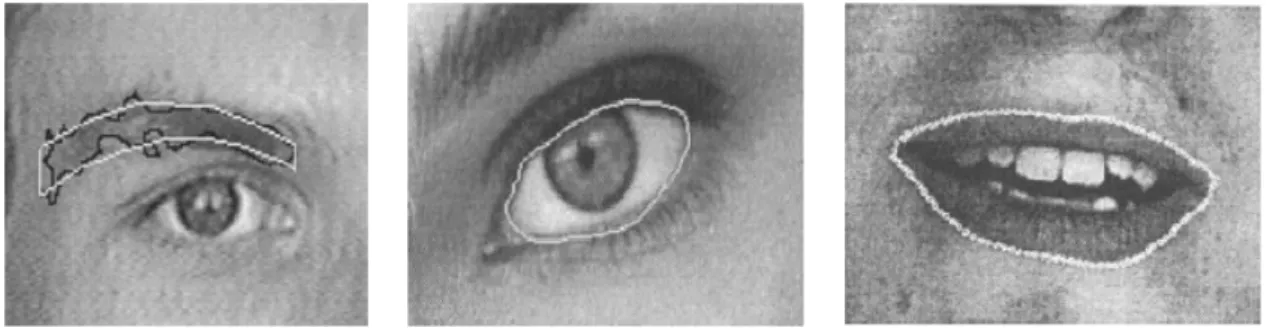
Once all the facial features are isolated, the workbench uses active contour models to identify the shapes of the eyes, eyebrows and mouth. The shapes are then curve
Feature Feature Description
f1 Angle of BAD f2 Angle of B1A1D1 f3 Distance AE f4 Distance A1E1
f5 Distance 3F, 3 is the centre of AB f6 Distance 4F1, 4 is the centre of A1B1 f7 Distance 3G f8 Distance 4G1 f9 Distance FG f10 Distance F1G1 f11 Distance CK, C is 0.5HH1 (f0) f12 Distance IB f13 Distance JB1 f14 Distance CI f15 Distance CJ f16 Distance IJ f17 Distance KL f18 Distance CM
f19 Image intensity in circle (r(0.5BB1), C(2)) above line (D, D1) f20 Image intensity in circle (r(0.5BB1), C(2)) below line (D, D1) f21 Image intensity in circle (r(0.5AB), C(A)) left from line (A, E)
f22 Image intensity in circle (r(0.5A1B1), C(A1)) right from line (A1, E1) f23 Image intensity in the left half of the circle (r(0.5BB1), C(I))
f24 Image intensity in the right half of the circle (r(0.5BB1), C(J)) f25 Brightness distribution along the line (K, L)
Table 2.9: Facial features used by Pantic et al. to characterise frontal and rotated faces [55].
fitted to further approximate the shape of the facial features. The curve fitting utilizes mathematical techniques such as parabola functions to estimate the shape of the facial features. Figure2.17depicts the result of applying the active contour models. It is noted that the workbench deals only with static images. Therefore only the neutral/initial image is compared to that of the peak image.
The second major component in the FER system is referred to as the HERCULES
Feature Feature Description
f26 Shape of lower lip when pulled downwards f27 Mouth shape when lower lip is sucked in f28 Mouth shape when cheeks are sucked in f29 Circular shape of the furrows on the chin f30 Mouth shape when the upper lip is sucked in
Table 2.10: Mouth and chin features used by Pantic et al. to characterise frontal faces only [55].
Figure 2.15: Facial points inserted on the side view of the face, used by Panticet al. [55].
inference engine which is responsible for converting low-level face geometry into high-level AUs, followed by a conversion into the high-high-level weighted emotional labels. The engine utilizes a Neural Network to recognise the AUs and the six basic emotional expressions. The database used to train and test the system was independently sourced and consists of subjects who are both male and female of either European, Asian or South American heritage between the ages of 22 to 33 years. The database consists of 496 dual-view images that have been validated by eight different FACS encoders. The FACS encoders identified 31 separately activated AUs in the dataset. The system achieved an average recognition rate of 92% for the AUs present in the upper face and 86% for AUs present in the lower face.
Figure 2.16: An example of the feature map used by Panticet al. [55].
Figure 2.17: Active contour models computed for the eyebrows, eyes and mouth by Panticet al. [55].
The emotional classification performance was tested on a set of 265 dual-view images of which 129 images contained only the six basic emotional expressions, while the re-maining images contained a blend of varied emotions. The system was then trained to recognise blended emotions. The dual-views were recorded under constant illumination using a fixed light source. None of the subjects wore glasses or had a beard or mous-tache. The system achieved an average recognition accuracy of 91% for detecting the six basic emotional expressions and blended expressions. Table 2.11 depicts the resultant confusion matrix when the test set was run through the system.
Actual Predicted (%)
Surprise Fear Disgust Anger Happiness Sadness Blinking
Surprise 97 1 0 0 0 0 2 Fear 0 84 0 0 0 9 7 Disgust 0 0 82 14 0 0 3 Anger 0 1 12 84 0 0 2 Happiness 1 0 0 0 98 0 1 Sadness 0 2 0 0 0 96 2 Blinking 3 1 0 0 2 1 93
Table 2.11: Confusion matrix of Panticet al.’s classifier [55].
Yacoob and Davis [74] developed a FER system that employs a representation of facial feature actions. The system does not utilize the FACS as it does not detect AUs but it does detect feature actions. The feature actions are then coded to characterize the six basic emotional expressions, and an additional expression ‘Blinking’. The face is first manually segmented. Six manually initialized rectangular regions are drawn on the initial frame of a sequence as is depicted in Figure 2.18. The points with the highest gradient value within the rectangular regions are then tracked throughout the sequence.
Once the points are tracked, their movements translate and scale the rectangular re-gions on the face through the series of frames. The rectangular rere-gions are referred to as “windows” and the movements of these windows act as motion cues to represent basic actions such as raising, lowering or contraction of facial features. Dictionaries for
Figure 2.18: Manually initialised regions drawn on the face by Yacoob and Davis [74].
the brow, eyes and mouth region are created which allow the local directional motion patterns to be converted into mid-level representations for facial actions. Table 2.12
illustrates a dictionary that describes the local directional motions in the mouth region, whereW denotes the rectangular window around the feature.
Component Basic Action Motion Cues
Upper Lip
Raising Upward motion ofW’s upper part Lowering Downward motion ofW’s upper part Contraction Horizontal shrinking of W’s upper part
Expansion Horizontal expansion of W’s upper part
Lower Lip
Raising Upward motion ofW’s lower part Lowering Downward motion ofW’s lower part Contraction Horizontal shrinking of W’s lower part
Expansion Horizontal expansion of W’s lower part Left Corner Raising Upward motion ofW’s left part
Lowering Downward motion ofW’s left part Right Corner Raising Upward motion of W’s right part
Lowering Downward motion of W’s right part
Mouth
Raising Upward motion throughoutW
Lowering Downward motion throughoutW
Compaction Overall shrinkage in mouth’s size Expansion Overall expansion in mouth’s size
Table 2.12: Yacoob and Davis’ dictionary that describes the local directional motions in the mouth region, whereW denotes the rectangular window around the feature [74].
The mid-level representations are then converted into emotional expressions by dividing each emotional category into three temporal components: beginning, peak and ending. Once sequences are divided into the three temporal parts, they are then modelled and used to identify other patterns that best suit the category model. The system was tested using a sample of 46 image sequences from 30 subjects, both male and females of varying skin tones. A total of 105 occurrences of the emotions recognized were present in the database. The sequences were, on average, between 8 to 16 seconds long and captured
at 30 fps. The system achieved an average recognition accuracy of 85%, receiving a recognition accuracy of 86% for Happy, 92% for Disgust, 86% for Fear, 94% for Surprise, 80% for Sadness, 92% for Anger and 65% for Blinking.
Kenji [38] developed a system similar to Yacoob and Davids in that FER is carried out using a set of predefined facial motions that are not based on the FACS. However, the system differs from Yacoob and Davids’ system in that the system does not use a dictionary to convert motion cues into mid-level representations. Instead, the system uses facial muscles to identify emotions, much like the FACS.
The system first tessellates the area of the face with rectangular regions, after which optical flow feature vectors are marked within each rectangular region. A 15-dimensional feature vector is constructed and used to represent the most important points based on the variance flow throughout the video sequence. The classification of the feature vectors is then carried out using the K-Nearest Neighbours algorithm. The system was only tested on 30 sequences which were independently sourced and received an overall recognition accuracy of 80% in recognising only four emotional expressions: Happy, Disgust, Anger and Surprise.
2.4
Summary and Conclusion
In this chapter, the three main types of FER strategies were discussed, namely, AU recognition systems, WFE recognition systems, as well as hybrid FER systems that recognise smaller fundamental features of facial expressions such as AUs and use them towards the recognition of emotional expressions. Several conclusions can be drawn from this discussion.
The discussion demonstrated that using sequences rather than static images results in a higher recognition accuracy in most cases and is a more appropriate approach.
It was also clearly demonstrated that the dense optical flow technique is a highly accurate and efficient technique that makes an excellent feature descriptor in the proposed system.
It is also very important to note that the majority of related studies include substantial manual segmentation requirements. Input images are first manually cleared of all noise before automated processing can begin. This is time-consuming, but more importantly, limits full automation, making such approaches impractical in real-world situations.
Finally, while there are systems that used hybrid approaches, none carried out compar-isons of those approaches with a version of those systems that use only the traditional approaches.
It becomes clear that it is necessary to develop a fully automatic system that can rec-ognize WFEs based on AUs and compare it to traditional approaches under the same conditions, thus justifying this research.
The next chapter discusses the key techniques used in the motion-based approach to FER proposed in this research.
Chapter 3
Image Processing Techniques for
Facial Expression Recognition
This chapter discusses the key techniques used in the autonomous motion-based ap-proach to Facial Expression Recognition (FER) undertaken in this research. The pro-posed hybrid FER system, as well as the comparative FER systems, are completely autonomous. Hence, this chapter is subdivided into three methodological components which govern all autonomous FER approaches [39]: face detection and segmentation, feature extraction, and classification. The chapter is then concluded.
3.1
Face Detection and Segmentation
Face detection is the fundamental step in many autonomous FER systems as well as many learning-based gesture recognition systems [8,51]. This is because: it can be used to pinpoint a subject in a frame; it can be used to normalize and centre a subject in the frame; and it can be used to find other objects in the frame such as the hands by using the face as a reference point. However, in this research, face detection will be used to isolate and extract the facial region from the background image.
The Viola-Jones object detection framework [68] encompasses a widely used efficient, accurate and robust implementation of face detection. As such, it has been used in the implementation of this research. The framework characterises the face using Haar-like wavelet features. The input image is converted into an intermediary image representation known as an Integral Image for faster computation of these features. The AdaBoost learning algorithm is then used to arrange a series of weak classifiers trained to recognise
28
various Haar-like features into a rejection cascade using a multi-tree classifier [6]. These steps are described in the following subsections.
3.1.1 Haar-Like Wavelet Feature Detection
Haar-like wavelet features are based on the principle of Haar wavelets and are utilized in the Viola-Jones algorithm. They are a set of two, three or four adjacent rectangular features of the same size and shape; where each rectangle is either dark or light, and are either vertically or horizontally adjacent to each other. These Haar-like wavelets are shown in the figure below (Figure 3.1).
Figure 3.1: Haar-like features [68].
The Haar-like wavelet features are passed over an image at different scales and positions. At each scale and position, the sum of the pixels corresponding to the dark regions are subtracted from the sum of the pixels in the light regions. If the computed result surpasses an acceptable threshold value, then this specific feature is considered to be present at this scale and position.
Referring to Figure 3.1, in order to compute the four rectangular features depicted in block A, the difference amongst the sum of the pixels in the diagonal pairs of rectangles is calculated and an acceptance threshold is applied. For three rectangular features depicted in block B, the sum of the image pixels within the two outer rectangles is subtracted from the sum of the image pixels in the central rectangle and an acceptance threshold is applied. For the two rectangular features depicted in blocks C and D, the difference between the sum of the pixels within the two rectangular regions is calculated and an acceptance threshold is applied [68].
Figure 3.2: A visual description of the integral image representation [68].
3.1.2 Integral Image
Computing Haar-like wavelet features passed over an image at a variety of scales and positions can be very computationally expensive. The Viola-Jones algorithm proposes an intermediary image representation known as the Integral Image which is applied to the target image. The Integral Image representation allows for fast computation of Haar-like features at any scale and position by taking the sum of all the pixels from above and to the left of a particular pixel in a target image, as will be explained [68].
Consider a given imageT, the Integral Image representationI(x, y) at any position (x, y) can be expressed in recursive form, given by the following equation:
I(x, y) =T(x, y) +I(x−1, y) +I(x, y−1)−I(x−1, y−1) (3.1)
It can be seen thatI(x, y) is just the sum of all the pixel values to the top and left of the pixel at (x, y), as can be seen in Figure 3.2 and further illustrated in Figure3.3. This can also be expressed by the following equation:
I(x, y) = X
a≤x,b≤y
T(a, b) (3.2)
An example of an Integral Image computed from a target image can be seen in Figure
3.3. An Integral Image makes the computation of Haar-like features at any scale and position with only a few lookups possible. For example, in Figure3.4, the sum of pixels in region D can be calculated by computing the sum of the Integral Image values at points 2 and 3 and subtracting it from the Integral Image value at from point 4, and adding the result to the Integral Image value at point 1. This same method is used to
![Figure 1.1: The DSR methodology’s iterative cycle [ 69].](https://thumb-us.123doks.com/thumbv2/123dok_us/10989260.2986650/20.893.242.707.123.487/figure-dsr-methodology-s-iterative-cycle.webp)
![Figure 2.3: System overview of Lien et al.’s system [ 44].](https://thumb-us.123doks.com/thumbv2/123dok_us/10989260.2986650/25.893.191.752.118.645/figure-system-overview-of-lien-et-al-system.webp)
![Figure 2.4: AUs recognised by Lien et al.’s system and their descriptions [ 44].](https://thumb-us.123doks.com/thumbv2/123dok_us/10989260.2986650/26.893.133.813.116.807/figure-aus-recognised-lien-et-al-s-descriptions.webp)
![Figure 2.8: The six basic emotional expressions [ 13].](https://thumb-us.123doks.com/thumbv2/123dok_us/10989260.2986650/29.893.205.746.186.691/figure-basic-emotional-expressions.webp)
![Table 2.4: Confusion matrix of the static approach of Datcu and Rothkranz [ 13].](https://thumb-us.123doks.com/thumbv2/123dok_us/10989260.2986650/30.893.229.719.840.1005/table-confusion-matrix-static-approach-datcu-rothkranz.webp)
![Figure 2.12: The normalisation procedure used by Mushfieldt et al. to correct for misalignment of the face [49].](https://thumb-us.123doks.com/thumbv2/123dok_us/10989260.2986650/32.893.187.763.468.631/figure-normalisation-procedure-used-mushfieldt-correct-misalignment-face.webp)
![Table 2.8: Production rules used by Pantic et al. to infer the six basic emotional expressions from combinations of AUs [55].](https://thumb-us.123doks.com/thumbv2/123dok_us/10989260.2986650/34.893.262.690.733.944/table-production-rules-pantic-infer-emotional-expressions-combinations.webp)
![Table 2.9: Facial features used by Pantic et al. to characterise frontal and rotated faces [55].](https://thumb-us.123doks.com/thumbv2/123dok_us/10989260.2986650/36.893.179.778.124.656/table-facial-features-pantic-characterise-frontal-rotated-faces.webp)