ISSN: 1693-6930
accredited by DGHE (DIKTI), Decree No: 51/Dikti/Kep/2010 139
Energy Analysis for Air Conditioning System Using
Fuzzy Logic Controller
Henry Nasution*1, Hishamuddin Jamaluddin2, Jamaluddin Mohd. Syeriff3 1
Department of Mechanical Engineering, Universitas Bung Hatta (UBH) Padang 25134, Sumatera Barat, Indonesia, Ph./Fax: +62751-7054657/7051341
1,2,3
Faculty of Mechanical Engineering, Universiti Teknologi Malaysia (UTM) Skudai, 81310 Johor, Malaysia, Ph./Fax: +607-5534575/5566159
e-mail: henrynasution@bunghatta.ac.id*1, henry@fkm.utm.my1, hishamj@fkm.utm.my2,
jamal@fkm.utm.my3
Abstrak
Mengurangi pemakaian energi dan kenyamanan ruangan merupakan dua pertimbangan yang penting pada perencanaan sistem pengkondisi udara. Pendekatan alternatif yang diusulkan untuk mengurangi pemakaian energi pada penelitian ini menggunakan kompresor dengan kecepatan bervariasi. Strategi pengendali yang diusulkan adalah dengan menggunakan kendali logika fuzi (FLC). FLC dikembangkan untuk meniru performansi pengalaman manusia dengan mengkodekan pengatahuannya dalam bentuk aturan linguistik. Seluruh sistem terpasang pada ruangan berisolasi dan untuk memonitor temperatur ruang, koefisien performansi (COP), pemakaian dan penghematan energi dengan sistem data akuisisi. Pengukuran dilakukan selama kurun waktu dua jam dengan interval selama lima menit dengan referensi temperatur 20, 22 dan 24oC dan beban pendingin sebesar 0, 500, 700 dan 1000 W. Hasil penelitian menunjukkan bahwa sistem kendali yang diusulkan dapat menghemat energi jika dibandingkan dengan kendali On/Off dan proporsional-integral-derivatif (PID).
Kata kunci: kendali logika fuzi, performansi kompresor, penghematan energi, pengkondisian udara
Abstract
Reducing energy consumption and to ensure thermal comfort are two important considerations for the designing an air conditioning system. An alternative approach to reduce energy consumption proposed in this study is to use a variable speed compressor. The control strategy will be proposed using the fuzzy logic controller (FLC). FLC was developed to imitate the performance of human expert operators by encoding their knowledge in the form of linguistic rules. The system is installed on a thermal environmental room with a data acquisition system to monitor the temperature of the room, coefficient of performance (COP), energy consumption and energy saving. The measurements taken during the two hour experimental periods at 5-minutes interval times for temperature setpoints of 20oC, 22oC and 24oC with internal heat loads 0, 500, 700 and 1000 W. The experimental results indicate that the proposed technique can save energy in comparison with On/Off and proportional-integral-derivative (PID) control.
Keywords: air conditioning, compressor performance, energy saving, fuzzy logic control
1. Introduction
In modern society, air conditioners are commonly found in homes and in public enclosed spaces due to the natural demand for thermal comfort. A basic of an air conditioning system consist of a conventional single speed air conditioning system to that of a variable speed type. A variable speed of air conditioning is the system that could distribute conditioned air at different temperatures. A system with variable speed control can control the cooling capacity by changing the rotational speed of the compressor for load matching and thermal comfort; therefore it must be complemented with a good control scheme to maintain comfort under any conditions [1].
The energy consumption of the compressor accounts around 90% of the total energy consumption of an air conditioning system [2], [3]. Yu showed that 67% of the respondents claimed that they intentionally oversized air conditioning design for about 10 to 15% because for future extension, renovation and change of usage [4]. The number of air conditionings in Malaysia has increased significantly from 13,251 units in 1970 to 253,399 in 1991, and
predicted to be about 1,511,276 in 2020 [5]. Hence, it is natural to expect the most energy saving comes from the compressor.
There are only a few publications presented the possibility of conserving energy using VSC control to air conditioning based on compressor performance, internal heat loads and room temperature variation and energy analysis. A lots of papers described adjustable speed fan to control space temperature and humidity, the supply air flows to control opening of a damper, the refrigerant flow rate as a capacity control to control opening of an expansion valve, indoor temperature control, the simulation of air conditioning and HVAC (heating, ventilating and air conditioning) system and the refrigerant flow control of an evaporator [2], [6], [7].
There are some methods of controllers that have been developed. There are conventional control and intelligent control. There are have advantages and limitations for each, some methods are often combined others to provide better performance.
This research work presents quantifying the performance of an air conditioning system by a variable speed compressor for load matching and thermal comfort. The compressor speed is controlled using fuzzy logic control (FLC). The emphasis of the study is on energy consumption. The advantages of FLC comparing conventional control are [8]:
a. The design of the FLC does not require complicated mathematical equations. It requires only a set of basic rules to form the decision table. Basically, all of the rules in the decision table are based on the operator’s experience.
b. Input and output variables can be handled simultaneously.
c. It is inexpensive to develop. From a practical point of view, the development cost is one of the most important criteria for a successful product. Because FLC is easy to understand, the time necessary to learn the approach is short and the software cost is low. And, as FLC is simple to implement, the hardware cost is also low.
d. FLC can be blended with conventional control. FLC does not necessarily replace conventional control methods, but can work in conjunction with them.
This paper provides a brief summary of the performance of the compressor measure, FLC and its implementations and the experimental FLC system compared with on/off and PID controllers.
2. The Proposed Controller
2.1 Coefficient of Performance (COP) of Refrigeration Cycle
The COP can be described as the ratio of the refrigeration effect (the amount of heat the system removes from the conditioned space or process load) to work at the input (the net amount of energy transferred into the system to accomplish the refrigeration effect). Thus, the COP is expressed as [9]: com e 1 2 4 1 W Q ) h (h ) h (h COP = − − = (1)
for the Carnot refrigeration cycle [9]:
1 2 1 4 1 1 2 4 1 1 carnot T T T ) s )(s T (T ) s (s T COP − = − − − = (2)
where h1, h2 (kJ/kg) are the enthalpy at the compressor inlet and outlet respectively, h4 (kJ/kg) is
the enthalpy at the evaporator inlet, Qc (kJ/kg) is the refrigerating effect, Wcom (kJ/kg) is the
compression work, T1 ( o
C) is the evaporating temperature, T2 ( o
C) is the condensing temperature, s1 (kJ/kg.K) is the entropy at the compressor inlet and s4 (kJ/kg.K) is the entropy at
the evaporator inlet. 2.2 Energy Saving
The energy saving calculated is expressed in terms of saving in percentage unit, based on the difference between energy consumed using on/off control and energy consumed using
FLC and between energy consumed using PID control and energy consumed using FLC. The equations are given as:
100 energy) (on/off energy) (FLC -energy) (on/off saving Energy = × (3) 100 energy) (PID energy) (FLC -energy) (PID saving Energy = × (4) 2.3 PID Controller
The PID controller algorithm is the almost universally used control strategy. The PID control equation is defined by [10] :
∫
+
+
=
dt
t
de
K
dt
t
e
K
t
e
K
t
u
p i d)
(
)
(
)
(
)
(
(5)where Kp, Ki and Kd are the proportional, integral, and derivative constant gains, respectively. The signal e(t) defined as e(t) = r(t) − c(t) is the error signal between the reference r(t) and the process output c(t).
2.4 Fuzzy Logic Controller
The major components of FLC are shown in Figure 1. These are, input and output variables, fuzzification, inference mechanism, fuzzy rule base and deffuzification [11]. FLC involves receiving input signal and converting the signal into fuzzy variable (fuzzifier). The fuzzy control rules relate the input fuzzy variables to an output fuzzy variable which is called fuzzy associative memory (FAM), and defuzzifying to obtain crisp values to operate the system (defuzzifier). In this FLC, there are two fuzzy input variables and one output fuzzy variable. The fuzzy input variables are the error, e which is the error between the reference and the measured temperature and the error difference, ∆e which is the rate of change of the error can be approximated as the difference between the present error and the previous error. The output fuzzy variable, ∆Z is the voltage signal to the motor. Table 1 shows the inputs and output variables, linguistics and labels in the FLC.
Figure 1. Fuzzy control system [10][11]
The membership function for fuzzy sets can have many different shapes, depending on a definition. The popularly used fuzzy membership functions in many applications are triangular, trapezoidal, bell-shaped and sigmoidal membership function [11]-[17]. The membership function used is the triangular type as shown in Figure 2. This type is simple and give a good controller
performance and easy to handle [13], [18]. The important character of these shapes for a purpose of use in fuzzy operation is the fact that they overlap. The precise shapes of these curves are not so important in the utility. Rather, it is the number of curves (partitions) used and their overlapping regions that are the most important ideas [19]. A rule of thumb is to ensure that the sets overlap somewhat between 10% and 50% with its neighbors [20] [21]. Triangular membership functions, with an overlap level may produce a zero value reconstruction error [22].
Table 1. Inputs and output variable for FLC tuning [1] Fuzzy Variable Linguistic Labels Domain
Input e Hot H [-2 , 0] Normal N [-0.5 , 0.5] Cool C [0 , 2] Input ∆e Negative NE [-2 , 0] Normal NO [-0.5 , 0.5] Positive PO [0 , 2] Output ∆Z Slow SL [0 , 5] Normal NM [4 , 6] Fast FT [5 , 10]
A fuzzy set may be represented by a membership function. This function gives the grade (degree) of membership within the set of any element of the universe of discourse. The membership function maps the elements of the universe onto numerical values in the interval [0,1]. Specifically [8]:
µA(x) : X → [0,1] (6)
where µA(x) is the membership function of the fuzzy set A. A membership function is a possibility function and not a probability function. In addition to choosing a membership function shape, we have to construct asset of membership functions for all the fuzzy subsets (linguistic terms) for each input and each output. Let us first define some properties of membership functions: peak point, left and right width, crosspoints, and the crosspoint level.
Figure 2. Terminologi of triangular membership function
The peak point is defined as the value M from the domain X which makes µA(M) = 1.
Figure 2 illustrates the peak point of a triangular membership function. The peak value is an interval for a triangular shaped membership function. The left width (X1) is the length of the interval from the peak point to the nearest point in the L which has µA(L) = 0. Similarly, the right
width (X2) is the length of the interval from the peak point to the nearest point in the N which has µA(N) = 0. A crosspoint is the value C in X where µA(C) = µB(C) > 0. A crosspoint level can
have the same value by the definition of the crosspoint). Note that two neighboring membership functions may have more than one crosspoint. For the example shown in Figure 2, the crosspoint level is 0.37. Triangular memberships function, as expressed by [8]:
ܶሺܺ;ܮ,ܯ,ܰሻ=൞ 0 for X < L ሺܺ−ܮሻ/ሺܯ−ܮሻ for L≤X≤M ሺܰ−ܺሻ/ሺܰ−ܯሻ for M≤X≤N 0 for X > N (7)
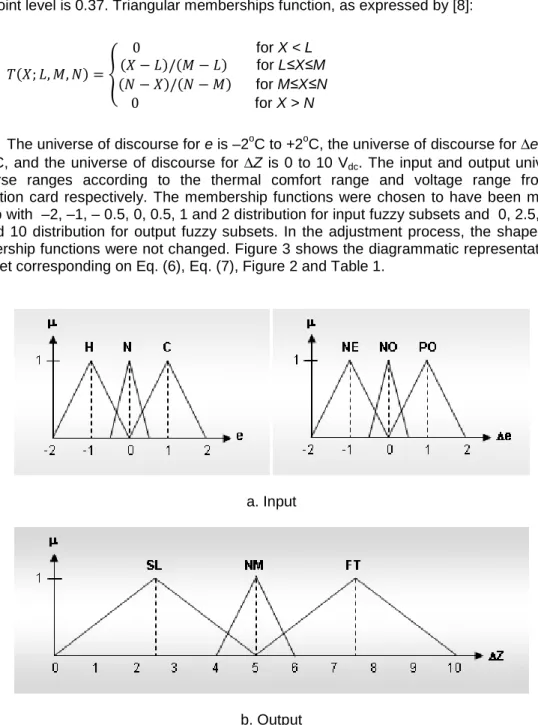
The universe of discourse for e is –2oC to +2oC, the universe of discourse for ∆e is –2oC to +2oC, and the universe of discourse for ∆Z is 0 to 10 Vdc. The input and output universe of
discourse ranges according to the thermal comfort range and voltage range from data acquisition card respectively. The membership functions were chosen to have been moderate overlap with –2, –1, – 0.5, 0, 0.5, 1 and 2 distribution for input fuzzy subsets and 0, 2.5, 4, 5, 6, 7.5 and 10 distribution for output fuzzy subsets. In the adjustment process, the shapes of the membership functions were not changed. Figure 3 shows the diagrammatic representation of a fuzzy set corresponding on Eq. (6), Eq. (7), Figure 2 and Table 1.
a. Input
b. Output
Figure 3. Triangular membership functions for inputs and output
A fuzzy logic rule is called a fuzzy association. A fuzzy associative memory (FAM) is formed by partitioning the universe of discourse of each condition variable according to the level of fuzzy resolution chosen for these antecedents, thereby a grid of FAM elements. The entry at each grid element in the FAM corresponds to fuzzy action. The FAM has two inputs and one output. As the input and the output have three fuzzy variables, the FAM will be three by three, containing nine rules. The FAM of the FLC is shown in Table 2. The rules base from Table 2 are as follows:
1. If e is H and ∆e is NE Then ∆Z is SL 2. If e is N and ∆e is NE Then ∆Z is SL
3. If e is C and ∆e is NE Then ∆Z is SL 4. If e is H and ∆e is NO Then ∆Z is SL 5. If e is N and ∆e is NO Then ∆Z is SL 6. If e is C and ∆e is NO Then ∆Z is SL 7. If e is H and ∆e is PO Then ∆Z is FT 8. If e is N and ∆e is PO Then ∆Z is NM 9. If e is C and ∆e is PO Then ∆Z is SL
Table 2. Fuzzy association map
∆Z e H N C ∆e NE SL SL SL NO SL SL SL PO FT NM SL
The defuzzification is the connection between the control rule base and the physical plant to be controlled, which plays the role of a transformer mapping the controller outputs (generated by the control rule base in fuzzy terms) back to the crisp values that the plant can accept. There are other defuzzification formulas suggested in the literature, each of which has its own rationale, either from logical argument or from geometrical reasoning, or from control principles. The most popular defuzzification technique is the centroid method. In practical terms the centroid method gives stable steady state result [23], yield superior results and less computational complexity [17] and the method should work in any situation [11].
3. Research Method
Figure 4shows the schematic diagram of AHU (air handling unit) and refrigeration unit facility. The standard thermal environmental room of size 4.5 m long by 3.28 m wide by 3.43 m high with the total volume of 50.63 m3 was used. The four-sided walls are insulated. A small type of air conditioning system is located outside the thermal environmental room. The system comprises of a refrigerating unit and an AHU to make it a complete system.
The installation of the hardware began by placing six T type thermocouple sensors (points: T1, T2, T3, T4, T5, and T6), and four of pressure gauges (points: P1, P2, P3, and P4) in the
AHU and refrigerating unit to the respective places. Five of ICs temperature sensors were placed on the opposite walls in the thermal environmental room (points: T7, T8, T9, T10, and T11),
in which the average value of the room temperature was taken.
The closed-loop system is shown in Figure 5. The control system for the compressor speed consists of ICs temperature sensors, computer interface an on/off and FLC subroutine installed in the computer, an inverter and an electrical motor coupled to the compressor. The ICs temperature sensors monitor the temperature of the room and emit electrical signals proportional to the state of the conditioned space. This signal is filtered using lowpass filters and optoisolator before it reaches the controller and inverter, thus minimizing the noise. The output signal is supplied to the controller and computer, which output a control signal that is a function of the error. The on/off and FLC signal output is supplied to the inverter, which modulates the frequency of electrical supply to the motor such that it is linearly proportional to the control signal. Electricity of 50 Hz is supplied to the inverter, which supplies electricity to turn on/off the motor (on/off application) or variable-frequency electricity to the motor for FLC application.
The experiments were conducted at two different conditions: 1. The compressor system test with on/off controller.
2. The variable speed of compressor system test with FLC. The experimental settings were:
1. Temperature setpoints = 20, 22 and 24oC. 2. Internal heat loads = 0, 500, 700 and 1000 W.
The experiment was performed continuously for two hours and the data were sampled at the time interval of five minutes. These data were acquired using data acquisition system and the software designed to read the temperatures of the AHU system and the experimental room,
and the speed of the motor. The data collected were transferred into the database software to perform calculations on energy consumption and COP. The software has been built using Microsoft Visual Basic 6.0.
Multiplexer 1711PCI
TC-08
F
L
C
Figure 4. Schematic diagram of the experimental rig
FL
C
4. Results and Analysis
4.1 Room Temperature Distribution
Figures 6-8 show the motor speed and temperature responses at various temperature settings for FLC. Initially the motor was set to run at the maximum speed (50 Hz). Referring to the setpoint temperature, the controller will minimize the error between the setpoint and the room temperatures.
Figure 6. Motor speed and temperature responses for FLC (Tsetpoint = 20oC)
Figure 7. Motor speed and temperature responses for FLC (Tsetpoint = 22 o
C)
Figure 8. Motor speed and temperature responses for FLC (Tsetpoint = 24 o C) 0 200 400 600 800 1000 1200 1400 1600 16 18 20 22 24 26 28 0 20 40 60 80 100 120 140 S p e e d ( R p m ) R o o m t e m p e ra tu re ( oC ) Time (minute) 0 W 500 W 700 W 1000 W Setpoint 0 W 500 W 700 W 1000 W 0 200 400 600 800 1000 1200 1400 1600 20 21 22 23 24 25 26 27 28 0 20 40 60 80 100 120 140 S p e e d ( R p m ) R o o m t e m p e ra tu re ( oC ) Time (minute) 0 W 500 W 700 W 1000 W Setpoint 0 W 500 W 700 W 1000 W 0 200 400 600 800 1000 1200 1400 1600 22 23 24 25 26 27 28 0 20 40 60 80 100 120 140 S p e e d ( R p m ) R o o m t e m p e ra tu re ( oC ) Time (minute) 0 W 500 W 700 W 1000 W Setpoint 0 W 500 W 700 W 1000 W
The figures show that the motor speeds drop abruptly as the room temperatures reach the setpoints. This action was taken to allow faster heat recovery to the room until the temperature setpoint is upheld again. The controller setups the motor speed so that the room temperature is close to its setpoint temperature.
4.2 Coefficient of Performances
Figure 9 illustrate the relationship between the COP of actual and Carnot with frequency. The higher the frequency the smaller is the value of COP (actual and Carnot). The average values of the actual and Carnot COPs were found to be 3.05 to 4.34 and 6.88 to 11.39, respectively. A high COP at the lower frequency is mostly due to the small compressor power consumption compared with that at the higher frequencies. When the compressor power consumption increases, the COP decreases with the increase of the compressor frequency.
Figure 9. The actual and Carnot COP for FLC
4.3 Energy Consumption And Energy Saving
Figures 10-13 show the energy consumed and energy saving for FLC in comparison with on/off and PID controllers. The results indicate that the lower temperature setpoint and the higher the internal heat loads, the higher is the energy consumption.
Figure 10. The energy consumed for FLC in comparison with on/off controller 1 2 3 4 5 6 7 8 9 10 11 12 0 10 20 30 40 50 60 C O P Frequency (Hz) Actual Carnot 0.00 0.50 1.00 1.50 2.00 2.50 3.00 3.50 4.00 4.50 0 W 500 W 700 W 1000 W 0 W 500 W 700 W 1000 W On/Off Controller Fuzzy Logic Controller
E n e rg y ( k W h ) T=20C T=22C T=24C
The energy consumption was calculated by multiplying the power consumption of the motor by the actual operating hours. The power and energy consumption was calculated every five minutes.The figures show that the energy consumption varies with different internal heat loads and different temperature settings. If the temperature setting is low and the internal heat loads is high then the energy consumption is high. Furthermore, the higher the energy consumption the smaller is the energy saving.
For the two hour continuously used, energy saving achieved by running the system at various internal heat loads (0, 500, 700, and 1000 W) and various temperature settings (20, 22 and 24oC) are 21.86 to 51.73% saves in comparison with on/off controller. In comparison with PID control, the energy saving is 17.76 to 41.93% at setting temperature 20 and 22oC. FLC gives the highest saving in comparison with on/off. While PID is better compared with the FLC at setting temperature of 24oC. The minus area in the Figure 13 shows the energy consumption using FLC is more than PID controller. The performance of the PID controller can give a fast response and rise-time when the temperature of 24oC at internal heat loads 0 and 500 W. In these conditions, the internal heat load is not too large so that the time required to cooling process is faster. Furthermore, the increased internal heat load will cause the response of the process controlled by FLC is much faster than that controlled by PID, i.e. faster rise time.
Figure 11. The energy consumed for FLC in comparison with PID controller
Figure 12. The energy saving for FLC in comparison with on/off controller 0.00 0.50 1.00 1.50 2.00 2.50 3.00 3.50 4.00 4.50 0 W 500 W 700 W 1000 W 0 W 500 W 700 W 1000 W PID Controller Fuzzy Logic Controller
E n e rg y ( k W h ) T=20C T=22C T=24C 22.97 42.05 38.94 39.77 21.86 39.04 51.73 49.86 34.28 43.55 41.99 48.27 0 10 20 30 40 50 60 0 W 500 W 700 W 1000 W E n e rg y S a v in g ( % ) Load Variation T=20C T=22C T=24C
Figure 13. The energy saving for FLC in comparison with PID controller
6. Conclusion
The FLC has been developed to control the motor speed in order to maintain the setpoint temperature. However, when the room is thermally loaded, the controller act in such a way that the heat recovery to the room is faster until the temperature set point is reached again. The energy consumption will change with the motor speed change. When the motor speed increases, then the room temperature decreases and the COP increases with the increase in energy consumption.
The modification of FAM rules that produced a satisfactory solution in terms of energy saving for the room was employed. The impacts of FLC on the performance of the system, the room temperature and energy consumption have been analyzed. The study has shown that FLC is better than PID controller. The trend of compressor performance in terms of COP is found to be similar to all temperature settings. Energy analysis shows that FLC gives more energy savings compared with On/Off and PID controller. This study shows that using the variable speed compressor and choosing suitable control strategy. The space temperature is can be controlled with significant energy saving.
References
[1] Nasution H. Energy Analysis of An Air Conditioning System Using PID and Fuzzy Logic Controllers. Thesis. Johor Bahru: Faculty of Mechanical Engineering UTM; 2006.
[2] Nasution H, Wan Hassan MN. Saving Energy for Air Conditioning With Variable Speed and Proportional Control System. Proceeding of the Malaysia Science and Technology Congress 2003. Kuala Lumpur. 2003a: 843-850.
[3] Nasution H, Wan Hassan MN. Variable Speed Motor of Compressor for Energy Saving of Air Conditioning. Proceeding of the Intl. Conference on Fluid and Thermal Energy Conversion 2003. Bali. 2003b: 053-1-053-9.
[4] Yu PCHA. Study of Energy Use for Ventilation and Air-Conditioning Systems in Hong Kong. Thesis. Hongkong: The Hong Kong Polytechnic University; 2001.
[5] Masjuki HH, Mahlia TMI, Choudhury IA. Potential Electricity Savings by Implementing Minimum Energy Efficiency Standards for Room Air Conditioners in Malaysia. Energy Conversion & Management. 2001; 42: 439-450.
[6] Nasution H, Wan Hassan MN. Energy Saving for Air Conditioning by Proportional Control, Variable and Constant Speed Motor Compressor. Proceeding of the 2nd Intl. Conference on Mechatronics 2005. Kuala Lumpur. 2005: 492-498.
[7] Nasution H. Variable Speed Drives of Reciprocating Compressor for Air Conditioning: Literature Review. Jurnal SAINSTEK. 2003; 6: 25-39.
30.45 41.93 37.37 35.76 17.76 22.83 35.07 30.07 -31.29 -4.15 14.65 15.90 -40 -30 -20 -10 0 10 20 30 40 50 0 W 500 W 700 W 1000 W E n e rg y S a v e ( % ) Load Variation T=20C T=22C T=24C
[8] Hamed B. Comparison of Fuzzy Logic and Classical Controller Design for Nonlinear System, Thesis. Mexico: New Mexico State University; 1999.
[9] Petchers N. Combined Heating, Cooling & Power Handbook: Technologies & Applications. United States of America: Marcel Dekker. 2003.
[10] Perdikaris GA. Computer Controlled Systems Theory and Applications. Netherlands: Kluwer Academic Publisher. 1991.
[11] Pasino KM, Yurkovich S. Fuzzy Control. United State of America: Addison Wesley. 1998.
[12] Nasution H. Development of Fuzzy Logic Control for Vehicle Air Conditioning System. TELKOMNIKA. 2008; 6(2): 73-82.
[13] Dounis AI, Manolakis DE. Design of A Fuzzy System for Living Space Thermal Comfort Regulation. Applied Energy. 2001; 69: 119-144.
[14] Hussu A. Fuzzy Control and Defuzzification. Mechatronics. 1995: 5. 513-526.
[15] Yasin SY. Systematic Methods for the Design of A Class of Fuzzy Logic Controllers. Thesis. Michigan: Western Michigan University; 2002.
[16] Chen Z. Consensus in Group Decision Making Under Linguistic Assessments. Thesis. Kansas: Kansas State University; 2005.
[17] Eker I, Torun Y. Fuzzy Logic Control to be Conventional Method. Energy Conversion & Management. 2006; 47: 377-394.
[18] Bagis A. Determining Fuzzy Membership Functions With Tabu Search-An Application to Control. Fuzzy Sets and Systems. 2003; 139: 209-225.
[19] Gayakwad R. Optimized Fuzzy Logic for Motion Control. Acta Polytechnica Hungarica. 2010; 7(5): 161-168.
[20] Murtha J. Applications of Fuzzy Logic in Operational Meteorology. Scientific Services and Professional Development Newsletter, Canadian Forces Weather Service. 1995; 42-54.
[21] Kushwana GS, Kumar S. Role of the Fuzzy System in Psychological Research. Europe’s Journal of Psychology. 2009; 2:123-134.
[22] Pedrycz W. Why Triangular Membership Functions?. Fuzzy Sets and Systems. 1994; 64: 21-30. [23] Kolokotsa D, Tsiavos D, Stavrakakis GS, Kalaitzakis K, Antonidakis E. Advanced Fuzzy Logic
Controllers Design and Evaluation for Buildings’ Occupants Thermal Visual Comfort and Indoor Air Quality Satisfaction. Energy and Buildings. 2001; 33: 531-543.
![Figure 1. Fuzzy control system [10][11]](https://thumb-us.123doks.com/thumbv2/123dok_us/10957059.2984113/3.892.141.756.135.1154/figure-fuzzy-control-system.webp)
![Table 1. Inputs and output variable for FLC tuning [1]](https://thumb-us.123doks.com/thumbv2/123dok_us/10957059.2984113/4.892.303.593.703.927/table-inputs-output-variable-flc-tuning.webp)