A
CCURACY
OF
D
IABETES
D
IAGNOSIS
IN
H
EALTH
I
NSURANCE
C
LAIMS
D
ATA
IN
T
AIWAN
Cheng-Ching Lin,1,2 Mei-Shu Lai,2 Ci-Yong Syu,3 Shuan-Chuan Chang,3 and Fen-Yu Tseng2,4
1Department of Family Medicine, Taipei Medical University Municipal Wan-Fang Hospital, Taipei; 2Institute of Preventive Medicine, National Taiwan University College of Public Health, Taipei; 3Department of Health, Executive Yuan, Taipei; 4Department of Internal Medicine, National Taiwan University Hospital, Taipei, Taiwan.
Received: 25 March 2004 Revised: 18 May 2004 Accepted: 5 October 2004
Reprint requests and correspondence to: Dr. Mei-Shu Lai, Institute of Preventive Medicine, National Taiwan University College of Public Health, No. 19, Hsu Chow Road, Taipei, Taiwan, 100.
Background and Purpose: There are limited data from Taiwan about the accuracy of National Health Insurance (NHI) claims data. This study assessed the accuracy of NHI claims data for diabetes and its associated factors.
Methods: Insurance claims data for patients with a diagnosis of diabetes were extracted from the records of the Bureau of National Health Insurance, including detailed files of the outpatient, emergency, inpatient and pharmacy treatment records from January 1, 2000 to December 31, 2000. A stratified, 2-staged, probability proportional to size and equal probability method was used to sample 9000 diabetes patients. The accuracy of the diabetes diagnosis was assessed based on patient responses to questionaire items. Subjects with negative or uncertain questionaire answers who had hypoglycemic agents in pharmacy claims data were also classified as diabetic.
Results: A total of 1350 questionnaires were returned and an accurate diagnosis was verified from data in 1007 (74.6%) of these subjects. Univariate analysis showed that level of accreditation of the hospital, age, gender, follow-up department, type of complication, number of outpatient visits, emergent visit, as well as hospitalization were significant factors associated with an accurate diagnosis of diabetes. Multivariate logistic regression analysis revealed that number of outpatient visits, hospitalization, age, and the level of accreditation of the hospital were significant independent factors. The odds ratio of an accurate diagnosis increased with the number of outpatient visits and hospitalization. The probability of accurate diagnosis of diabetes among patients with > 4 outpatient visits was 99.16 times greater than that of patients with ≤ 1 outpatient visit. The probability of accurate diagnosis in patients with
≥ 1 hospitalization was 5.26 times that of patients who had not been hospitalized.
Conclusions: This study found that the accuracy of diabetes diagnosis in NHI claims data in Taiwan was 74.6%. Further attention to the association of inaccurate claims in cases with infrequent outpatient visits, young age and those attending non-accredited hospitals is needed in order to address the efficiency of diagnosis and surveillance of diabetes in Taiwan.
Key words: Diabetes; Health surveys; Insurance claim reporting; National health programs; Population surveillance
J Formos Med Assoc 2005;104:157-63
Insurance claims data have been increasingly adopted in research and evaluation of areas including epi-demiology, health care, quality of care, cost and utilization studies, and health care policy.1–4 These data present several advantages for researchers as they provide population-based longitudinal records of patient care.5,6 Research using insurance claims data is unobstructive to patients and providers and un-affected by measurement errors introduced by poor patient recall. In addition, these data can identify many cases over a short period of time. Follow-up of patients is possible with less effort and expense than that required in clinical series or trials. Moreover, data collection costs are minimized due to their availablity on computer databases.7,8
However, the suitability of insurance claims data for clinical use in research is also limited due to the level of clinical details encoded by the International Classification of Diseases (ICD) coding system and the recorded codes system required in reporting insurance claims.9,10 Problems related to coding accuracy and financial incentives may also lead to bias in coding.
Previous analyses of claims data accuracy for case identification centered on the major categories of surgical procedure,11 cancer,12 depression13,14 and chronic diseases15–17 such as hypertension18,19 and diabetes.20–22 The accuracy rate of insurance claims data in these studies was found to range from approximately 61-90%. The accuracy of insurance claims data is associated with disease types and clinical conditions.
Various medical conditions, such as hip fracture, acute myocardial infarction, and some types of cancers are more likely to be accurately coded as such coding is needed to cover virtually all major surgical pro-cedures. However, numerous clinical conditions are coded with limited accuracy.15 A previous study sug-gested that the accuracy rates of disease-specific claims data may increase to 96% if the claims data are modified by valid methods.18
Three major standards were set to test the accuracy of claims data in previous studies: clinical medical records,11,12,15–17,20 face-to-face interview,19 and patients’ self-reporting from a mailed questionaire.13,14,18,21,22 Although the method of patients’ self-reporting from a mailed questionaire is simpler and more inexpensive than the others, the reponse rate of this method is the lowest of these 3 methods, while the validity of these 3 methods is almost equal.19,23–26 Previous studies showed that self-reported chronic disease status was a valid method of diagnosing diabetes compared with medical records and physician information.23–26
Data on the accuracy rate of insurance claims data in Taiwan are limited. This study assessed the accuracy of insurance claims data for diabetes and examined factors associated with this accuracy.
M
ethods
Insurance claims data
In Taiwan, 96.3% of residents were insured for National Health Insurance (NHI) at the end of 1999 and 91.7% of hospitals and clinics in this country participated in the NHI program. During the 1-year study period in 2000, Taiwan had 22,184,530 citizens and the total number of clinic visits for diabetes was 27,790,867, equal to 10.87% of the total outpatient visits (255,761,465). The total number of hospital-izations for diabetes was 428,291, equal to 15.15% of total hospitalizations (2,826,569) in the same year.
Claims data from the Bureau of National Health Insurance (BNHI) were used in this study, including all detailed files of outpatients, emergency visits, inpatient prescriptions and treatment records during the period from January 1, 2000 to December 31, 2000. Data were obtained from the files maintained for every Taiwanese citizen with an assigned identifi-cation number. Patients with a documented diagnosis of diabetes were classified as indicated by the presence of a diabetes-specific ICD ninth revision, clinical modification (ICD-9-CM) code for diabetes and complications (250.00-250.93), for neonatal diabetes (775.1) and ICD-9 A code for diabetes (A181). Claims with any codes were classified as diabetes. Uncertain cases with codes of diabetes in pregnancy (648.0),
abnormal glucose tolerance in pregnancy (648.8), abnormal glucose tolerance test (790.2), glycosuria (791.5), and acetonuria (791.6) were excluded from this study, while 895,848 cases with a documented diagnosis of diabetes were included and defined as the target population.
Factors associated with the accuracy of diabetes insurance claims data were classified into provision of medical service or profile of patient categories. Provision of medical service included the location of medical institutions (divided by governing branch of the Bureau of the NHI into 6 categories: Taipei, Northern, Middle, Southern, Kao-Ping, and Eastern branch bureaus), type of organization (3 categories: public, private for profit, and private non-profit), follow-up department (5 categories: endocrinology and metabolism, medicine, family medicine, general practitioner [GP], and others), and the level of accreditation of the hospital (4 categories: medical center, regional hospital, district hospital, local clinic and others); and profile of patients included age (3 categories: ≤ 40, 40-50, ≥ 50 years), gender (male and female), number of complications (2 categories: no complication and 1 or more complications), number of outpatient visits (4 categories: ≤ 1, 2, 3, and ≥ 4 times), number of emergent visits (2 categories: 0 and ≥ 1 times), and number of hospital-izations (2 categories: 0 and ≤ 1 times). The category to which each factor belonged was defined accord-ing to the highest frequency of visitaccord-ing a specific department, organization, or hospital for follow-up in 2000. For example, a diabetes patient was classi-fied as treated in the division of endocrinology and metabolism if the patient visited the division of endocrinology and metabolism 3 times, the family medicine department twice, and a GP once.
Types of complications were determined accord-ing to the diagnostic codes. The ICD-9-CM codes for diabetic complications included ketoacidosis (250.1x), hyperosmolarity (250.2x), diabetes with coma (250.3x), renal manifestations (250.4x), oph-thalmic manifestations (250.5x), neurologic mani-festations (250.6x), peripheral circulatory disorders (250.7x), other specified manifestations (250.8x) and unspecified complication (250.9x). The number of outpatient and emergency visits due to diabetes was also calculated. However, the number of hospital-izations was counted based on the frequency of visits to hospitals which recorded any diagnosis code for diabetes.
Patient survey
According to previous studies,15,20 we estimate the accuracy of data from insurance claims for diabetes in Taiwan to be around 70-80%, with a deviation of 3%
producing an estimated sample size of 683-896 persons. If the response rate of the questionnaire by mailing was assumed to be 10-20%, 9000 patients would therefore be required to be included in the sample. Subjects were screened by using a stratified, 2-stage (living area and diabetes), probability pro-portional to size (PPS), and equal-probability method. First, 7756 villages in Taiwan were screened and divided into 4 quantile groups using a stratified, PPS method based on the prevalence rate of diabetes in each village. 387 villages were sampled from the 4 groups and 9000 subjects were extracted using the equal-probability method.
The questionnaire included the following 5 items: 1) Have doctors ever told you that you have diabetes, high blood sugar, or sugar in your urine (exclusive of pregnancy)? 2) Have you ever taken an oral hypo-glycemic agent? 3) Have you ever used an insulin injection? 4) Have you had an examination for blood sugar during the year 2000? 5) What was/were the result(s) of the blood sugar test(s)? The possible answers were positive, negative and uncertain. Patients were classified as diabetic if they gave any affirmative response to the first 3 items of the questionnaire. In addition, subjects with a negative or uncertain response to these 3 questions who had hypoglycemic agents in pharmacy claims data were also classified as diabetic. In this study, the hypoglycemic agents considered included 6 major types of agents: insulin, sulfonylureas, biguanides, α-glucosidase, thiazol-idinediones, and meglitinides.
Statistical analysis
Data were processed using SAS statistical software version 8.0. Descriptive statistics was used to the patterns of basic variables, including mean, standard deviation, and percentage. Chi-squared test was applied to compare relationships between the study population and the sampled population with regard to gender, location, type of organization, where treatment was given, follow-up department, the level of accreditation of the hospital, complications and number of outpatient visits, emergent visits, and hospitalizations. t test was used to determine how the study population and the study sample differed in age. Univariate and multivariate logistic regression analyses were employed to analyze factors associated with accuracy of NHI claims data. A p value < 0.05 was considered statistically significant.
R
esults
Among the 9000 questionaires mailed to patients, 1350 were completed and returned, and these subjects
were defined as the study sample. There were 955 subjects whose diabetes diagnosis was verified, 326 whose diagnosis was classified as incorrect and 69 whose diagnosis was classified as uncertain. Among the cases with negative/uncertain answers on the survey, 27/25 had hypoglycemic agents in pharmacy claims data. A final total of 1007 diabetes cases and 343 non-diabetes cases were classified from the study sample, resulting in an estimate of the accuracy of diabetes insurance claims data of 74.6%. Table 1 shows the comparison between the survey population and the study sample.
Univariate analysis indicated that the accuracy of diabetes diagnosis on claims data increased with the level of accreditation of the hospital, age, number of complications, number of outpatient visits, emer-gent visits, and hospitalization. The diagnostic accu-racy for males was greater than that for females and the accuracy for patients treated in the division of endocrinology and metabolism exceeded those treated in medicine, family medicine, GP and others (Table 2).
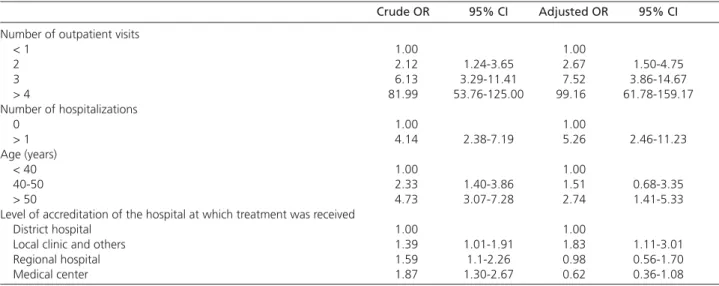
Multivariate logistic regression analysis indicated that number of outpatient visits, number of hospital-izations, age of the patient and the level of accredita-tion of the hospital were significant independent factors associated with diagnostic accuracy. The odds ratio of accurate diagnosis increased with the number of outpatient visits and with hospitalization. The probability of correct diagnosis of diabetes for pa-tients with > 4 outpatient visits was 99.16 times that of those with < 1 outpatient visit. The probability of accurate diagnosis in patients with > 1 hospitalization was 5.26 times that of patients who were never hospitalized. The probability of a correct diagnosis of diabetes in a patient treated at a medical center was 0.62 times that of a patient treated in a district hospital (Table 3).
D
iscussion
This study found that the accuracy of diabetes insurance claims data in Taiwan was 74.6%. This result is similar to the diagnostic accuracy for diabetes reported in a previous study from Ontario (61%)20 and from US Medicare data (65.7% and 88.2%).15 These data suggest that the rates of overdiagnosis are similar in numerous countries.
Patients with ICD-9-CM diagnosis codes of 250.00-250.93, 775.1 and A181 are usually receiving treatment for diabetes. However, in this study, patients with these codes who had ≤ 1 outpatient visit in 1 year had a diagnostic accuracy of only 21.2% although they accounted for over one-quarter of annual total claims
data for diabetes (27.4%). The accuracy of cases with only 2 outpatient visits was only 36.4% and that of patients with 3 outpatient visits was 62.3%, while the accuracy for those cases with 4 and more visits was 96.1%. These data indicate the need for a required number of outpatient visits before claims can be established as accurate.
The number of hospitalizations was also associ-ated with accuracy of diabetes insurance claims data. The accuracy of diagnoses for patients with ≥ 1 hospitalization in a year was 92%. In other words, around 8% of inpatients with a diagnosis of diabetes were not diabetic. This high rate of overdiagnosis may result from financial incentives.
A previous study found that the level of accredi-tation of the hospital also influenced the accuracy of diabetes insurance claims data.27 This study found that accuracy rates in medical centers and regional hospitals exceeded those in district hospitals. How-ever, after adjustment for those factors associated with accuracy, including number of outpatient visits, number of hospitalizations and age of the patient, the accuracy of diabetes diagnosis in medical centers and regional hospitals was lower than that in district hospitals and local clinics. This may be due to the fact that most patients with diabetes are followed up in medical centers and regional hospitals, and thus the number of outpatient visits in medical centers Table 1. Comparison of characteristics of the survey population and the study sample.
Survey population (n = 9000) Study sample (n = 1350) p value
No. (%) No. (%)
Age (years) 59.6 ± 14.4 61.2 ± 13.3 < 0.01 Male 4269 (47.4) 734 (54.4) < 0.01 Number of outpatient visits
Average 8.4 9.9 < 0.01
≤ 1 2463 (27.4) 297 (22.0) 2 680 (7.6) 77 (5.7) 3 402 (4.5) 53 (3.9)
≥ 4 5455 (60.6) 923 (68.4) Number of emergent visits
Average 0.10 0.07 < 0.01 0 8372 (93.0) 1288 (95.4) ≥ 1 628 (7.0) 62 (4.6) Number of hospitalizations Average 0.27 0.18 < 0.01 0 7477 (83.1) 1179 (87.3) ≥ 1 1523 (16.9) 171 (12.7) Number of complications 0.14 0 6729 (74.8) 984 (72.9) ≥ 1 2271 (25.2) 366 (27.1)
Location of medical institution where treatment was received < 0.01 Taipei branch bureau 2729 (30.3) 469 (34.7)
Northern branch bureau 1158 (12.9) 177 (13.1) Middle branch bureau 1590 (17.7) 223 (16.5) Southern branch bureau 1677 (18.6) 241 (17.9) Kao-Ping branch bureau 1584 (17.6) 209 (15.5) Eastern branch bureau 262 (2.9) 31 (2.3) Level of accreditation of the hospital at which treatment was received 0.50
Medical center 1869 (20.8) 311 (23.0) Regional hospital 2054 (22.8) 291 (21.6) District hospital 2154 (23.9) 339 (25.1) Local clinic and others 2923 (32.5) 409 (30.3)
Organization type 0.04 Public 3307 (36.7) 654 (48.4)
Private for profit 3842 (42.7) 467 (34.6) Private non-profit 1851 (20.6) 229 (17.0)
Follow-up department < 0.01 Endocrinology and Metabolism 1454 (16.2) 287 (21.3)
Medicine 4021 (44.7) 596 (44.2) Family medicine 1304 (14.5) 195 (14.4) General practitoner 1145 (12.7) 126 (9.3) Others 1076 (12.0) 146 (10.8)
Oral hypoglycemic agents and insulin use < 0.01 Yes 5565 (61.8) 916 (67.8)
and regional hospitals is greater than those in district hospitals and local clinics. The number of outpatient visits was the factor most associated with diagnostic accuracy.
In this study, age was also associated with diagnostic accuracy. This may be due to the fact that the prev-alence of diabetes increases with age, and older people are more likely to have a diagnosis of diabetes as a result of a blood examination.
A limitation in this study was that only confirmed diabetes cases were examined. Classification of subjects as non-diabetic in insurance claims data was not independently confirmed and could not be established in this study. Those patients with diabetes treated without drug therapy or controlled by alternative medicine might have been under-reported in insurance claims data. The measurement of negative predictive values for validity of insurance claims data is another area requiring prospective study.
Another limitation of this study was the low response rate, a common situation when question-naires are sent by mail. In this study, the average age
of respondents exceeded that of the target population. The proportions of male respondents, number of outpatient visits, emergent visits, hospitalization, and follow-up in the endocrinology and metabolism department among respondents also exceeded those of the target population. All of these were factors are associated with the accuracy of diabetes insur-ance claims data. Study design using the methods of medical record review or patient self-report in a personal interview would improve the quality of results.
Evidence from earlier studies suggested that the self-report was a reliable guide to the diagnosis of diabetes, with high specificity and sensitivity.23–26 In this study, participants were asked whether they had diabetes or if they had ever been diagnosed with diabetes. Respondents answering “yes” may have included persons with impaired glucose tolerance in addition to those with diagnosed diabetes. On the other hand, the use of medical records was biased by their being recorded from the point of view of doctors. Moreover, one-sixth of patients with conditions coded in the claims data had no records in clinical data.28 Table 2. Analysis of factors associated with concordance or discordance of diabetes insurance claims data with the results of patient survey.
Concordant (n = 1007) Discordant (n = 343) p value
No. (%) No. (%) Age (years) < 0.01 < 40 42 (44.2) 53 (56.4) 40-50 118 (64.8) 64 (35.2) ≥ 50 847 (78.9) 226 (21.1) Gender < 0.01 Male 574 (78.2) 160 (21.8) Female 433 (70.3) 183 (29.7)
Number of outpatient visits < 0.01
≤ 1 63 (21.2) 234 (78.8) 2 28 (36.4) 49 (63.6) 3 33 (62.3) 20 (37.7)
≥ 4 883 (95.7) 40 (4.3)
Number of emergent visits < 0.01 0 952 (73.9) 336 (28.0) ≥ 1 55 (88.71) 7 (11.29) Number of hospitalizations < 0.01 0 849 (72.0) 330 (28.0) ≥ 1 158 (92.4) 13 (7.6) Number of complications < 0.01 0 699 (71.0) 285 (29.0) ≥ 1 308 (84.15) 58 (15.85)
Level of accreditation of the hospital at which treatment was received < 0.01 District hospital 230 (67.9) 109 (32.2)
Local clinic and others 305 (74.6) 104 (25.4) Regional hospital 224 (77.0) 67 (23.0) Medical center 248 (79.7) 63 (20.3)
Follow-up department < 0.01 Endocrinology and Metabolism 250 (87.1) 37 (12.9)
Medicine 432 (72.5) 164 (27.5) Family medicine 136 (69.7) 59 (30.3) General practitioner 91 (72.2) 35 (27.8) Others 98 (67.1) 48 (32.9)
Table 3. Multivariate logistic regression analysis of factors associated with accuracy of diabetes insurance claims data.*
Crude OR 95% CI Adjusted OR 95% CI
Number of outpatient visits
< 1 1.00 1.00 2 2.12 1.24-3.65 2.67 1.50-4.75 3 6.13 3.29-11.41 7.52 3.86-14.67 > 4 81.99 53.76-125.00 99.16 61.78-159.17 Number of hospitalizations 0 1.00 1.00 > 1 4.14 2.38-7.19 5.26 2.46-11.23 Age (years) < 40 1.00 1.00 40-50 2.33 1.40-3.86 1.51 0.68-3.35 > 50 4.73 3.07-7.28 2.74 1.41-5.33 Level of accreditation of the hospital at which treatment was received
District hospital 1.00 1.00
Local clinic and others 1.39 1.01-1.91 1.83 1.11-3.01 Regional hospital 1.59 1.1-2.26 0.98 0.56-1.70 Medical center 1.87 1.30-2.67 0.62 0.36-1.08
* Eight variables were analyzed in the model: age, gender, number of outpatient visits, emergent visits and hospitalization, number of complications, level of hospital accreditation, and follow-up department.
OR = odds ratio; CI = confidence interval.
In conclusion, this study estimated the accuracy of diabetes insurance claims data at 74.6% in Taiwan. Number of outpatient visits, hospitalization, age, and the level of accreditation of the hospital were factors associated with accuracy of diabetes insurance claims data. Controlling these factors can play a very important role in maximizing the accuracy of dia-betes claims data for surveillance and epidemiologic research on the public health burden of diabetes and its complications.
ACKNOWLEDGMENT: The authors would like to
thank the Department of Health, Executive Yuan, Taiwan, for financially supporting this research under contract No. DOH91-NH-1011: DM patient cohort system in Taiwan.
R
eferences
1. Weiner JP, Powe NR, Steinwachs DM, et al: Applying insurance claims data to assess quality of care: a compilation of potential indicators. QRB 1990;16:424-38.
2. Wennberg JE, Roos N, Sola L, et al: Use of claims data systems to evaluate health care outcomes. Mortality and reoperation following prostatectomy. JAMA 1987;257:933-6.
3. Ray WA, Griffin MR: Use of Medicaid data for pharmaco-epidemiology. Am J Epidemiol 1989;129:837-49.
4. Anderson G, Steinberg EP, Whittle J, et al: Development of clinical and economic prognoses from Medicare claims data. JAMA
1990;263:967-72.
5. Wei JN, Chuang LM, Lin RS, et al: Prevalence and hospitalization rates of diabetes mellitus in Taiwan, 1996-2000 [in Chinese].
Taiwan J Public Health 2002;21:173-80.
6. Wei JN, Sung FC, Lin RS, et al: Comparison in diabetes-related
complications for inpatients among university medical centers, regional hospitals and district hospitals [in Chinese]. Taiwan J Public Health 2002;21:115-22.
7. Roos LL Jr, Roos NP, Cageorge SM, et al: How good are the data? Reliability of one health care data bank. Med Care 1982; 20:266-76.
8. Roos LL Jr, Cageorge SM, Austen E, et al: Using computers to identify complications after surgery. Am J Public Health 1985; 75:1288-95.
9. Mullin RL: Diagnosis-related groups and severity. ICD-9-CM, the real problem. JAMA 1985;254:1208-10.
10. Jencks SF, Williams DK, Kay TL: Assessing hospital-associated deaths from discharge data. The role of length of stay and comorbidities. JAMA 1988;260:2240-6.
11. Losina E, Barrett J, Baron JA, et al: Accuracy of Medicare claims data for rheumatologic diagnoses in total hip replacement recipients. J Clin Epidemiol 2003;56:515-9.
12. Cooper GS, Yuan Z, Stange KC, et al: The sensitivity of Medicare claims data for case ascertainment of six common cancers. Med Care 1999;37:436-44.
13. Meredith LS, Humphrey N, Orlando M, et al: Knowledge of health care benefits among patients with depression. Med Care 2002; 40:338-46.
14. Kwon A. Bungay KM. Pei Y, et al: Antidepressant use: con-cordance between self-report and claims records. Med Care
2003:41:368-74.
15. Fisher ES, Whaley FS, Krushat WM, et al: The accuracy of Medicare’s hospital claims data: progress has been made, but problems remain. Am J Public Health 1992;82:243-8. 16. Roos LL, Sharp SM, Cohen MM: Comparing clinical information
with claims data: some similarities and differences. J Clin Epidemiol 1991;44:881-8.
17. Roos LL, Sharp SM, Cohen MM: Comparing clinical information with claims data: some similarities and differences. J Clin Epidemiol 1991:44:881-8.
18. Quam L, Ellis LB, Venus P, et al: Using claims data for epidemi-ologic research. Med Care 1993;31:498-507.
19. Muhajarine N, Mustard C, Roos LL, et al: Comparison of survey and physician claims data for detecting hypertension. J Clin Epidemiol 1997;50:711-8.
20. Hux JE, Ivis F, Flintoft V, et al: Diabetes in Ontario: determination of prevalence and incidence using a validated administrative data algorithm. Diabetes Care 2002;25:512-6.
21. Hebert PL, Geiss LS, Tierney EF, et al: Identifying persons with diabetes using Medicare claims data. Am J Med Qual 1999;14: 270-7.
22. Marks AS, Lee DW, Slezak J, et al: Agreement between insurance claim and self-reported hospital and emergency room utilization data among persons with diabetes. Dis Manag 2003;6:199-205. 23. Kehoe R, Wu SY, Leske MC, et al: Comparing self-reported and physician-reports medical history. Am J Epidemiol 1994;139: 813-8.
24. Mackenbach JP, Looman CW, van der Meer JB: Differences in
the misreporting of chronic conditions, by level of education: the effect on inequalities in prevalence rates. Am J Public Health
1996;86:706-11.
25. Martin LM, Leff M, Calonge N, et al: Validation of self-reported chronic conditions and health services in a managed care population. Am J Prev Med 2000;18:215-8.
26. Kriegsman DMW, Penninx BWJ, van Eijk JTM, et al: Self-reports and general practitioner information on the presence of chronic disease in Community Dwelling Elderly. J Clin Epidemiol 1996; 49:1407-17.
27. Lai HT, Yaung CL, Fan BY: Study on the quality and its related factors of international classification of disease coding system in national health insurance [in Chinese]. Taiwan J Public Health
1998;17:337-48.
28. Jollis JG, Ancukiewicz M, DeLong ER, et al: Discordance of databases designed for claims payment versus clinical infor-mation systems. Implications for outcomes research. Ann Intern Med 1993;119:844-50.