1874-4478/09 2009 Bentham Open
Open Access
Investigation of Truck-Involved Angle Crashes Based on GES and FARS
Crash Databases
Xuedong Yan
*,1, Essam Radwan
2, Kranthi Kiran Mannila
3and Stephen Richards
41Center for Transportation Research, University of Tennessee, 309 Conference Center Bldg., Knoxville, TN 37996-4133, USA
2Center for Advanced Transportation Systems Simulation, University of Central Florida, Orlando, FL 32816-2450, USA 3HNTB Corporation, 300 Primera Blvd, Suite 200, Lake Mary, FL-32746, USA
4Southeastern Transportation Center (STC), The University of Tennessee, Suite 309, Conference Center Building, Knox-ville, Tennessee 37996-4133, USA
Abstract: Truck-car angle collisions have a higher crash frequency than other truck-involved collision types and tend to increase injury severity. This paper investigates both general and fatal truck-involved angle collisions using two national crash databases (2000-2004), General estimates system (GES) and Fatality Analysis Reporting system (FARS). In this study, two-vehicle angle collisions were classified into three groups based on fault roles of truck or car drivers in the acci-dents, including Truck-Car, Car-Truck, and Car-Car crashes. The occurrence conditions of the three angle crash types were compared to each other to identify the potential risk factors such as driver characteristics, road environments, and highway designs related to the truck-involved crashes. The multinomial logistic regression is used for the statistical analy-sis. Based on the result analysis of this study, it is suggested that truck-involved angle collisions should be considered as an important scenario design for retraining or education programs for the purposes of reducing older drivers’ fatality rate; improving either the conspicuity of truck trailers or lighting design of the highway would reduce the frequency and sever-ity of truck-involved angle crashes; to improve incompatibilities between truck, car, and highway design, further studies should conduct in-depth analyses of geometric factors related to driver performances and behaviors in the car-truck con-flicts at intersections.
Keywords: Angle collisions, trucks, crash databases, GES and FARS, Driver’s fault, multinomial logistic regression.
INTRODUCTION
Large trucks with a gross weight rating greater than 10,000 pounds constitute an important component of the national highway traffic in America [1]. Due to the physical and operational characteristics of heavy trucks, they can sig-nificantly impact traffic system performance, safety, and the travel experience of non-truck drivers. In 2003, 457,000 large trucks were involved in traffic crashes in the United States; among them 4,669 were involved in fatal crashes [2]. In collisions between passenger vehicles (cars) and large trucks, the structural properties and greater mass of large trucks put the occupants of the cars at a disadvantage. Ninety eight percent of the deaths in fatal two-vehicle crashes in-volving a car and a large truck were among occupants of the car [3].
Traffic safety researchers had conducted numerous stud-ies related to car-truck crashes. From a driver behavior per-spective, some previous studies focused on the issue of un-safe driving acts (UDAs) in car-truck crashes. Blower [4] analyzed more than 5,400 fatal car-truck crashes from 1994 to 1995 and examined the Fatality Analysis Reporting
*Address correspondence to this author at the Center for Transportation Research, University of Tennessee, 309 Conference Center Bldg., Knox-ville, TN 37996-4133, USA; Tel: (865) 974-0298; Fax: (865) 974-3889; E-mail: xyan1@utk.edu
System (FARS) records of driver-related factors, pre-crash movements, and vehicle positions. According to this analy-sis, the car driver’s behavior was more than three times as likely to contribute to the fatal crash as the truck driver’s behavior. In addition, the car drivers were solely responsible for 70 percent of the fatal crashes, compared to 16 percent for the truck driver. Stuster [5] reviewed more than 1,000 car-truck crash reports from seven States to identify specific problematic driving acts of car drivers in the vicinity of large trucks. He concluded that the most UDAs of passenger car drivers included such actions as driving in the “no zones”, changing lanes abruptly in front of a truck, driving inatten-tively, following too closely, and turning, merging, changing lanes and passing unsafely in the vicinity of a truck. In other UDA-related research, Kostyniuk et al. [6] used 1995-1998 FARS data to identify car-truck UDAs and compared UDAs in car-truck crashes with those in car-car crashes. The study concluded that most driving behaviors are equally likely to be recorded for fatal car-car crashes as for fatal car-truck crashes. Only four factors (out of 94) were more likely to occur in fatal car-truck crashes, including: following im-properly, driving while drowsy or fatigued, changing lanes improperly, and driving with vision obscured by rain, snow, fog, or dust. However, only about 5 percent of all car-truck crashes in the database included these four factors. Council
et al. [7] examined driver fault in car-truck crashes and ana-lyzed the relative contribution of truck vs car drivers. Using
the North Carolina database in the Highway Safety Informa-tion System (HSIS), they found that car drivers were more often to be at fault than truck drivers in head-on and angle crashes. Furthermore, this study pointed out that the highest total harm cost for car-truck crashes were resulted in angle crashes at stop/yield intersections on undivided and other rural major roads.
Due to their large sizes and weights, trucks are not as maneuverable as cars. Large trucks need longer stopping and starting distances and require more space for turns. Truck drivers often swing wide to complete a turn movement and a large tractor-trailer often appears to be traveling at a slower speed. Because the car driver may not realize how close the truck is or how quickly it is traveling, car-truck crashes fre-quently occur at junctions –– intersections, ramps, drive-ways, or other points where roadways intersect. Generally, the crashes occurring at those locations are more likely to be angle collisions, which are the most dangerous crashes in-volving a truck because the relative impact forces are so high that the propensity for injury and damage is great. Based on the 2004 General Estimates System of National Sampling System (GES), it was found the 93,196 angle collision that
constitutes the highest percent of frequency of all types of car-truck collisions (see Fig. 1). Furthermore, there is a clear trend that the frequency of angle car-truck collision increases as the driver injury severity increases. Therefore, car-truck angle crashes are most dangerous and occur most frequently. However, very few studies dealt with car and truck angle collisions in particular. Abdel-Aty and Abdelwahab [8] stud-ied the effect of the increased percentage of light truck vehi-cle (LTV) registrations on fatal angle collisions trends in the United States. The analysis investigated the number of an-nual fatalities that resulted from angle collisions as well as collision configuration (car-car, car-LTV, LTV-car, and LTV-LTV). However, the vehicle sizes and performances of LTVs are more similar to those of passenger cars rather than those of heavy trucks.
The objective of this study is to investigate and quantify the effects of potential risk factors on both non-fatal and fatal car-truck angle collisions. Using two national crash data-bases (2000-2004), the General Estimates System (GES) of National Sampling System and the Fatality Analysis Report-ing system (FARS), the angle crashes were categorized into three groups based on the driver’s fault role. The three types
0 1 2 3 4 5 No collision Rear-end Head-on Rear-to-rear Angle
Sidewipe, same direction Sidewipe, Opposite direction
37% 39% 40% 44% 48% 54% 0% 10% 20% 30% 40% 50% 60%
Relative Frequency
Injury Severity
Fig. (1). Relative frequency of all types of car-truck collisions (Order of injury severity: 0 - No injury, 1 - Possible injury, 2 - Non-incapacitating, 3 – Incapacitating, 4 – Fatal, 5 - Unknown injury severity).
of angle crashes are: 1) Truck-Car crashes (a fault truck driver had a collision with a not-at-fault car driver); 2) Car-Truck crashes (a fault car driver had a collision with a not-at-fault truck driver); and 3) Car-Car crashes (a not-at-fault car driver had a collision with a not-at-fault car driver). The truck-truck crashes were not considered in our study because they con-stitute a very low percentage (1.7 %) of the total two-vehicle crashes. Through comparing the occurrence conditions of the three angle-crash groups using the multinomial logistic re-gression method, this study examined the crash propensities of truck-car collisions related to the potential risk factors such as driver characteristics, road environments, and high-way designs.
METHODOLOGY Crash Databases
Two databases were employed in this study. The General Estimates System (GES) obtains its data from a nationally representative probability sample selected from the estimated 6.3 million police-reported crashes that occur annually [9]. These crashes include those that result in a fatality or injury and those involving major property damage. Since the GES data are obtained from a probability sample of police-reported traffic crashes, national estimates can be made from these data. A weight variable is provided in the GES data files that produce the national estimates.
The Fatality Analysis Reporting System (FARS) contains details of virtually all police-reported fatal motor vehicle crashes in the United States (National Highway Traffic
Safety Administration) [10]. To be included in FARS, a crash must involve a motor vehicle traveling on a traffic way customarily open to the public and result in the death of a person (occupant of a vehicle or a non-occupant) within 30 days of the crash.
Both databases are relational databases consisting of three main files: accident, vehicle/driver, and person. Each file deals with a specific aspect of traffic crashes. The acci-dent file contains information on crash characteristics and environmental conditions at the time of the crash. The vehi-cle/driver file contains information describing the vehicles and drivers involved in the crash. The person file contains general information describing all persons involved in the crash: drivers, passengers, pedestrians, pedal cyclists, and non-motorists. By crash report case number and vehicle number in each database, these files may be linked as needed to combine the information contained in each file.
Data Preparation
The GES and FARS crash database for the years 2000 to 2004 were obtained for the car-truck angle collision analysis. As shown in Fig. (2), the first step of the data preparation is to identify the two-vehicle crashes in the databases, which only include car-car collisions and car-truck collisions (truck-truck crashes were excluded). The dataset was further filtered as the two-vehicle crashes in which only one driver/vehicle was at fault but the other was not. This strat-egy is to better assign driver culpability and easily identify fault roles of drivers/vehicles in the crash. The
violations-Fig. (2). Method of data preparation.
GES/FARS
2000-2004
All two-vehicle angular crashes
involving car and truck
Fault
Only truck at fault in
Truck-Car crashes
Only car at fault in
Car-Truck crashes
Only car at fault in
Car-Car crashes
Comparison among factors
(traffic and driver characteristics)
using Multinomial Logit Model
charged variable (from the Vehicle file) was used to define vehicles’ fault roles and only those cases involving driving activity by the driver were taken into account. For example, while dealing with violations in the FARS database, the vio-lation charge of “fail to give aid, info, wait for Police after crash” was not considered.
Based on the driver’s fault role, the two-vehicle crashes were further classified into the three crash groups. As men-tioned before, they include Truck-Car (a fault truck driver had a collision with a not-at-fault car driver), Car-Truck (a fault car driver had a collision with a not-at-fault truck driver), and Car-Car (a fault car driver had a collision with a not-at-fault car driver). Thus, comparing the occurrence con-ditions (such as driver characteristics, road environments, and highway designs) of three angle-crash groups, one can identify which traffic factors are significantly associated with the fault roles of truck/car drivers in the truck-involved angle collisions.
The obtained data using the methodology stated above is shown in Table 1. Note that since this study was focused on the relative frequency (percentage) of each angle-crash group, the crash frequency from the GES database in Table 1 is the sampling data, but not weighted estimates. It was found that in the GES database 86.3% of cars at fault in car-car crashes was observed while in the FARS there were 82% of cars at fault in fatal car-car crashes, which indicated that truck-involved angle collisions can increase crash death rate. In the GES database, it was observed that more cars were found at fault in Car-Truck crashes than trucks being at fault in Truck-Car crashes (8.6% vs 5.1%). It was noticed that in the FARS database, a larger percentage of trucks were found faulty in fatal Truck-Car crashes when compared to cars at fault in fatal Car-Truck crashes (11.3% vs 6.8%). Therefore, in truck-involved angle collisions, trucks being at fault can cause more fatal crashes when compared to cars being at fault.
Table 1. Distribution of Truck-Car, Car-Truck, and Car-Car
Crash Type GES Database FARS Database
Truck at fault (Truck-Car) 808 (5.09%) 323 (11.25%) Car at fault (Car-Truck) 1365 (8.61%) 194 (6.76%)
Car at fault (Car-Car) 13686 (86.30%) 2353 (81.99%) Total 15859 (100.00%) 2870 (100.00%)
Statistical Modeling of Multinomial Logistic Regression The well accepted multinomial logistic regression is used for the statistical analysis since the dependent variable (crash types) has three categories and there is no inherent ordering involved in it. The dependent variable in a multinomial lo-gistic regression model has more than two choices that are coded categorically; one of the categories can be taken as the reference category. Allison [11] provided the details of the multinomial logit model. The general form of a multinomial logit model is explained below.
If y is the response variable with J nominal outcomes, then the assumption of the Multinomial logit model is that the categories one through J is not ordered. Also, let
Pr(y=m|x) be the probability of observing outcome m given the set of independent variables x. Assume that Pr(y=m|x) is a linear combination xm . The vector
m =0m...km...Km contains the intercept 0m and coeffi-cients Km for the effect of
x
K on outcome m. In contrast to an ordinal-response model, a different set of parameter esti-mates are obtained for each outcome. To ensure non-negativity for the probabilities, the exponential of xm is taken. For the probabilities to sum to one, the following normalization is needed: Pr(yi =m|xi)= exp(xim) exp(xij) j=1 J (1)In this study, we have three categories for the fault vari-able of crash type (y = 1 for Truck-Car, y = 2 for Car-Truck, y = 3 for Car-Car). For a dependent variable let
pi1: prob. that the crash type is 1 for observation i pi2: prob. that the crash type is 2 for observation i pi3: prob. that the crash type is 3 for observation i Then, the model can be formulated as follows: log pi1 pi3 =1xi pi1 pi3 = exp(1xi) (2) log pi2 pi3 =2xi pi2 pi3 = exp(2xi) (3) log pi1 pi2 =3xi pi1 pi2 = exp(3xi) (4)
Using properties of logarithms, we have log pi1 pi2 =log pi1 pi3 log pi2 pi3 = (1-2)xi (5)
This implies that3=12. Where1, 2, 3 are the parameter estimates of the three categories respectively. Be-cause pi1+pi2+pi3=1, the probabilities are calculated us-ing the followus-ing equations respectively:
pi1= exp(1xi) 1+exp(1xi)+exp(2xi) (6) pi2 = exp(2xi) 1+exp(1xi)+exp(2xi) (7) pi3 = 1 1+exp(1xi)+exp(2xi) (8) This study used “3” (Car-Car) as the reference category. The odds ratio (OR) is used to quantify the effect of signifi-cant independent variables on the dependent variable. The odds ratio is simply exp(parameter estimate) and can be used to explain the relative effects of a unit change in the variable on the truck/car angle collisions. In this study, the SAS CATMOD procedure was used for multinomial logistic
re-gression analysis [12] and the hypothesis testing was based on a 0.05 significance level.
RESULTS
Using the GES and FARS databases respectively, various variables were tested and found statistically associated with truck-involved angle collisions. After conducting the main effect model and checking interaction effects between those risk factors, the final multinomial logistic regression models were developed for both datasets as show in Tables 2 and 3. From the GES modeling results, the significant risk factors related to truck/car angle collisions include: driver age and gender, divided/undivided highway, weather condition, light-ing condition, speed related, alcohol use, and day of week. There are three significant interaction factors among them, including divided/undivided highway & speed related, di-vided/undivided highway & alcohol use, and weather condi-tion & speed related. From the FARS modeling results, the significant risk factors related to truck-involved angle colli-sions include: driver age and gender, national highway, weather condition, lighting condition, and alcohol use. There is one significant interaction factor found between national highway and weather condition. Tables 4 and 5 illustrated the variable descriptions and related statistics in the GES and FARS databases respectively. The following sections docu-ment the interpretations and discussions of the regression results for those significant variables.
Table 2. Maximum Likelihood Analysis of Variance for GES Database
Maximum Likelihood Analysis of Variance
Source DF Chi-Square Pr > ChiSq
Intercept 2 744.68 <.0001 Age 4 284.11 <.0001 Gender 2 282.32 <.0001 Divided/undivided highway 2 110.06 <.0001 Weather condition 2 18.76 <.0001 Light condition 4 33.95 <.0001 Speed related 2 276.87 <.0001 Alcohol use 2 69.17 <.0001 Day of week 2 141.53 <.0001 Divided/undivided highway * Speed related 2 26.96 <.0001 Divided/undivided highway * Alcohol use 2 24.96 <.0001 Weather condition * Speed related 2 16.51 0.0003 Likelihood Ratio 760 621.71 0.9999
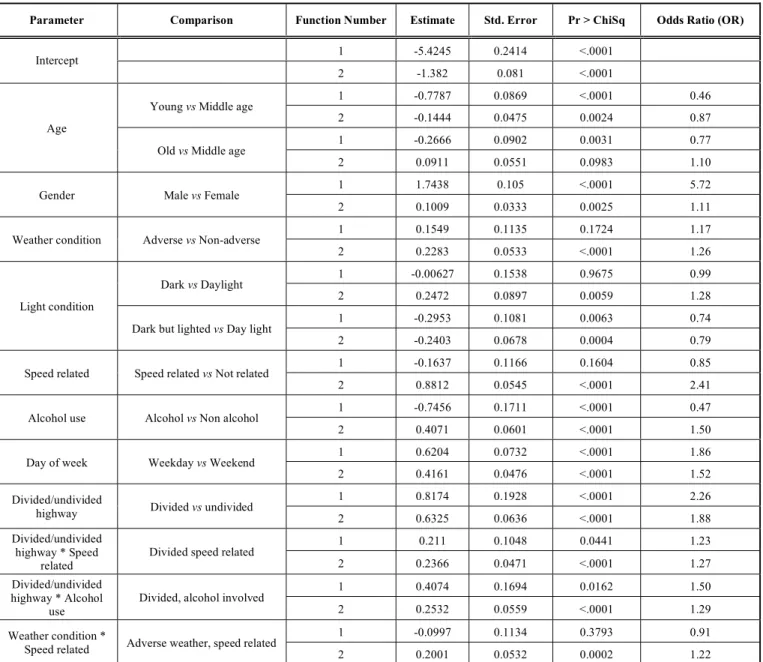
Modeling Results for GES Database
Table 6 lists the model estimations and odds ratios of
significant independent variables while properly adjusting other factors for the GES database.
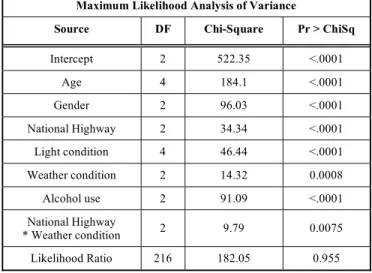
Table 3. Maximum Likelihood Analysis of Variance for FARS Database
Maximum Likelihood Analysis of Variance
Source DF Chi-Square Pr > ChiSq
Intercept 2 522.35 <.0001 Age 4 184.1 <.0001 Gender 2 96.03 <.0001 National Highway 2 34.34 <.0001 Light condition 4 46.44 <.0001 Weather condition 2 14.32 0.0008 Alcohol use 2 91.09 <.0001 National Highway * Weather condition 2 9.79 0.0075 Likelihood Ratio 216 182.05 0.955
Driver Age and Gender
In this study, the age was classified into three groups: young aged drivers (25 years or below), middle aged drivers (26-55 years), and older aged drivers (56 years and above). Comparatively, younger truck drivers are 54% less likely to be at fault than the middle age drivers in Truck-Car angle collisions (OR = 0.46, p < .0001) and young car drivers are 13% less likely to be at fault in Car-Truck angle collisions (OR = 0.87, p = .0024); the older truck drivers are 27% less likely to be at fault than the middle age drivers in Truck-Car angle collisions (OR = 0.77, p = .0031) and the likelihood of older car drivers being at fault involving truck crashes are similar to that of middle age drivers (p = .0983). The analy-sis of this study is conanaly-sistent with the conclusions of Cerrelli [13], who examined if drivers of a certain age appear to be more prone to being involved in crashes with large trucks. It was indicated that the odds of a driver of a passenger vehicle being involved in a collision with a large truck is lowest for the youngest group of drivers, rises steadily until age 45, remains at that value through age 74, and drops for very old drivers. This result may be explained as the driving patterns of the older drivers and younger drivers are less exposed to conflicts with large trucks and they may be less likely to share the same driving environment of drivers of large trucks, i.e. type of highways, time of day, etc [13]. Further-more, in the Truck-Car collisions both younger and older drivers are less likely to be at fault than middle age drivers possibly because the truck driver’s population ratio of the middle age to younger and older age is larger than that for the passenger vehicle driver.
The variable of gender was found significant in both at fault truck and at fault car in truck/car collisions. Compara-tively, male truck drivers are 472% more likely to be at fault than female truck drivers in Truck-Car collisions (OR = 5.72, p < .0001). This reflects the high concentration of males in transport related occupations particularly truck driv-ing. Boufous and Williamson [14] found that male truck drivers are more likely to be speeding and be fatigued at the time of the crashes. On the other hand, the male car drivers are 11% more likely to result in Car-Truck collisions (OR =
1.11, p = .0025). The possible reason is that compared to male car drivers, female car drivers are less exposed to con-flicts with large trucks and drive more cautiously when driv-ing in the vicinity of trucks.
Lighting Condition
The lighting condition was classified into three catego-ries: dark, dark but lighted, and daylight. Compared to day-light conditions, truck drivers have a similar crash risk under dark conditions (OR = 0.99, p = .9675), but 26% lower risk under dark but lighted conditions (OR = 0.74, p = .0063) to result in the Truck-Car collisions. However, car drivers are 28% more likely to result in Car-Truck crash under dark conditions (OR = 1.28, p = .0059), but 21% less likely to result in Car-Truck crashes the dark but lighted conditions (OR = 0.79, p = .0004). In the dark, truck trailers may not become visible to other road users until they are dangerously close [15]. These results clearly indicate that improving highway lighting design is very important for both car and truck drivers to enhance traffic safety quality.
Weekday/Weekend
The weekday/weekend variable has been found signifi-cant in both the car and truck in a truck-involved angle colli-sion. It has been observed that at fault trucks are 86% (OR = 1.86, p < .0001) and at fault cars are 52% (OR = 1.52, p < .0001) more likely to be resulting in the truck-involved crash on a weekday when compared to a weekend. This might be due to the fact that more trucks travel on weekdays when compared to weekends. The result is consistent with the pre-vious study’s findings [16]: there were relatively fewer truck-involved accidents on Saturdays and Sundays and the truck accidents appear to be more closely tied to the truck volumes than to overall traffic volumes.
Divided/undivided Highway, Speed-Related Behaviors, and Alcohol Use
Without considering speeding and alcohol use, truck drivers are 126% (OR = 2.26, p < .0001) and car drivers are 88% (OR = 1.88, p < .0001) more likely to be at fault result-ing in the truck-involved collisions on divided highways compared to undivided highways.
Without considering the factor of divided/undivided highway, a speeding behavior contributes to similar crash risks in Car-Car collisions and Truck-Car collisions (p = .1604), while it may lead to 141% more crash risks for Car-Truck collisions than Car-Car collisions (OR = 2.41, p < .0001). A possible reason is that when confronting a speed-ing car, a truck could be much more difficult to take steerspeed-ing or braking actions to successfully avoid the crash occurrence. Without considering the divided/undivided highway, truck drivers are 53% less likely to involve alcohol use resulting in Truck-Car collisions than car drivers in Car-Car collisions (OR = 0.47, p < .0001), while car drivers involving alcohol use are 50% more likely to result in Car-Truck collisions than Car-Car collisions (OR = 1.50, p < .0001). This result can be explained by the fact that truck drivers are generally commercial or professional drivers who are less likely to involve alcohol use.
Furthermore, there are significant interaction effects be-tween divided/undivided highway and speed-related behav-iors (p < .0001) and alcohol use (p < .0001). It was found that both speeding behavior and alcohol use of truck and car drivers can increase the crash likelihood for divided high-ways. Related to the speeding behavior, the odds ratios of truck drivers and car drivers are increased respectively by 23% in Truck-Car collisions (OR = 1.23, p = .0441) and 27% in Car-Truck collisions (OR = 1.27, p < .0001) on divided
Table 4. Independent Variable Descriptions in the GES Database
Independent Variable Description Sub Levels
Age Age of the driver
1. Young driver (<25 years) (37.98%) 2. Middle-age driver (26-55 years) (42.46%) 3. Old driver (> 55 years) (19.56%)
Gender Gender of the driver 1. Male (51.50%)
2. Female (48.50%) Divided/undivided highway Indicates whether a roadway was divided or undivided 1. Divided (30.19%)
2. Undivided (69.81%) Weather condition Indicates general weather condition at the time of crash 1. Adverse (12.01%)
2. Non-adverse (87.99%) Light condition Indicating general light condition at time of crash
1. Dark (4.46%)
2. Dark but lighted (19.69%) 3. Daylight (75.82%) Speed related Indicates whether speed was an contributing factor to the cause of crash 1. Speeding (5.95%)
2. No speeding (94.05%)
Alcohol use Alcohol involvement involved in crash 1. Alcohol involved (6.04%)
2. No alcohol involved (93.96%)
Day of week The day of the week in which crash occurred 1. Weekdays (77.88%)
Table 5. Independent Variable Descriptions in the FARS Database
Independent Variable Description Sub Levels
Age Age of the driver
1. Young driver (<25 years) (36.84%) 2. Middle-age driver (26-55 years) (41.90%) 3. Old driver (> 55 years) (21.26%)
Gender Gender of the driver 1. Male (70.34%)
2. Female (29.66%) National Highway Road section on National Highway system (NHS) or not. 1. NHS (26.25%)
2. Non-NHS (73.85%) Weather condition Indicates general weather condition at the time of crash 1. Adverse (11.27%)
2. Non-adverse (88.73%) Light condition Indicating general light condition at time of crash
1. Dark (12.61%)
2. Dark but lighted (24.87%) 3. Daylight (62.52%) Alcohol use Alcohol involvement involved in crash 1. Alcohol involved (25.92%)
2. No alcohol involved (74.08%)
Table 6. Model Estimation and Odds Ratios of Significant Independent Variables for the GES Database
Parameter Comparison Function Number Estimate Std. Error Pr > ChiSq Odds Ratio (OR)
1 -5.4245 0.2414 <.0001
Intercept
2 -1.382 0.081 <.0001
1 -0.7787 0.0869 <.0001 0.46
Young vs Middle age
2 -0.1444 0.0475 0.0024 0.87
1 -0.2666 0.0902 0.0031 0.77
Age
Old vs Middle age
2 0.0911 0.0551 0.0983 1.10
1 1.7438 0.105 <.0001 5.72
Gender Male vs Female
2 0.1009 0.0333 0.0025 1.11
1 0.1549 0.1135 0.1724 1.17
Weather condition Adverse vs Non-adverse
2 0.2283 0.0533 <.0001 1.26 1 -0.00627 0.1538 0.9675 0.99 Dark vs Daylight 2 0.2472 0.0897 0.0059 1.28 1 -0.2953 0.1081 0.0063 0.74 Light condition
Dark but lighted vs Day light
2 -0.2403 0.0678 0.0004 0.79
1 -0.1637 0.1166 0.1604 0.85
Speed related Speed related vs Not related
2 0.8812 0.0545 <.0001 2.41
1 -0.7456 0.1711 <.0001 0.47
Alcohol use Alcohol vs Non alcohol
2 0.4071 0.0601 <.0001 1.50
1 0.6204 0.0732 <.0001 1.86
Day of week Weekday vs Weekend
2 0.4161 0.0476 <.0001 1.52
1 0.8174 0.1928 <.0001 2.26
Divided/undivided
highway Divided vs undivided 2 0.6325 0.0636 <.0001 1.88
1 0.211 0.1048 0.0441 1.23
Divided/undivided highway * Speed
related
Divided speed related
2 0.2366 0.0471 <.0001 1.27
1 0.4074 0.1694 0.0162 1.50
Divided/undivided highway * Alcohol
use
Divided, alcohol involved
2 0.2532 0.0559 <.0001 1.29
1 -0.0997 0.1134 0.3793 0.91
Weather condition *
Speed related Adverse weather, speed related 2 0.2001 0.0532 0.0002 1.22
highway vs undivided highways. Related to the alcohol use, the odds ratios of truck drivers and car drivers are increased respectively by 50% in Truck-Car collisions (OR = 1.50, p = .0162) and 29% in Car-Truck collisions (OR = 1.29, p < .0001) on divided highway vs undivided highways. It can be speculated that speeding and alcohol use can increase the difficulty in truck’s turning maneuverability on divided highways and deteriorate drivers’ reaction time and crash avoidance ability.
Adverse/Non Adverse Weather and Speed-Related Behav-iors
In this study, weather condition was divided into adverse (rain, sleet, snow, and fog) and non-adverse conditions. It was found that there were a significant interaction effect between weather condition and speed-related behaviors (p < .0001). Without considering driver’s speeding behavior, the adverse weather condition may lead to 26% more Car-Truck collisions than Car-Car collisions (OR = 1.26, p < .0001). Furthermore, due to the speeding behavior, the odds ratio is increased by 22% for the adverse weather condition vs good weather condition (OR = 1.22, p = .0002). However, there is no additional effect of the adverse weather condition on Truck-Car collisions compared to Car-Car collisions (p = 0.1724).
Adverse weather conditions increase the demand on driver/vehicle performance requirements [17]. Adverse envi-ronmental conditions (rain, fog, wet pavement) also showed
a clear association with the risk of an accident [18]. Golob and Regan [16] reported that the probabilities of a truck be-ing involved in an accident for wet freeways are higher than those for dry freeways. From this study, it showed that the professional truck drivers may perform better than the car drivers and are more likely to slow down when faced with adverse conditions.
Modeling Results for Fatal Crash Database (FARS)
Table 7 listed the model estimations and odds ratios for the FARS database while properly adjusting other significant independent variables.
Driver Age and Gender
Based on the FARS data analysis, the younger truck drivers are 57% (OR = 0.43, p < .0001) less likely and the older truck drivers are 35% (OR = 0.65, p = .0009) less likely to be at fault in the fatal Truck-Car angle collisions than the middle age truck drivers. This trend is similar to the GES data analysis possibly because the truck driver’s population ratio of the middle age to younger and older age is larger than that for the passenger vehi-cle driver. The older car drivers are 35% (OR = 1.35, p = .0084) more likely to be at fault than the middle-age car drivers in the fatal Car-Truck collisions, but there is no significant risk differ-ence between younger car drivers and middle-age car drivers (p = .7373). Compared to the GES analysis, this FARS result indi-cated that involving the Car-Truck collisions increases the crash severity for both younger and older car drivers.
Table 7. Model Estimation and Odds Ratios of Significant Independent Variables for the FARS Database
Parameter Comparison Function Number Estimate Standard Error Pr > ChiSq Odds Ratio (OR)
1 -4.4336 0.2581 <.0001
Intercept
2 -2.3339 0.146 <.0001
1 -0.8542 0.1296 <.0001 0.43
Young vs Middle age
2 -0.0356 0.106 0.7373 0.97
1 -0.4258 0.128 0.0009 0.65
Age
Old vs Middle age
2 0.3026 0.1149 0.0084 1.35
1 1.698 0.1747 <.0001 5.46
Gender Male vs Female
2 -0.0703 0.0806 0.3833 0.93 1 0.901 0.1395 <.0001 2.46 Dark vs Daylight 2 -0.1518 0.1767 0.3903 0.86 1 -0.8768 0.1496 <.0001 0.42 Light condition
Dark but lighted vs
Day light 2 0.0675 0.1418 0.6343 1.07
1 -1.6277 0.1719 <.0001 0.20
Alcohol Drinking drinking vs Non
2 -0.1667 0.108 0.1228 0.85
1 0.3941 0.107 0.0002 1.48
Weather condition Adverse verse vs Non
ad-2 0.16ad-24 0.1184 0.1701 1.18
1 0.4014 0.1071 0.0002 1.49
National Highway National Highway Non National vs
2 0.5919 0.1186 <.0001 1.81 1 0.2104 0.1066 0.0485 1.23 National Highway * Weather condition National Highway, Adverse 2 0.3175 0.1183 0.0073 1.37
Furthermore, the gender effect of truck drivers on fatal collisions is consistent with the GES data analysis: male truck drivers are 446% more likely to be at fault than female truck drivers in the fatal Truck-Car collisions (OR = 5.46, p < .0001). However, there is no significant difference in the fatal Car-Truck collisions between male and female car driv-ers (p = .3833).
Lighting Condition
Truck being at fault was statistically significant in case of lighting condition. Comparatively, faulty truck drivers are 146% more likely to result in Truck-Car collisions under dark conditions than day light conditions (OR = 2.46, p < .0001), while the truck drivers are 58% less likely to be at fault in Truck-Car collisions under the dark but lighted con-ditions than the day light concon-ditions (OR = 0.24, p < .0001). Clearly, improving lighting conditions would reduce the number of fatal Truck-Car collisions caused by truck driver’s fault. However, there is no significant effect of light condi-tion on car drivers in the fatal Car-Truck collisions compared to the Car-Car collisions.
Alcohol Use
It was found that truck drivers are 80% less likely to in-volve alcohol use resulting in the fatal Truck-Car collisions than car drivers in Car-Car collisions (OR = 0.20, p < .0001). This trend is similar to the finding in the GES data analysis, which can by explained as commercial or professional driv-ers are less likely to involve alcohol use. However, the effect of alcohol use on the fatal Car-Truck collisions is not signifi-cantly different from that on the Car-Car collisions (p = .1228).
National Highway and Weather Condition
The variable of national highway is categorized into na-tional highway system or non-nana-tional highway system. The National Highway System (NHS) of the United States comprises approximately 160,000 miles of roadway, including the Interstate Highway System as well as other roads, which is important to the nation's economy, defense, and mobility. It was found that there is a significant interac-tion effect between nainterac-tional highway and weather condiinterac-tion (p = 0.0075). In the non-national highway system, the truck drivers are 48% more likely to be at fault resulting in the fatal Truck-Car collisions under adverse weather conditions than normal weather conditions (OR = 1.48, p = .0002); however there is no significant effect of weather condition on the fatal Car-Truck collisions (p = 0.1701). In the national highway system, the odds ratios of truck drivers and car drivers are significantly increased in the fatal Truck-Car col-lisions (OR = exp(0.3941+0.2104) = 1.83, p = .0485) and the fatal Car-Truck collisions (OR = exp(0.1624+0.3175) = 1.62, p = .0073) under adverse weather conditions vs normal weather conditions. The results indicated that adverse weather conditions can cause both truck and car drivers to be at fault and result in fatal truck/car collisions especially in the national highways with higher traffic volume, larger truck percentage, and higher speed limit design.
CONCLUSIONS AND DISCUSSIONS
Truck/car angle collisions have a higher crash frequency than the other truck-involved collision types and tend to
re-sult in driver injury and death. This paper investigated the tendency of truck-involved angle collisions related to driver characteristics and traffic environment factors using both GES and FARS databases.
The statistical modeling results of the multinomial logis-tic regression indicated that compared to the Car-Car acci-dents, the younger car or truck drivers are less likely to be at fault resulting in the truck-involved accidents than the mid-dle-age drivers; the older truck drivers also have smaller accident involvement ratio than the middle age truck drivers, but the older car drivers are more likely to be at fault in the fatal truck-involved accidents than the middle-age car driv-ers. The findings indicated that more detailed studies corre-sponding to the middle-age truck drivers’ driving behaviors are needed since they constitute the majority of the transpor-tation occupation population. Clearly, the driving capability of some older people is affected by age-related changes in sensory, cognitive, physical abilities, and medical conditions. Older drivers experience a higher annual driving related fa-tality rate per mile driven than all age categories, other than teenagers [2]. Aiming at safe driving and crash prevention of older drivers, numerous studies have focused on older driv-ers’ retraining programs [19]. The finding in this research implied that the truck-involved angle collisions should be considered as an important scenario design for retraining or education programs for the purposes of reducing older driv-ers’ fatality rate.
Both the GES and FARS analyses indicated that com-pared to the Car-Car accidents, male truck drivers have a much larger crash involvement ratio in Truck-Car collisions than female truck drivers. However, this result could be bi-ased due to the high concentration of males in transport re-lated occupations. More detailed studies, based on finer measures of exposure, are needed in order to better under-stand the gender effect on large truck crashes.
An interesting finding of this study is that the lighting condition plays an important role on truck-involved angle collisions. Dark conditions may cause a higher likelihood of car drivers being at fault in angle collisions with trucks and a higher likelihood of truck drivers being at fault in fatal angle collisions. However, compared to daylight conditions, both car and truck drivers’ crash involvement ratios would be significantly lower under dark but lighted conditions. Several early studies of combination truck crashes concluded that increasing the visibility of heavy trailers in dark conditions would reduce truck/car collisions [15, 20]. Therefore, im-proving either the conspicuity of truck trailers or lighting design of the highway might reduce the frequency and sever-ity of truck-involved angle crashes.
This study confirmed that adverse weather conditions would increase the crash likelihood for both Truck-Car and Car-Truck angle collisions, especially when car drivers are speeding or trucks are traveling in the national highway sys-tem. Because vehicles’ brake distances are greatly increased due to the slippery surfaces during rain, the probability that drivers successfully avoid crash occurrences would reduce. Brodsky and Hakkert [21] reported that the added risk of an injury accident in rainy conditions can be substantial, two to three times greater than in dry weather. Although fog was not recorded as the prevailing weather in road accidents, it was found that the highest proportion of fog accidents
di-rectly correlate with the incidence of the hazard [22, 23]. In addition to educating drivers to reduce speeds and increase the gap distance between vehicles, there are multiple engi-neering countermeasures associated with reducing angle col-lision occurrences due to weather conditions, such as lowing speed limit in the adverse weather through variable speed limit signs, improving signal visibility of traffic signals, us-ing wet weather warnus-ing signs for advisus-ing of slippery sur-faces, and utilizing ITS technologies to update drivers in-formation of weather and traffic. However, the benefits of the designs are various, unclear, and suggested to be further investigated.
Inadequate highway design would lead to incompatibili-ties with vehicle, driver or both. In this study, it was found that compared to undivided highways, both truck and car drivers are more likely to be at fault resulting in truck-involved angle collisions on divided highways. This trend is greatly aggravated when drivers are speeding or involve al-cohol use. Khattak et al. [24] indicated that truck-involved collisions occurred more frequently on two-way divided and protected roadways, as opposed to two-way undivided con-figurations. Generally, truck vehicles are very long and diffi-cult to turn. It is often necessary for the truck drivers to use two lanes of traffic to make a right turn in order to avoid running the rear wheels into parked vehicles or over a side-walk. For the undivided highways, truck drivers can utilize opposing lanes to obtain more receiving lanes for the turning maneuvers. However, for the divided highways with raised concrete medians or barriers, they may restrict the truck’s turning path especially when the curve radii are not suffi-cient for combination trucks. For that situation, truck drivers require the back and forth action and longer operation time to complete turning at intersections. Thus, truck drivers may fail to yield the right of way of the conflicting traffic, and the other car drivers may misunderstand the truck vehicle’s ac-tion. It is suggested to conduct in-depth analyses of geomet-ric factors related to driver performances and behaviors in the car-truck conflicts at intersections with divided highways in order to identify the errors, misbehaviors, or other im-proper actions of passenger car drivers responding to a truck crossing or turning into the road at junctions.
Furthermore, this study showed that alcohol use can in-crease car driver’s likelihood of contributing angle crashes with trucks; however truck drivers are found to be less likely to involve alcohol use resulting in Truck-Car collisions than car drivers. Williams [25] listed the overall approaches of reducing the alcohol-impaired driving problem, including a broad public health approach, strong enforcement, and de-velopment of technologies for tracking the locations and drinking of drivers convicted of impaired driving. Since truck-involved angle collisions tend to result in higher crash severities, attention to countermeasures aimed at car-truck interacting behaviors associated with alcohol use is empha-sized by this study.
On summary, the following conclusions drawn from this study would contribute to the further attention to the research topic and potential uses in the relevant transportation areas: • angle collision frequency is highest in all types of
car-truck collisions and increases as the driver injury se-verity increases;
• truck-involved angle collisions should be considered as an important scenario design for retraining or edu-cation programs for the purposes of reducing older drivers’ fatality rate;
• improving either the conspicuity of truck trailers or lighting design of the highway would reduce the fre-quency and severity of truck-involved angle crashes; • enhancing incompatibilities between truck, car, and
highway design related to geometric factors would improve truck drivers’ performances and behaviors at intersections so as to reduce truck-involved angle col-lisions at intersections;
• adverse weather conditions would increase the likeli-hood of truck-involved angle collisions and compre-hensive methods including education, engineering, and technology are needed to enhance driver’s safety awareness and assist both car and truck drivers in travelling under severe weather conditions; and • further truck-car interaction behavior studies that are
related to driver characteristics, road environments, and highway designs using driving simulators or in the field would greatly complement this study’s find-ings about crash propensities of truck-car collisions. LIMITATIONS OF THIS STUDY
At last, some limitations of this study need to be recog-nized by authors. First, although the GES and FARS data-bases are the largest traffic crash database available in the United States, it provides only national data, not State-level data. These data come from police investigations using evi-dence from multiple sources of questionable consistency across a range of different police officers, and the police reports may not always provide detailed information regard-ing the crash causation. In 2006, the Large Truck Crash Cau-sation Study (LTCCS) data were released. LTCCS is a na-tional study program to attempt to determine the critical events and associated factors that contribute to serious large truck crashes. The data collected provide a detailed descrip-tion of the physical events of each crash, along with an un-precedented amount of information about all the vehicles and drivers, weather and roadway conditions, and trucking com-panies involved in the crashes. Our research is an explora-tory data analysis (EDA). The further in-depth analysis based on LTCCS is suggested to test those hypotheses em-phasized in this study. Additionally, because exposure data on large truck travel are generally crude and hardly avail-able, the GES and FARS database were used to investigate car-truck angle crash risk using relative risk methods, but not crash risk measures based on the exposure such as vehicle miles of travel (VMT). However, as mentioned before some crash risks identified in this study can still be attributed to exposure. For example, there are more male truck driver than female truck drivers, trucks tend to operate on weekdays, and there are more middle aged male drivers in truck drivers than those in car drivers. If there are other databases that have more consistent and reliable exposure data to support car-truck crash risk analyses, it is suggested to use them to com-plement the results from this study.
REFERENCES
[1] E. Zaloshnja and T.R. Miller, “Costs of large truck-involved crashes in the United States”, Accid. Anal. Prevent., Vol. 36, pp. 801-808, 2004.
[2] National Highway Traffic Safety Administration (NHTSA), “Traf-fic Safety Facts 2003”, [Online] Available: www-nrd.nhtsa.dot.gov/pdf/nrd-30/NCSA/TSFAnn/TSF2003F.pdf [Ac-cess date, Feb, 2007].
[3] Federal Motor Carrier Safety Administration (FMCSA), “Large Truck Crash Profile: The 1999 National Picture”, Washington, D.C.: U.S. Department of Transportation, 2001.
[4] D. Blower, “The Relative Contribution of Truck Drivers and Pas-senger Vehicle Drivers to Truck-PasPas-senger Vehicle Traffic Crashes”, Publication No. UMTRI-98-25, University of Michigan Transportation Research Institute, Ann Arbor, 1998.
[5] J. Stuster, “The Unsafe Driving Acts of Motorists in the Vicinity of Large Trucks”, U.S. Department of Transportation, Federal High-way Administration, Washington, DC, 1999.
[6] L.P. Kostyniuk, F.M. Streff, and J. Zarajsek, “Identifying Unsafe Driver Actions that Lead to Fatal Car-Truck Crashes”, AAA Foundation for Traffic Safety, Washington, DC, 2002.
[7] F.M. Council, D.L. Harkey, D.T. Nabors, A.J. Khattak and Y.M. Mohamedshah, “Examination of ‘Fault,’ ‘Unsafe Driving Acts,’ and ‘Total Harm’ in Car-Truck Collisions”, Transp. Res. Rec., 1830, pp. 63-71, 2003.
[8] M. Abdel-Aty and H. Abdelwahab, “Analysis and prediction of traffic fatalities resulting from angle collisions including the effect of vehicles’ configuration and compatibility”, Accid. Anal. Prev., vol. 36, pp. 457-469, 2004.
[9] National Highway Traffic Safety Administration (NHTSA), “Fatal Accident Reporting System (FARS)”, US Department of Transpor-tation, Washington, DC, 2005.
[10] National Highway Traffic Safety Administration (NHTSA), “Gen-eral Estimates System (GES)”, US Department of Transportation, Washington, DC, 2005.
[11] D.P. Allison, Logistic regression using the SAS system, John Wiley & Sons, Inc North Carolina, 1999.
[12] SAS Institute Inc., SAS OnlineDoc® 9.1.2., SAS Institute Inc., Cary, NC, 2004.
[13] E. Cerrelli, “Trends in Large Truck Crashes”, Report number: DOT HS 808 690, National Center for Statistics and Analysis. 1998. [Online] Available: http://www-nrd.nhtsa.dot.gov/pdf/nrd-30/NCSA/Rpts/1998/LargeTruck.pdf. [Access date, Feb, 2007]. [14] S. Boufous and A. Williamson, “Work-related traffic crashes: A
record linkage study”, Accid. Anal. Prev., Vol. 38, pp. 14-21, 2006. [15] C. Morgan, “The Effectiveness of Retroreflective Tape on Heavy
Trailers”, Report number: DOT HS 809 222, National Highway Traffic Safety Administration, Washington, DC, 2001.
[16] T.F. Golob and A.C. Regan, “Traffic Conditions and Truck Acci-dents on Urban Freeways”, Report # UCI-ITS-WP-04-3. Institute of Transportation Studies, University of California, Irvine, 2004. [17] S.C. Joshua and N.J. Gerber, “A causal analysis of large vehicle
accidents through fault tree analysis”, Risk. Anal., Vol. 12, pp.173-87, 1992.
[18] M. Hijar, C. Carrillo, M. Flores, R. Anaya and V. Lopez, “Risk factors in highway traffic accidents: a case control study”, Accid. Anal. Prev., Vol. 32, pp. 703-709, 2000.
[19] A. Kua, N.K. Bitensky, J. Desrosiers, M. Hing and S. Marshall, “Older driver retraining: A systematic review of evidence of effec-tiveness”, J. Safety Res., Vol. 38, pp. 81-90, 2007.
[20] D.J. Minahan and J. O’Day, “Car-Truck Fatal Accidents in Michi-gan and Texas”, University of MichiMichi-gan Highway Safety Research Institute, Report No. UM-HSRI-77-49, Ann Arbor, Michigan, 1977. [21] H. Brodsky and A.S. Hakkert, “Risk of a road accident in rainy
weather”, Accid. Anal. Prev., Vol. 17, pp. 147-154, 1988.
[22] J.B. Edwards, “Weather-related road accidents in England and Wales: A spatial analysis”, J. Trans. Geogr., Vol. 4, pp. 201-212, 1996.
[23] J.B. Edwards, “The Relationship Between Road Accident Severity and Recorded Weather”, J. Safety. Res., Vol. 29, pp. 249-262, 1998. [24] A.J. Khattak, D. Rodriguez, F. Targa, and M. Rocha,
“Understand-ing the Role of Truck-Driver, Occupational and High-Risk Road-way Factors in Truck-Involved Collisions”, Southeastern Transpor-tation Center, University of Tennessee, Knoxville, TN, 2003. [On-line] Available: http://stc.utk.edu/htm/pdf%20files/trollover.pdf, [Access date, Feb, 2007].
[25] A.F. Williams, “Alcohol-impaired driving and its consequences in the United States: The past 25 years”, J. Safety Res., Vol. 37, pp. 123-138, 2006.
Received: November 5, 2008 Revised: January 20, 2009 Accepted: January 21, 2009
© Yan et al.; Licensee Bentham Open.
This is an open access article licensed under the terms of the Creative Commons Attribution Non-Commercial License (http://creativecommons.org/licenses/by-nc/3.0/) which permits unrestricted, non-commercial use, distribution and reproduction in any medium, provided the work is properly cited.