doi:10.1144/GSL.SP.1996.099.01.22
1996; v. 99; p. 297-320
Geological Society, London, Special Publications
J. D. Van Wees, S. Cloetingh and G. de Vicente
2D finite element and 3D flexure models
The role of pre-existing faults in basin evolution: constraints from
Geological Society, London, Special Publications
service
Email alerting
article
to receive free email alerts when new articles cite this
click here
request
Permission
click here
to seek permission to re-use all or part of this article
Subscribe
Publications or the Lyell Collection
to subscribe to Geological Society, London, Special
click here
Notes
Downloaded by
on 17 May 2007
London
The role of pre-existing faults in basin evolution:
constraints from 2D finite element and 3D flexure models
J. D. V A N W E E S 1, S. C L O E T I N G H 1 & G. D E V I C E N T E 2
1 Vrije Universiteit, Instituut van Aardwetenschappen, De Boelelaan 1085, 1081 H V Amsterdam, The Netherlands
2 Universidad Complutense de Madrid, Facultad de Ciencias Geologicas, Departamento de Geodinamica, 28040 Madrid, Spain
Abstract: The lithospheric driving forces which cause intraplate basin deformation are relatively constant over large areas. Consequently, lateral variations in deformation and stress and strain concentrations seem to be primarily caused by (pre-existing) heterogenities in the rheological signature of the continental lithosphere underlying the sedimentary basins. In this paper, we explore the weak character of upper crustal faults and their control on basin shape for a number of case studies on intraplate Phanerozoic basin settings, using a 2D finite element and a 3D flexure model. Of key importance is the integration of seismic data and field observations with the tectonic modelling, allowing the investigation of deformation processes and their expressions on different scales, operating on different levels of the lithosphere. Finite element models for sub-basin scales, incorporating weak upper crustal faults, predict strong control of these weak zones on local stress distributions and subsequent deformation, in agreement with observed deformation patterns. Slip along upper crustal faults control stress distribution and subsequent faulting in overlying sedimentary rocks. The effect of weak upper crustal fault movements on basin-wide (regional) upper crustal flexure is looked at in two case studies on: (1) extensional tectonics in the Lake Tanganyika Rift Zone (East Africa); and (2) compressional tectonics in the Central System and Tajo Basin (Central Spain). Both settings indicate that basement warpings are controlled by large amounts of slip along so-called weak crustal-scale border faults, which are mostly planar. Adopting border fault displacements in the 3D flexure model, the results indicate low effective elastic thickness (EET) values in a range of 3-7 km for induced basement deflection patterns in accordance with observations. The low EET values most likely reflect a (partly) decoupling of upper crustal and subcrustal deformation, facilitated by the weak lower crust, and in agreement with standard rheological assumptions for Phanerozoic lithosphere. In contrast, the inferred weakness of upper crustal faults relative to surrounding rock is not evident from uniform rheological assumptions. However, observations of reactivations of faults which are not preferably aligned with the stress field, and reactivations of basin deformation on long time-scales are in support of this feature.
The lithospheric driving forces w h i c h cause intraplate basin deformation are relatively constant over large areas (Zoback et al. 1989; Mtiller et al.
1992; Zoback 1992). Therefore, lateral variations in deformation and stress and strain concentrations seem to be primarily caused by heterogenities in the rheological signature of the continental lithosphere underlying the sedimentary basins (Zoback et al.
1993). Following widely accepted concepts on lithospheric rheology (e.g. Brace & Kohlstedt 1980), numerical m o d e l l i n g studies on rift dynamics confirm that rheology strongly controls the distribution of rift activity and vice versa (e.g. Bassi et al. 1993). The actual trigger of rift localization can be small perturbations in an initially homogeneous material configuration and homogeneous thermal state of the lithosphere (e.g. Braun & Beaumont 1989). Then, further localiz-
ation and the associated lithospheric weakening is a function of (a) rift induced lateral variations in the thermal state of the lithosphere and (b) rift induced lateral variations in material distribution (England 1983; Kusznir & Park 1987). The latter found that rift i n d u c e d heating w e a k e n s the lithosphere, whereas crustal thinning has an opposite effect. The relative contributions heavily depend on the rift velocity, the distribution of crustal and subcrustal deformation, and the initial thermal and material state of the lithosphere (Buck 1991; Bassi et al.
1993). Thermo-mechanical models for a single extension phase, show that predicted styles of extension are in good agreement with observations on lithospheric scales (Buck 1991; Bassi et al.
1993).
For older basins, characterized by multiple phases of extension and an extremely low mean rift
From Buchanan, P. G. & Nieuwland, D. A. (eds), 1996, Modem Developments in Structural Interpretation, Validation and Modelling, Geological Society Special Publication No. 99, pp. 297-320.
298 J . D . VAN W E E S E T AL.
velocity, these types of models, tend to predict locking or widening of rift activity for each new phase (Braun 1992). This is in contradiction with observations for a large number of repeatedly reactivated basins, indicating that lithospheric deformation remains localized in a restricted domain over time-spans of more than 300 Ma (e.g. Western Europe, Ziegler 1990; Kooi 1991). It has been noted by many authors that deformation on these time-scales involves reactivation of tectonic structures at various scales, ranging from litho- spheric scale suture zones to basement faults (e.g. Wilson 1966; Hayward & Graham 1989; Ziegler 1990; Yielding e t al. 1991).
Some authors have stressed the importance of pre-existing heterogeneities in rheology and weak zones in the distribution of deformation on litho- spheric scales (Braun & Beaumont 1987; Dunbar & Sawyer 1988). Recent studies on a lithospheric scale (Van Wees & Stephenson 1995) show that repeated basin reactivation on long time-scales can be related to the existence of weak zones, deviating from standard theological assumptions (Van Wees & Stephenson 1995). On smaller scales, stress and strain iocalizations typically observed in basin- scale faulting, have been studied by analogue and numerical models, incorporating movement along pre-existing structural elements like pre-existing faults. These models have been used very success- fully to explain observed deformation distributions (e.g. Mandl 1988; McClay 1989; Kusznir & Ziegler 1992; Sassi e t al. 1993). The modelling results also indicate that the pre-existing structures exhibit a certain weakness, deviating from standard rheo- logical assumptions.
The characteristics of weak zones in perspective of standard assumptions on the rheological frame- work of the lithosphere have been the focus of very few studies (e.g. Ranalli & Yin 1990; Le Pichon & Chamot-Rooke 1991; Van Wees & Stephenson 1995). Furthermore, modelling studies incorpor- ating the effect of weak zones, either focus on large crustal and lithospheric processes or small-scale basement and fill processes.
In this paper, we examine the effect which (pre- existing) faults, have on the structural evolution of sedimentary basins on various scales. First, we will review continental lithosphere theology and show that upper crustal faults are most likely marked by a pronounced weakness relative to surrounding rock, and in the framework of a stratified litho- sphere theology are bound to have a strong influ- ence on basin shape. Subsequently, the controlling role of these weak zones, affecting the structural expression of basins, will be explored with a 2D finite element model and a recently developed 3D flexure model (Van Wees & Cloetingh 1994), with applications in a number of case studies on
Phanerozoic basin structures, offshore and onshore, integrating seismic data and field studies.
Lithospheric-scale rheological properties
of the continental lithosphere
Understanding of the rheological behaviour of rocks that constitute continental lithosphere stems from laboratory experiments in the brittle regime (i.e. strain-rate independent deformation) and ductile regime (i.e. strain-rate dependent) (e.g. Ranalli 1987). At geologically relevant time- scales these regimes are characterized by a Couiomb-Navier criterion and various creep laws, respectively.
At low confining pressures and temperatures, fracturing is predominant. Fracturing is described by a Coulomb-Navier criterion, given the com- pressive stresses predominant in the lithosphere (Jaeger & Cook 1976; Ranalli 1987). Commonly, it is assumed that cohesion is negligible and Andersonian stresses are adopted, which means that one of the principal stresses is vertical. In this case, the critical stress difference for sliding along new faults, with friction angle r and which form at an angle of ot =88 n - ~ 0 with respect to the largest principal stress direction, is given by (Sibson 1974; Ranalli & Yin1990):
(1 a, thrusting; (01 - o3) = (R - 1) p g z ( l - ~ ) o 1 horizontal, o 3 vertical) ( R - 1) (lb, normal faulting; (c~ 1 - o 3) = - - p g z ( 1 - Z) cr I vertical, R o 3 horizontal) R - 1 (lc, strike slip (cY 1 - o 3) - - - p g z ( 1 - ~ ) faulting, 1 + 5(R - 1) o 1, o 3 horizontal) where P is density, g acceleration of gravity, z depth, Z is the ratio of pore fluid pressure to over- burden pressure, R is principal effective stress ratio
((~1/(~ 3) : ( O 1 -- ~ . p g z ) / ( o 3 - E p g z ) , and factor 6
comes from substituting the intermediate principal stress o 2 = o 3 + 0(cy I - o 3 ) , 0 < ~ < 1 . The R is related to the coefficient of friction It(= tan (~)
as:
R = [(~t 2 + 1) 1/2 + ~]2 (2) Friction parameters hardly depend on rock type. Following Ranalli (1987), we adopt a value of 0 = 37~ (/a = 0.75) and we assume hydrostatic pore fluid pressure (Z ~ 0.4).
At high temperatures creep deformation mech- anisms dominate in the lithosphere. Numerous laboratory studies show that the critical principal differential stress necessary to maintain a given
ROLE OF PRE-EXISTING FAULTS 299 steady-state strain-rate, is a function of a power of
the strain-rate and varies strongly with rock type and temperature (e.g. Goetze & Evans 1979; Carter & Tsenn 1987; Tsenn & Carter 1987). Here we adopt power-law creep (e.g. Carter & Tsenn 1987):
((Yl - (~3)
= A-1/n gl/n e(E/nRT)
(3) where g is strain-rate, A, n and E flow parameters, T is absolute temperature and R the gas constant. Compilations of flow parameters for various rock- forming minerals show that power-law creep flow parameters are strongly controlled by silica content (e.g. Carter & Tsenn 1987). Felsic rocks (e.g. granite) show low critical differential stress values compared to mafic rocks (e.g. olivine), under similar conditions of strain-rate and temperature.Strength profiles
For a given tectonic environment (thrusting, normal faulting or strike-slip faulting), depth, flow properties, temperature and strain-rate, the lowest critical stress difference C y l - ~ 3 comparing equations (l) and (3), gives a rheological strength. For principal stress difference below this strength value, the imposed strain-rate will not occur. As a function of depth, the strength constitutes a yield envelope, or a so-called rheological profile, which provides much information on the spatial distri-
bution of lithospheric deformation (e.g. Ranalli 1987). Vertically integrated lithospheric strength, gives an estimate of intraplate force required to overcome lithospheric deformation (e.g. Kusznir & Park 1987; Ranalli & Murphy 1987).
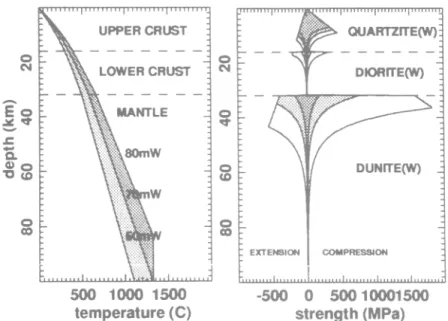
The construction of rheological profiles requires knowledge of the thermal regime, strain-rate, lithospheric material distribution and its flow properties. To construct theological profiles typical for a large number of phanerozoic basins, we adopt steady-state geotherms with surface heat flow ranging from Qs = 60-80 mW m -2 and for a crustal thickness of 32 km (cf. Pollack & Chapman 1977; Cermak & Bodri 1991). In rheological models of the crust, adopted flow properties commonly correspond to 2 or 3 layers of different rock types (e.g. Ord & Hobbs 1989; Braun & Beaumont 1989). Here we adopt 2 layers, a wet quartzite theology for the upper part of the crust and a wet diorite rheology for the lower crust (Carter & Tsenn 1987). For the subcrustal lithosphere we incor- porate a wet dunite rheology (Carter & Tsenn 1987). For strain-rate a value of 10 -15 s q is used, corresponding to intermediate values for intraplate deformation (e.g. Cloetingh & Banda 1992). The resulting rheological profiles for extension and compression (Fig. 1), are marked by upper crustal brittle strength, lower crustal ductile strength and brittle and/or ductile strength for the subcrustal lithosphere (Fig. 1). The relatively low strength of the lower crust predicted by these models, is a
Fig. 1. Steady-state geotherms and rheological profiles for various surface heat flow values (60, 70, 80 mW m -2) and 32 km crustal thickness, representative of Phanerozoic continental lithosphere. Adopted strain-rate is 10 -15 s q.
300 J. D. VAN WEES ET AL.
consequence of the adopted wet diorite rheology, which is characterized by relatively low estimates of ductile strength compared to other rock types. The weak ductile rheology in the lower crust generally agrees well with shallow earthquake depth distributions and high values of seismic attenuation in the lower crust (Meissner 1986).
R h e o l o g i c a l stratification
The rheological profiles in Fig. 1, show a pro- nounced layering of relatively strong (mostly brittle) upper crust, a weak (mostly ductile) lower crust, and a strong (brittle and ductile) subcrustal lithosphere. This layering predicted from extrapo- lation of rock mechanics data agrees well with interpretation of geophysical and geological data.
Deep seismic images of rifted continental litho- sphere for different areas (e.g. Meissner 1986; Brun
et al. 1991; Bois 1993) support the existence of
a rheological stratification. They show that, acoustically, the upper part of the continental crust has a rather transparent character with localized bands of dipping reflectors, interpreted as fault zones. On the other hand the lower crust is charac- terized by high reflectivity of discontinuous horizontal or gently dipping reflectors, inferred to be layered lower crust. The subcrustal lithosphere shows few reflective events; however, in some cases clear dipping reflectors offsetting the layered lower crust are observed (Flack et al. 1990). Kinematic deformation models for lithospheric extension derived from seismic profiles (e.g. Pinet & Coletta 1990; Reston 1990; Brunet al. 1991) are characterized by faulting along relatively steep faults in the upper crust, relatively low angle shear in the lower crust, and sometimes include activity of subcrustal lithospheric faults or shear zones (Fig. 2). Geological field observations also indicate activity of localized deformation in upper mantle rocks (Vissers et al. 1991).
The transition in the crust from steep faults to low angle shear is abrupt and can be explained as a transition from brittle to ductile deformation mechanisms (Jackson 1987; Pinet & Coletta 1990). This is supported by shear stress balance con- siderations (Mandl 1988) at the interface of low angle sheared lower crust and the overlying high angle sheared upper crust, indicating an abrupt transition from relatively strong upper crust to relatively weak lower crust. Both finite element models (Melosh 1990) and analogue models (Vendeville et al. 1987; McClay & Ellis 1987) support this feature.
The subcrustal deformation characteristics are poorly constrained from continental lithosphere data. However, oceanic and continental lithosphere flexure studies assessing flexural parameters from rheological assumptions of mantle material (e.g. Goetze & Evans 1979; Kooi et al. 1992), clearly support the validity of extrapolation from rock mechanics data, predicting a relatively strong subcrustal lithosphere.
W e a k n e s s o f crustal scale f a u l t s a n d s h e a r z o n e s
The rheological stratification of continental litho- sphere corresponds well to its main deformation characteristics. However, upper crustal faults and subcrustal faults and shear zones are marked by rheological properties which probably correspond to considerably lower strength values than those predicted from bulk properties of the lithosphere.
According to equation (1), faults in the upper crust form at an angle of o~ =5 ~ --~ ~ with respect to the largest principal stress direction ~1" For pre- existing faults, which have a different orientation, the critical principal stress difference for frictional sliding is higher than for new faults (Mandl 1988; Ranalli & Yin 1990). Seismic data indicate that most upper crustal faults are planar during their
Fig. 2. Reconstruction of continental lithospheric extension, based on deep seismic reflection profiles (after Reston 1990).
ROLE OF PRE-EXISTING FAULTS 301 formation (McGeary & Warner 1986; Jackson
1987; Kusznir et al. 1991) and can progressively rotate during extension according to the domino fault model (Ransome et al. 1910; Le Pichon & Sibuet 1981; Wernicke & Burchfiel 1982; Barr 1987). Finite element and analogue models for extension support formation of steeply dipping upper crustal normal faults, which are remarkably planar in origin (Vendeville et al. 1987; McClay & Ellis 1987; Cundall 1990). Both observations and model results show that listric basin faults can be generated due to progressive rotation of the crustal planar faults and growth faulting, interacting with buoyancy forces (Vendeville & Cobbold 1988; Buck I988, VendevilIe 1991). However, in some cases, inferred listric crustal faults do not agree with the domino fault model and require formation of initially listric faults (Wernicke & Burchfiel 1982; Gibbs 1984). In a similar fashion to the domino model, initially listric faults probably rotate during extension (Le Pichon & Chamot-Rooke 1991).
The rotation of crustal faults and continuous strain localization during extension, require either a change of frictional properties once these faults are formed, or a change in orientation or magnitude of principal stresses close to the rotating faults. These conditions also apply for reactivation of normal faults during inversion (e.g. Hayward & Graham 1989), and transpressional and transtensional reactivation of strike slip faults (e.g. Ziegler 1990). Sibson (1985) explained the continuous activation of extensional faults in terms of reduction of cohesion. However, for low initial cohesion values, like the ones adopted in equation (1), this is not a plausible mechanism. Alternatively, reduction of friction angle ~ has been considered (Ranalli & Yin 1990; Yin & Ranalli 1992). Sand box experiments on reactivation of extensional faults during inversion, support decrease of friction angle, in the models induced by alignment of mica flakes along extensional faults (McClay & Ellis 1987). In addition, numerical mechanical models for extension demonstrate a decrease of magnitude of the principal stresses close to previously formed faults (Cundall 1990). These indicate that stress deviations also may play an important role in localization. Evidently, the decrease in principal stresses close to such faults can be described in terms of an additional reduction of friction angle in equation (1).
The weakness of subcrustal faults or shear zones is indicated by localized deformation. If behaving brittle, subcrustal faults can be characterized by weakening similar to the upper crustal faults. In the ductile regime, various strain softening mechanisms support weakening (e.g. Drury et al. 1991). Furthermore, recent studies on the evolution
of integrated strength of the lithosphere (Van Wees & Stephenson 1995) indicate that reduction of subcrustal strength is neccessary in order to explain localization of basin deformation on long time- scales of the order of 300 Ma.
Sub-basin-scale (local) stress and strain
concentrations: 2D finite element models
As outlined in the previous section, upper crustal faults, the lower crust, subcrustal faults and shear zones can be defined as (pre-existing) zones of weakness, in the sense that they indicate low strength relative to surrounding rocks. Linkage and discontinuities of these weak zones and their actual shape, are bound to have a large impact on styles of lithospheric deformation. Assuming a weak coupling of subcrustal and upper crustal deforma- tion, which is suggested for a large number of Phanerozoic basins (Fig. 2) (Van Wees & Cloetingh 1994; Burov & Diament 1995), the structural expression of basins seems therefore to be primarily controlled by the movements along weak upper crustal faults, interacting with the rheological behaviour of the upper and lower crust and basin infill. In this and the following section, we will explore respectively the effects of these interactions on local stress and strain concentrations with a 2D finite element technique and basement warping on a more regional scale with a recently developed 3D flexure model (Van Wees & Cloetingh 1994). S t r e s s a n d s t r a i n c o n c e n t r a t i o n s
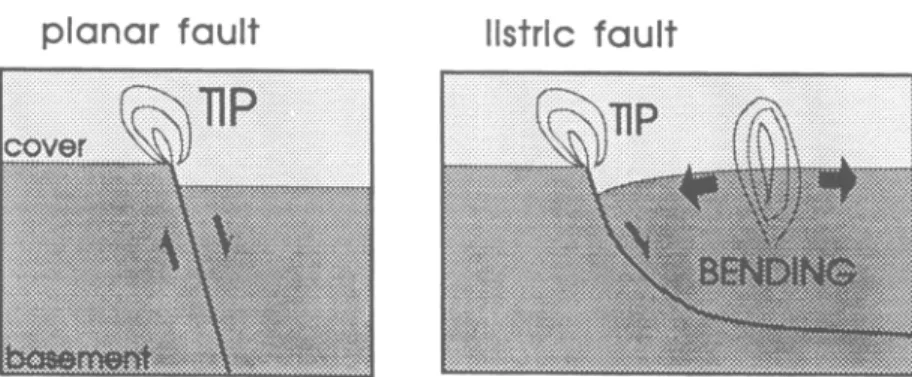
After a stage of tectonic quiescence and sedimen- tation, weak upper crustal faults, grading into unfaulted sediments and soling in the lower crust, will induce large stress concentrations occurring at the tip of the weak faults when reactivated (Fig. 3). This will particularly occur during multiple phases of rifting or inversion. In addition, large bending stresses can occur in the case of listric faults (Fig. 3). The stress concentrations are likely to have a strong control on the locus and signature of new faults during progressive basin deformation for both extension and compression (inversion).
Here, we examine the effects of stress and strain concentrations induced by movements along pre- existing fau'ts, using a 2D elasto-plastic plane- strain finite. ' ;ment model, and compare them with observation~ and alternative modelling results.
The finite element model we use is an extension of the TECTON code originally developed by Melosh & Raefsky (1981). A typical model con- figuration and pertinent model parameters are given in Fig. 4. Pre-existing weak zones are represented by frictionless slippery nodes (Melosh & Raefsky 1981). Failure induced by incremental movements
302 J. D. VAN WEES ET AL.
Fig. 3. Stress concentrations due to slip along weak upper crustal planar and listric faults.
along the slippery nodes obeys the Coulomb- Navier criterion, which is incorporated by adopting a non-associated flow-law with hardening of the elastic moduli in the element stiffness matrix (Zienkewicz & Taylor 1991). For the non- associated flow-law, friction angle 0= 35" and dilatation angle ~ = 5 ~ The adoption of a non- associated flow-law with relatively low dilatation angle agrees with other finite element models on rock-mechanics (e.g. Cundall 1990; Nieuwland & Waiters 1993), preventing an unrealistically large plastic volume increase. Predicted stresses which according to the yield criterion are outside the yield surface are corrected to the yield surface adopting a return algorithm (e.g. Zienkiewicz & Taylor 1991).
Finite element model results
To study the effects of extension along a pre- existing weak planar basement fault, we adopt a
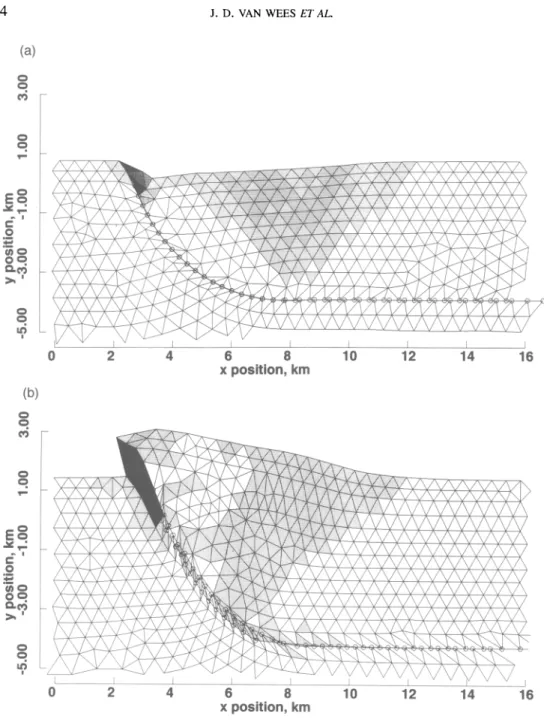
fault dip of c. 30 ~ grading into 1000 m of un- faulted sediments, and apply 54 m of hangingwall displacement in 700 increments (first 200 increments account for 4 m of displacement). The results depicted in Fig. 5a indicate a symmetric pattern of basin floor warping, bounded by basin faults (plastic shear bands in Fig. 6a) rooting in the pre-existing fault. These results agree both with observations (Yielding et al. 1991; Fig. 5b), and predictions from analogue and distinct element models (Buchanan & McClay 1991; Saitzer & Pollard 1992). It is noted that the orientation of the shear bands are sensitive to the mesh orientation.
For extension along a listric fault, we adopt a curved geometry for the basement fault, dipping from c. 70 ~ to subhorizontal and grading into 500 m of unfaulted sediments. We apply a horizontal hanging-wall displacement of 6 9 m in 1500 increments (first 200 increments account for 4 m). The results in Fig. 6a show a more asymmetric
P = 2'3xi03 unfaulted . g = 9.8 sedlments i I E = 7 x l O I 0 - ql
v= 0.35
~ f a u l t
i
li:i * = a s ~ :I~ "=5~
f~176
wall
"~~
--
:
L
Fig. 4, Cross-section showing finite element model parameters and boundary conditions, g = gravity, p = density of sediments and basement. Elastic parameters: E = Young's Modulus, v = Poison's Ratio. Plastic parameters: C = Cohesion, r = friction angle, ~ = dilatation angle.
ROLE OF PRE-EXISTING FAULTS 303
pattern of basement warping, compared to planar faulting and the development of hanging-wall collapse structures. These features correspond to observed fault patterns and basement bathymetry evolving above listric upper crustal faults (Wernicke & Burchfiel 1982; Gibbs 1984) and agree with results from sand box models (McClay 1989). To examine the effects of inversion on listric faults, we use the same fault geometry as for extension but now apply opposite hanging-wall displacements (170 m in 900 increments, of which first 10 m in 100 increments). The results (Fig. 6b), show buttress effects and footwall shortcuts, which agree with geological observations (Hayward & Graham 1989) and sand box models (McClay 1989; Buchanan & McClay 1991).
Basinwide (regional) basement warping:
3D flexure models
In general, rifted basins are formed at a much larger scale than individual basement fault blocks. Basement bathymetry inferred from seismic reflection profiles reveals that rifted basins are characterized by complex block structures, inter- sected by a large number of steeply dipping faults, with spacing in the order of 10 km (Rosendahl 1987).The basin block structure is bounded by so- called border faults (Versfelt & Rosendahl 1989), which relative to the other rift block faults show markedly greater fault displacements (Fig. 7). The displacements vary along-strike of the border faults and in map view they have a slightly to pronounced
304 J.D. VAN WEES ET AL.
Fig. 6. Finite element models for (a) extensional and (b) compressional plastic deformation at the tip of a frictionless listric detachment. Model, material and figure conventions as in Figs 4, 5.
arcuate shape (Rosendahl 1987; Fig. 7). It has been noted that the alignment of border faults has a large influence on patterns of basement warping (e.g. Rosendahl 1987). The most elementary basin geometry is a half-graben, in which only one side of the basin is bounded by a border fault. More complex basin geometries are the result of linkage of a number of border faults and associated
half-grabens. As pointed out by Versfelt & Rosendahl (1989), rift block faults, outside the border faults, play a passive role, and merely accommodate deformation.
Some authors have suggested that large basin floor geometries are controlled by crustal-scale listric faults (e.g. Kusznir et al. 1987). However, more recent two-dimensional basin modelling
R O L E O F P R E - E X I S T I N G F A U L T S 305
Fig. 7. Example of linked half-grabens bounded by border faults (modified from Rosendahl 1987). Opposing geometries create INterference Accommodation Zones (INAZ).
studies indicate that the basement warpings are most likely a result of planar faulting with tilting of the basement induced by buoyancy forces (Fig. 8) (Marsden et al. 1990; Kusznir & Ziegler 1992). In the latter studies, the upper crustal rift blocks are considered as an elastic entity, floating on the lower crust and/or subcrustal ductile substratum. 2D modelling results show that the wavelength of curvature of basement topography between border faults are closely related to the flexural charac- teristics of the upper crust in terms of effective elastic thickness (EET) (e.g. Kusznir et al. 1991).
upper crest
lower crust
Mantle xl x2
M o h o
Fig. 8. Representation of lithospheric extension by faulting in the upper crust and by ductile flow in lower crust and mantle (after Kusznir et al. 1991 ).
Evident basin features in this respect are convex curvatures of basement topography, which are commonly referred to as Low Relief Accom- modation Zones or Interference Accommodation Zones (Fig. 7) (Rosendahl 1987; Versfelt & Rosendahl 1989).
The relative weakness of crustal-scale faults compared to surrounding rock, most likely provides a driving mechanism to induce the observed basement flexure. Consequently, border normal faults, and indeed any type of weak crustal-scale fault would be expected to exert a strong control over upper crustal flexure during extension and compression.
Here we will analyse basin flexure patterns in both extensional and compressional settings, using a recently developed 3D basin modelling tech- nique, incorporating flexure and planar faulting (Appendix; Van Wees & Cloetingh 1994). This model, focusing on the interaction of border faulting and flexure of the upper crust and its controls on three-dimensional basement warping, will allow us to appraise the full three-dimensional complexity of basin shape, evident from high quality datasets.
E x t e n s i o n a l setting: L a k e T a n g a n y i k a Rift Z o n e (east A f r i c a )
To study the interaction of faulting and 3D flexure in an extensional regime, we focus on the northern part of the Lake Tanganyika Rift Zone (Fig. 9) which forms part of the north-south trending Western Branch of the East African Rift System. Seismic data show that the rifted area is composed of a number of mostly Cenozoic half-grabens, bounded by planar faults, linked in a complex way by accommodation zones (Fig. 11) (Rosendahl
et al. 1992). The grabens were formed under E - W extensional stress conditions, with minor compo- nents of oblique slip (Delvaux et al. 1992; Ring
et al. 1992). The N-S trending border faults
indicate mainly dip-slip behaviour, whereas the NW-SE trending border faults, most likely rooting in Proterozoic dislocation zones (Rosendahl et al.
1992), accommodate half-graben polarity changes (Rosendahl et al. 1992).
For a three-dimensional flexure model of the northern part of Lake Tanganyika (Fig. 9), we adopt a 60 x 80 grid (spacing Ax = Ay = 5 km). Focusing on the wavelength of basement tilting patterns, displacements along the minor rift block faults are neglected. Minimum throw values for the border faults have been constrained from water depth and sediment thickness derived from seismic data (Morley 1988; Rosendahl et al. 1992; Fig. 9a). In the depth conversion a low mean seismic velocity of 2.75 km s is adopted from Morley
306 .1. D. VAN WEES ET AL. uJ~l 0017 __J U_I I I I _a o / ' ~ ' , " - . / Z', " ~ ' , a y i o i
cb
,.,,..,.
"~ N~]OO N'dI(]NI
E 0 0 c O .~.=.~.~ #
~,~ .~
ii ~
r00.;
#
m ~I5 ~~.~
,,,-,
~ s
WES1ERN
Illf -z~
!,
~!
r i ' '1
i
,o
P - , 0 ~~ , ~ :
,
, ' ~
,'
',
~ . Z , '
. ~ ' , ~
i 'cO
'oO
(:D
oo
~ EG0 i~..~ O -
o .= :-5 = o~%-o o=.go=~ = .=..-~ .~. ,,~ ,..-.,, .,-~ . < ~ROLE OF PRE-EXISTING FAULTS 307 (1988), and effects of moderate dip of reflectors
have been neglected. Additional amounts of throw along the border faults are reflected by present-day topographic elevations of footwall blocks bounding Lake Tanganyika, which range up to 1000 m or more above lake level. In the absence of data on erosion of footwall blocks, precise estimates of this component cannot be made.
To incorporate effects related to crustal thinning,
fault dips of 60 ~ are adopted, and we assume a crustal thickness of 40 km, values that agree with data published by Ebinger et al. (1991). For the distribution, we assume a radius r 1 for the spherical cap function (see Fig. A1) of 50 km. It is assumed that depressions (w < 0) are filled with low density material (9 = 2.0 • 103 kg m-3), accounting for water and sediment infill, and that no erosion of basement culminations (w > 0) occurs.
308 J . D . VAN WEES ET AL. Starting from the minimum throw estimates
derived from seismic data, throw values have been increased to fit migrated basement depths for four seismic sections (Figs 9, 10 & 11). Figure 11 shows flexural response results for different values of EET for a fixed throw distribution which agrees closely with observed basement depths. The three- dimensional flexural response for an EET of 5 km is shown in Fig. 10a and 10b.
The results show that the flexure model incor- porating the effects of border faulting is well capable of reproducing observed 3D basement warping patterns. As is evident from Fig. 11 the
wavelength of calculated basement warping is
largely controlled by EET.In profile 206, the wave- length of the observed interference accommodation zone, marked by a convex shape in basement
I - 206 E ==o 10 20 30 40 50 6 0 70 I I - 2 1 0 ..-.. r ~ 10 20 30 40 50 6 0 70 III - 212 ' ,-,= 10 20 30 40 50 6 0 70 IV - 218 - NET 3km r - EET 5km ' - " - EET 7krn " - ~ seismic dala i 10 2 0 30 40 50 6 0 70 d i s t a n c e (km)
Fig. 11. Sections of three-dimensional flexure models of northern Lake Tanganyika for three values of EET (3, 5 and 7 km) and a fixed throw distribution, which agrees closely to observed basement depths in seismic sections 206, 210, 212 and 218 (after Van Wees & Cloetingh 1994). Locations of sections are indicated in Fig. 9b.
tilting, corresponds best to an EET of 3 km. For larger values of EET the flexural wavelength is too large to predict a convex shape. Also for the southern lines, the lateral variations of basement tilting best fit an EET of 3 kin.
From a comparison of amplitudes of calculated deflection with observed ones, the best fitting EET values tend to be higher: 5 km for profile 210 and 7 km for profile 212. These values differ from the EET values derived from the flexural wavelength. This discrepancy can probably be explained by the fact that the model is not taking into account plastic deformation in between border faults, characterized by displacements along minor faults (Fig. 9a). Furthermore, the model fails to predict present-day submersion of the horst block left, right and in the centre of seismic sections 224, 216 and 224 respectively. This effect can be explained by the lack of basement erosion in the model and the relative large displacements along minor faults, adjacent to the border fault.
Summarizing, the modelling results indicate that the EET for upper crustal flexure in the northern part of Lake Tanganyika is characterized by a low value of about 3-5 km. The low EET values corre- spond well to estimates of EET for basement warping patterns in 2D flexure studies on exten- sional basins (Buck 1988; Stein et al. 1988; Kusznir & Ziegler 1992). Kusznir et al. (1991), indicated that the relatively low values of EET probably reflect a decrease relative to values estimated for the lithosphere from basin margins, as a result of effects of plastic bending. As argued by Van Wees & Cloetingh (1994), it is more likely that the relatively high EET estimates (e.g. Kooi
et al. 1992; Karner et al. 1992) relate to deep crustal or subcrustal lithosphere flexure, (partly) decoupled from the upper crust, characterized by much lower EET values (Van Wees & Cloetingh 1994).
Compressional setting: the Central System and adjacent Tajo Basin (central Spain)
Tertiary uplift and exhumation of the Central System occurred simultaneously with subsidence and infill of the adjacent Tajo and Duero Basins in central Spain (Figs 12 & 13). During this process NE-SW trending Late Variscan crustal-scale faults, bounding the Central System, were reactivated in an overall convergent setting (Vegas & Banda 1982; Sopena et al. 1988; Vegas et al. 1990). Balanced sections show a throw of several kilometres for these faults, and indicate a NW-SE shortening of at least 11%, taking into account internal thrusting and strike slip deformation in the Central System (De Vicente et al. 1992). In agree-
ROLE OF PRE-EXISTING FAULTS 309
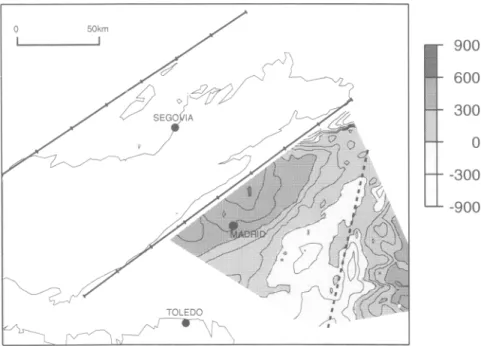
Fig. 12. Geological map of the Central System and the adjacent Duero and Tajo Basins in Central Spain. Basement consists of pre-mesozoic sediments and crystalline rocks (after De Vicente et al. 1992). The Tajo Basin is subdivided into the Madrid Basin and the Intermediate depression, separated by the Sierra de Altomira, a thin-skinned thrust belt where Mesozoic sediments are exposed. Cretaceous subcrop information (after Querol Muller 1989) reflects eastward deepening of the inverted Mesozoic Iberian Basin, presently exposed in the Iberian Range and Sierra de Altomira.
ment with shortening is the crustal thickening of 5 km inferred from seismic refraction below the Central System (Surifiach and Vegas 1988). Contemporary basin subsidence in the Duero Basin (e.g. Portero e t al. 1983) and in the Tajo Basin (e.g. Calvo e t al. 1990), provide an excellent setting for a study of 3D signature of basement deflections in response to fault-bounded uplift and crustal thickening in the Central System. Unfortunately, the geometry of the Duero Basin is not sufficiently constrained to compare 3D flexure modelling results with observations. We, therefore, focus the modelling on the Tajo Basin.
Seismic data of the Tajo Basin show a Mesozoic
and Cenozoic sequence up to about 3500 m thick- ness (Querol Muller 1989; Figs 13 & 14b). Based on its stratigraphic development, the Tajo Basin is subdivided into the western Madrid Basin and the eastern Intermediate Depression, which are separated by the N-S trending Sierra de Altomira. The Sierra de Altomira pops up as an isolated thin- skinned thrust belt of latest Oligocene-Early Miocene age. Its formation is related to the final stages of inversion of the Mesozoic Iberian Basin, in which the sedimentary cover thickens gradually eastward from the Altomira Range (Fig. 13b) (Salas & Casas 1993; Van Wees & Stephenson 1995). The location of the Sierra de Altomira
310 J.D. VAN WEES ET AL.
(a) N
Southern border fault
A A' _B
.
B'n C
ot ~ Cen~, S~e=
- - 9 . . . , , . - , , ~ - .
0
20 km
Basement
~
Tertiary
~ S c h i s t o s i t y
section
Cretaceous
Hercynic granites
(b)
W
E
3 t D
Sierra de Altomira
D, t
0
20 km
[ ~
L
~
1 T~'~-,l=Keuper,
s e c t i o n @
~
C ~
_ _ 2
2=Buntsandstein
& Muschelkalk
Fig. 13. Geological cross-sections 1 and 2 depicted in Fig. 12, illustrating the structural grain of the Central System and adjacent Tajo Basin. (a) Cross-section I through the Central System and adjacent basins, demonstrating border fault controlled uplift of the Central System in a compressive setting (after De Vicente et al. 1992). (b) Cross-section 2 across the Tajo Basin. The Sierra de Altomira forms a pop-up structure separating the western edge of the Iberian Basin to the east (Intermediate Depression) from the Madrid Basin in the west. As is evident from the section and Cretaceous subcrop information in Fig. 12, the location of the Sierra de Altomira is intimately linked to the westward termination of a sedimentary detachment (keuper evaporites).
coincides with the westward termination of east- ward dipping Keuper evaporites (Figs 12 & 13b) (Querol Muller 1989), which form the most eminent cover detachment involved in inversion of the Iberian Basin (Viallard 1989). Evidently, the basement warping east of the Sierra de Altomira reflects mainly Mesozoic extension. On the other hand the Madrid Basin is hardly affected by Mesozoic extension, and Tertiary continental sedi- ments range in thickness from 1500 m close to the Toledo Mountains and the Sierra de Altomira, up to about 3500 m close to the Central System (Fig. 14b) (Megias et al. 1983; Calvo et al. 1990).
In the Madrid Basin, Tertiary strata are not affected by large-scale folding and faulting (Racero Baena 1988). However, stratigraphic analysis shows a subdivision into a number of sequences, separated by (angular) unconformities. These show significant lateral facies contrasts as a result of
relative uplift of the Central System, the Sierra de Altomira, and the Toledo Mountains (Megias et al. 1983; Cairo e t a l . 1989; 1990). The timing of uplift of the Toledo Mountains is not well constrained but probably of Paleogene age (Racero Baena 1988; Calvo et al. 1990). Micromammiferous and palyno- logical data from borehole and outcrop data indicate that uplift of the Sierra de Altomira and Central System, marked by proximal alluvial sedimentation at the margins of the Madrid Basin, started in the Late Oligocene (Racero Baena 1988; Calvo et al. 1990). In the Sierra de Altomira, the uplift ceased in the Early Miocene, whereas the Central System shows continuous uplift and sediment supply into the Middle Miocene (Calvo et al. 1990).
The basement depth distribution in the Madrid Basin, showing a Tertiary downwarping in the vicinity of the Central System (Fig. 14b), indicates
ROLE OF PRE-EXISTING FAULTS 311
Fig. 14. Basement (pre-Mesozoic) elevation maps of the Central System and adjacent Tajo Basin. (a) Topographic elevations, contoured in 200 m interval. Inside areas of exposed basement (denoted by lines) basement minimum values of uplift correspond to present-day topography up to 2400 m. (b) Elevation of migrated top-basement reflector in the Tajo Basin, contoured in 200 m interval (after Querol Muller 1989). The dashed line marks the transition from thick Mesozoic cover (east, Sierra de Altomira and Intermediate Depression) to thin Mesozoic cover (west, Madrid Basin). In (a) and (b), the two straight lines bordering the Central System represent border faults adopted in the flexure model.
312 J. D. VAN WEES ET AL. that basement subsidence is related to uplift of
the Central System.
Tectonic s u b s i d e n c e
T h e basement subsidence values in the Madrid Basin constitute two components, one related to isostatic compensation of topographic loads and associated sediment infill and a tectonic compo- nent, which may reflect flexural compensation.
The contribution of topographic loading and sediment infill, can be eliminated by calculating tectonic subsidence, using the backstripping tech- nique (cf. Steckler & Watts 1978). Therefore, we calculated the tectonic component of vertical move- ments of the basement for the cumulative sediment thickness data constrained by the topography and basement depth data available in the Tajo Basin (Fig. 14). It is noted that effects of topography can be incorporated in tectonic subsidence calculations by interpreting topographic elevations as a relative rise in sea-level. For the sediment infill, we incorporated an exponential porosity-depth equation, adopting parameters for a sand lithology according to Sclater & Christie (1980).
The resulting air loaded tectonic subsidence, as depicted in Fig. 15, shows large values up to 600 m at the depocentre of the Madrid Basin, and in the eastern part of the Intermediate Depression. On the other hand, the Sierra de Altomira and north- western part of the Madrid Basin indicate tectonic
uplift of 200 m or more, whereas large parts of the Madrid Basin are characterized by moderate uplift. The subsidence values in the Intermediate Depression are in agreement with Mesozoic extension. For other parts of the Tajo Basin, the subsidence and uplift values, are either a result of Tertiary crustal deformation, or a result of uncertainties in the adopted lithology, or they can be attributed to flexural loading.
To test the sensitivity of the tectonic subsidence values for variations in constant lithological parameters, we adopted a constant density sediment infill Ps = 2300 kg m -3. The resulting maximum tectonic subsidence show values approximately 200 m lower than in Fig. 15. However, they do not indicate large deviations in the subsidence patterns. On the other hand, taking into account observed lateral facies contrasts, incorporating a relatively large abundance of low density evaporitic sedi- ments in the centre of the Madrid Basin, results in a slight increase of subsidence values in the basin centre.
Alternatively variations in tectonic uplift and subsidence values in the Madrid Basin could be attributed to the isostatic consequences of Tertiary crustal thickening and thinning. Extensional crustal thinning explaining Tertiary tectonic subsidence, seems not likely, since extensional structures are lacking. The role of crustal thickening, explaining the tectonic uplift, is limited to the northwestern margin of the Madrid Basin and the Sierra de
ROLE OF PRE-EXISTING FAULTS 313 Altomira region. In the Sierra de Altomira, thin-
skinned shortening observed at the surface (Fig. 8), supports crustal thickening, whereas for the north- western margin, thickening can be attributed to a southward migration of the faults bordering the uplifted Central System (Querol Muller 1989). These results indicate that large tectonic subsidence values in the depocentre of the Madrid Basin cannot be related to crustal deformation. In the present study, it is assumed that they reflect a flexural loading effect.
F l e x u r a l m o d e l l i n g
For a three-dimensional flexure model of the Central System and adjacent basins, we adopt the same crustal and subcrustal parameters and boundary conditions as used in the Lake Tanganyika model. To incorporate border faults bounding the Central System, we assume planar faulting, adopting two linear discontinuities depicted in Fig. 14. In order to ensure that the faults coincide with grid nodes and grid connections, we use a non-equally spaced grid, mixed with rectangular and triangular nodal connections. In the vicinity of the faults, the grid spacing corresponds to approximately 3 km.
To incorporate effects of crustal thickening related to the northern and southern border faults, we assume for the [~ distribution,a spherical cap radius r 1 of 85 km (see Appendix). An initial crustal thickness of 32 km is adopted (Banda et al. 1983; Surifiach & Vegas 1988). To obtain a maxi- mum crustal thickening in the centre of the Central System (Surifiach & Vegas 1988), the centre of the spherical cap is shifted perpendicular to the faults to positions which align along the central axis of the Central System. For the border faults, we adopt very low (thrust) fault angles of 30 ~ which represent a minimum value compared to estimates from balanced reconstructions (Fig. 13a) (Banks & Warburton 1991; De Vicente et al. 1992). Lacking well documented basement data for the Duero Basin, a constant vertical displacement of 2000 m is assumed for the northern fault. This is a relatively large value according to balanced reconstructions (Banks & Warburton 1991; De Vicente et al. 1992). For the southern fault adjacent to the Madrid Basin, minimum throw estimates are given by the topography and seismic data. Adopting these values for faulting, the crustal thickening shows a maximum of about 3 km, which rapidly decreases towards the boundaries of the Central System. In contrast to the spherical cap 13 distribution, crustal thickening values deduced from the refraction data (Surinach & Vegas 1988) show a more constant thickening below the Central System, most likely related to distributed reverse
faulting and thrusting within the Central System (Fig. 13a). We therefore include an additional crustal thickening 13 = 0.9 in a quadrilateral area, of which the northern and southern border faults form two opposing sides.
In the flexure calculations, it is assumed that depressions below topography (Fig. 16a) are infilled by a sand lithology with equal grain density and porosity-depth parameters as adopted in calculating tectonic subsidence (Sclater & Christie 1980). Elevated areas above topography are eroded, and we adopt average crustal density (Table A1) for eroded material.
Starting from minimum throw estimates, the throw values for the southern fault have been increased to fit basement depths in the Madrid Basin and exposure of basement rocks in the Central System. For the northern border fault, throw values have been varied to fit predicted base- ment elevations closely to near surface exposure observed in adjacent parts of the Central System (Figs 13b & 14). Results for an EET value of 7 kin, depicted in Fig. 16a, show the flexural response for a throw distribution, which closely agrees with the pattern of observed basement depths in the Madrid Basin, and which corresponds to basement uplift and erosion in the adjacent Central System. The 13 distribution corresponding to these throw values is depicted in Fig. 16a. The associated predictions for crustal thickening in the Central System range from about 4 to a maximum of about 8 kin, which is in reasonable agreement with the 5 km thickening deduced from refraction data (Surifiach & Vegas 1988).
In Fig. 17, we compare predicted basement deflections and observed basement depth and topography for two cross sections, illustrating the predicted deflections for various values of EET (5, 7, and 10 km), using the best fit throw values for EET = 7 km. The cross-sections indicate that the large-scale wavelength of convex down warping of the basement in the Madrid Basin corresponds to relatively low EET values of about 7 km. Some smaller wavelength concave deflections occur close to the southern border fault. These probably reflect plastic drag close to the fault and most likely small-scale normal faulting basinward. The latter feature can be attributed to extensional bending stresses induced by flexural downwarping.
The magnitude of relative uplift and erosion, pre- dicted in the flexure model, is largely controlled by the throw of the border faults. Relatively high amounts of uplift and erosion are predicted adjacent to the Tajo Basin whereas the amount of predicted basement erosion adjacent to the Duero basement is approximately zero. These predictions agree well with the geological data (see Figs 13 & 14),
314 J. D. VAN WEES E l AL.
Fig. 16. Three-dimensional flexure model of the Central System and adjacent Duero and Tajo basins, for an EET of
7 km and a throw distribution for the border faults, which agrees closely with observed basement depths in the Madrid Basin. (a) [3 distribution corresponding to fault heaves, assuming a (thrust) fault dip O = 30 ~ and radius r I = 85 km for the spherical cap function (see Appendix), which is centred along the central axis of the Central System. Fault-related [3 values have been augmented by [3 = 0.9 for a quadrilateral area bounded by the border faults. Contour interval is 0.01. (b) Deflection distribution, contour interval is 250 m. At position of faults mean deflection is adopted for deflection value.
ROLE OF PRE-EXISTING FAULTS 315
E
. - ~ 0 4 I - : : 3 0 X r ~ - e q I . . . . ' " ' 1 ' " . . . [ . . . . ' " " [ . . . " 1 " ' " ' " ~ ' [ . . . " [ ~ n ' " " I ' " . . . . " i . . . I ' ' ~ ' ' ~ ' ' ' - t o p o g r a p h y _ . . . b a s e m e n t 9 [ - E E T 5 k m - - - - : ~ - - - - EET 7km _ ' _ _ _ E E T l O k m _ . ~ , . ~ J r J l J J l J ] J J i J l i J J L J l | l l L a i j i J J J J n u J n j ~ J j j j j j J n J n J n n u l ] J i l i l l l l i tni[tntllJiLilltlttIiini it I l l l l [20
40
60
80 100 120 140 160 180
AE
II
" . . . 1 ' " ' " ' " 1 . . . I ... ' " ' 1 . . . 'i ... ' .... 1 .. . . l " ... '11' . . . ~'1 ~ .. . . im ~ ~ ~ . . . .I
X ,0-. ~ 1 .20
40
60
80 100 120 140 160 180
distance
(km)
Fig. 17. Predicted and observed basement deflection for two cross-sections (I, II), indicated by solid lines on Fig. 16. Sections are for three values of EET (5, 7 and 10 km) and a fixed throw distribution, corresponding to values adopted in Fig. 16. Note that predicted uplift and associated erosion of basement above topography is in agreement with observed exposure of basement rocks.
indicating deep truncation of basement rocks close to the Tajo Basin and nearly no erosion adjacent to the Duero Basin. The latter is also evident from the partial exposure of Mesozoic cover. Furthermore, the asymmetric distibution of erosion, predicted by the flexure model, agree well with observations of asymmetric topography relative to the border faults. The drainage divide line parallel to the border faults, is located closer to the Tajo Basin than to the Duero Basin. Such a conspicious relationship between asymmetry in topography and erosion agrees very well with findings from tectonic modelling and fission track analysis of large-scale escarpment evolution at rifted margins (Van der Beek et al. 1995).
The flexure model results for the Central system and Tajo Basin show that observed basement warpings can be well explained adopting border fault activity interacting with an upper crust marked
by a low EET of about 7 kin. As for the Lake Tanganyika case study, these results indicate (partial) decoupling of upper crustal deformation and subcrustal deformation. Both case studies clearly demonstrate that border faults have a large influence on basin shape. The 3D flexure model we used provides an effective quantitative approach in demonstrating this control by fitting observed base- ment geometries. It also provides a useful tool for prediction of basement warping where data are not available or unreliable. This maybe particularly relevant in the appraisal of three-dimensional exploration studies (Gabrielson & Strandenes 1994).
C o n c l u s i o n s
The 2D and 3D modelling results clearly show that observed basin geometries at various scales can be
3 1 6 J . D . VAN W E E S ET AL. succesfully explained by adopting a pronounced
weakness for upper crustal faults. 2D finite element models, incorporating movements on weak upper crustal faults, show that predicted local stress and strain distributions and subsequent faulting in overlying rocks, agree with a large number of observations and other analogue and numerical modelling results. On a basin-wide scale, the 3D flexure model, incorporating weak planar border faults, successfully explains regional basement geometries for the Lake Tanganyika Rift Zone (extension) and the Central System of Spain uplift (compression). These model results suggest that upper crustal flexure is marked by low values of effective elastic thickness (EET), ranging from 3-7 kin, and agrees with values from other 2D upper crustal flexure studies (e.g. Marsden et al.
1990; Kusznir et al. 1991).
The low EET values most likely reflect a (partial) decoupling of upper crustal and subcrustal deformation, facilitated by the weak lower crust, and in agreement with standard rheological assumptions for Phanerozoic lithosphere. In contrast, the inferred weakness of upper crustal faults is not evident from rock mechanics data. However, observations of reactivations of faults which are not preferably aligned with the stress field, and reactivations of basin deformation on long time-scales are in support of this feature.
Appendix
The three-dimensional flexure model for border faulting and basement warping (for detailed description, see Van Wees & Cloetingh 1994), uses a finite difference technique solving the bi-
harmonic equation for the upper crustal deflection
W:
3 4 W 3 4 W 3 4 W
O ~x 4 + O ~ + 2 0 ~ x 2oy 2 - q (A1)
where D is flexural rigidity and q represents buoyancy load (pertinent constants and parameters are listed in Table AI). In the finite difference scheme, upper crustal planar faults are represented by linear discontinuities, dissecting the elastic plate, being marked by an additional nodal degree of freedom for vertical offset (throw) and a constant tilt condition across the fault in accordance to planar faulting concepts (Van Wees & Cloetingh 1994). The load q, is obtained by vertical integration of the density contrasts ApE of the deformed lithosphere and overlying water and sediments relative to the undeformed lithosphere column (e.g. Kooi1991):
q = - APL gdz (A2)
Ztopo
where g is the acceleration of gravity, Zto.p o is topo- graphic elevation, z a is the compensation depth. The latter often corresponds to the base of the undeformed lithosphere.
Following two-dimensional concepts (Kusznir
et al. 1991), it is assumed that lower crustal flow locally compensates the faulting movements. Extending 2D concepts to 3D, it is assumed that for a single fault node the summation of different types of deformation in the brittle and ductile levels of the lithosphere, lead to a smooth spherical cap ]3 distribution of Moho deformation relative to the
Table A1. Constants and parameters for 3D flexure model
Constant Name E v g Pc Pm P~ameter Young's modulus Poisson's ratio Gravity Crustal density Mantle and Asthenosphere density Name Units 7 x 10 t~ Nm 2 0.25 9.8 m s - 2 2800 kg m -3 3300 kg m -3 Units effective elastive thickness (EET)
flexural rigidity, equal to [Eh3/12(1 - v2)] deflection
load
lithospheric stretching factor radius of spherical cap function
m
Nm
in
Nm-2
ROLE OF PRE-EXISTING FAULTS 317
Fig.
A1. Incorporation of faulting and buoyancy forces in two steps in the 3D flexure model. (a) First step, faulting and flexure compensated by lower crustal flow. (b) Next, flexural rebound in response to infill of sediments and crustal deformation.zero surface level (see Fig. Ala):
I f.
L A f = - (~(r) - l) d r 0
(A3)
where L is fault extension, Afis fault-node spacing, r is distance from the fault node and r 1 is radius of the domain of the ~ distribution, corresponding to a spherical cap function. Contributions of the individual fault nodes are multiplied together to obtain the ~ distribution for the fault.
To avoid compensation of crustal thinning or thickening and erosion or sediment infill by lower crustal flow out or into the model, fault deformation
is accomplished in two steps. First (Fig. A l a ) fault- induced deflections are calculated in absence of erosion or sediment infill and lithospheric thickening or thinning, adopting lower crustal flow. In the next step incremental deflections are calculated in accordance to lithospheric thinning and sediment infill and erosion, adopting astheno- spheric flow (Fig. Alb). Since we focus on upper crustal structures, which are generally smaller in wavelength than those involved in lithospheric thermal perturbations, thermal effects of litho- spheric deformation are neglected in calculating lithospheric buoyancy forces.
References
BANDA, E., UDIAS, A., MUELLER, ST., MEZCUA, J., BOLOIX, M., GALLART, J. & APARICIO, A. 1983. Crustal structure beneath Spain from deep seismic sounding experiments. Physics o f the Earth and Planetary Interiors, 31,277-280.
BANKS, C. J. & WARBURTON, J. 1991. Mid-crustal detach- ment in the Betic system of southeast Spain, Tectonophysics, 191, 275-289.
BARR, D. 1987. Lithospheric stretching, detached normal faulting and footwall uplift. In: COWARD, M. P., DEWEY, J. E & HANCOCK, P. L. (eds) Continental extensional tectonics. Geological Society, London, Special Publications, 28, 75-94.
BASSI, G., KEEN, C. E. & POTTER, P. 1993. Contrasting styles of rifting: Models and examples from the eastern Canadian margin. Tectonics, 12, 639-655.