A review of the impact of cash transfer programmes on
child nutritional status and some implications for Save
the Children UK programmes
Devi Sridhar
1and Arabella Duffield
2October 2006
1
Institute of Social and Cultural Anthropology, Oxford 2
Abbreviations
ADB African Development Bank BA Bolsa Alimentação (Brazil)
BDH Bono de Desarrollo Humano (Ecuador) BF Bolsa Família (Brazil)
CCT Conditional cash transfer
CSG Child Support Grant (South Africa)
CTR Cost-transfer ratio (readjusted for setting-up costs) CWAC Community Welfare Assistance Committee (Zambia) DFID Department for International Development (UK) GDP Gross domestic product
GMP Growth monitoring and promotion GTZ German Technical Assistance HDI Human Development Index (UNDP) IADB Inter-American Development Bank
IDB International Development Bank (World Bank Group) IDS Institute of Development Studies, University of Sussex IFPRI International Food Policy Research Institute
MCDSS Ministry of Community Development and Services (Zambia) PFA Programa Familias en Acción (Colombia)
PRAF Programa de Asignación – Family Allowance Programme (Honduras) PROGRESA Programa de Educación, Salud y Alimentación (Mexico)
PWAS Public Welfare Assistance Scheme (Zambia) RPS Red de Protección Social (Nicaragua)
SelBen Beneficiary Identification and Selection System for social programmes (Ecuador)
SISBEN Beneficiary Selection System for Social Programmes (Colombia) UNDP United Nations Development Programme
Glossary
Beneficiary: Direct recipient of support from a programme Consumption level: Refers to food consumption
Cash transfer: Disbursement of cash directly to individuals, which can be made with or without conditions attached for receiving it
Cost-transfer ratio: Cost of making a one-unit transfer to a beneficiary
Demand-side intervention: An initiative that increases the capability of beneficiaries to obtain services, such as cash transfers
Geographical targeting: Selection of beneficiaries on the basis of their residence in poorer regions or locations
In-kind transfer: A non-cash transfer
Safety net: Social insurance and social assistance
Social cash transfer programme: A programme in which money is distributed to individual and household beneficiaries
Social protection programme: Any public or private initiative that provides income or consumption transfers to the poor, protects the vulnerable against livelihood risks, and enhances the social status and rights of the marginalised, with the overall objective of reducing the economic and social vulnerability of poor, vulnerable and marginalised groups
Supply-side intervention: An initiative that includes the provision of services to beneficiaries, for example immunisation services
Introduction
The Save the Children UK Hunger Reduction Team initially decided to prepare this paper to help us to understand better some of the Latin American conditional cash transfer programmes. Staff in the field and at headquarters were interested in understanding how the programmes worked and their impacts on nutritional outcomes. As the paper evolved, however, we decided to try and make this review more thorough and have therefore reviewed all cash transfer programmes that measured nutritional status as an outcome in a database developed by IDS in 2006.3 This means that we have also examined two sub-Saharan African unconditional cash transfer programmes. This paper summarises the design of eight cash transfer schemes and discusses the
effectiveness of each. Although schemes have often had multiple positive effects (eg, on asset accumulation, education and health), we have chosen to focus exclusively on nutritional effectiveness in order to keep the paper as short as possible. The schemes are framed as case studies that present the current knowledge on each of these programmes; a summary of the case studies is provided in Annex 1. At the end of the paper, we provide a short discussion on both the positive and negative aspects of the programmes to infer what might explain the impact on child nutritional status. Some considerations for Save the Children UK field teams are also presented. Note that because the programmes all have slightly different objectives regarding nutritional outcome (eg, some specifically mention improved nutritional status, others aim for improved food consumption or human capital, etc) and other outcomes (education, health, etc), they are not strictly 100 per cent comparable. However, we have decided here that the programmes are sufficiently similar to warrant being assessed in one paper for Save the Children UK’s needs.
Case Study One: Programa de Educación, Salud y Alimentación (PROGRESA)4
Mexico’s population is 104.3 million and the country has a GDP of US$626.1 billion; GDP per capita is US$9,168. The adult illiteracy rate is 9.7 per cent and the health expenditure per capita is US$550. Its HDI rank is 53 out of 177 countries.5 It is estimated that 18 per cent of children in Mexico are stunted (UNICEF, 2005).
In 1995, two Mexican social scientists, Santiago Levy and Jose Gomez de Leon,6 created a new safety net programme to alleviate poverty. They launched a pilot project funded by the federal government in three cities in the southern state of Campeche, using the database of beneficiaries of two existing subsidised milk and tortilla programmes. The pilot project had two innovative features: first, it consisted of direct monetary transfers (US$7 per month) through electronic cards; and second, it required beneficiaries in vulnerable groups to obtain regular medical check-ups. The pilot was a success. In October 1996, a national census was taken to prepare for the launch of PROGRESA, modelled on the pilot project. In August 1997, Phase I was launched and reached 140,000 households in 3,369 localities. Rapid expansion, primarily based on the budget allocation for the year, followed. By 2000, PROGRESA had an annual budget of US$1bn and was reaching 2.6 million rural households in all 31 states of Mexico – over 40 per cent of the total rural
3
Barrientos, A and Holmes, R (2006) Social Assistance in Developing Countries Database, Version 2, Institute of Development Studies, University of Sussex
4
This section relies on information from Bate (2005), Behrman and Hoddinott (2001), Caldes et al (2005), Gertler (2000), Gertler and Boyce (2001), Hoddinott et al (2000), Rawlings and Rubio (2003), Skoufias (2005), and World Bank (2003a)
5
UNDP HDI 6
Levy, an economist, currently serves as Director General of the Mexican Institute of Social Insurance. He was undersecretary in Mexico’s Finance Ministry in 1995, when President Zedillo put him in charge of a team to draft a plan to address poverty; PROGRESA was the resulting programme. Gomez de Leon is a demographer who headed Mexico’s National Commission on Population and was PROGRESA’s first national co-ordinator.
population. In March 2002, its name was changed to Oportunidades and the programme was expanded to urban areas, with a total annual budget of US$1.8bn.
PROGRESA’s objectives were to improve the health and nutritional status of all members of poor households, especially mothers and children, as well as to ameliorate school enrolment,
attendance and educational performance. PROGRESA supported families living in extreme poverty through both supply- and demand-side interventions in education, health and nutrition. Although the education and health ministries were responsible for the supply side, resources were set aside to cover the costs of additional health services demanded as a result of the programme and to ensure an adequate supply of equipment, medicines and materials. Cash transfers were disbursed conditional on the household engaging in a set of behaviours designed to improve health and nutrition. The size of the cash transfer was large, at US$13 per household per month in 1999, which represented, on average, one-third of the household income of the beneficiary family. The composition of the household did not affect the size of the transfer. The transfer was received every two months through an electronic card given to the mother. Transfers were made through PROGRESA offices that were outside the normal government bureaucracy; disbursements were made by banks and telegraph companies so that PROGRESA agents did not handle the money. Each year, Congress established the programme’s budget and its operating rules, including the number of families that could be enrolled, the amount of aid that would be offered and the requirements for beneficiaries.
Transfers were conditional on the families fulfilling certain requirements. The first was that every family member must receive preventive health services. Pregnant women were required to have five prenatal check-ups. Lactating women were required to have two health checks per year, when their nutritional status was also monitored. Carers of children aged less than 60 months were obliged to take the child to the clinic every two months for GMP, immunisations and health education. Each month, children aged 4–24 months and pregnant and lactating women were given 30 nutritional supplements containing 100 per cent of recommended daily micronutrient requirements and 20 per cent of recommended protein. Children aged 25–60 months found to be malnourished during GMP also received the supplements. Other household members, including school-aged children, adolescents and adults, were required to visit clinics once a year for health check-ups, when special attention was paid to family planning, detection and treatment of
parasites, and education about health habits and first aid treatment. All adult household members had to participate in regular meetings at which health, hygiene, nutrition issues and best practices were discussed with nurses and physicians. Medical providers were required to certify that household members had completed these requirements.
The second condition concerned education. Families received an educational grant which was conditional on school enrolment and regular school attendance (85 per cent of school days per month and per year). In the first five years, about 1 per cent of households were denied cash transfers for non-compliance.
Targeting was first done geographically and then at household level. Poor communities were determined by using an index of marginality based on the proportion of households living in poverty, the population density, and infrastructure such as access to health and education facilities. A proxy means test was then conducted to identify poor households. This constructed an index of easily observable characteristics that serve as a proxy for poverty, for example housing materials, water and sanitation facilities, education and family structure. PROGRESA conducted a census of households in each poor (PROGRESA-eligible) community to collect these proxy characteristics. The weights used to aggregate the characteristics into an index were constructed based on the analysis of an in-depth survey of a sample of households from the eligible communities. This sample survey collected consumption and income information in addition to the proxy characteristics. The data were used to estimate a regression of per capita consumption against the proxy characteristics. The regression coefficients were used as weights to construct the index for each household.
Households did not have to apply but were informed if they were eligible, using door-to-door methods. PROGRESA achieved take-up rates of 97 per cent, and roughly 78 per cent of households in chosen communities were classified as eligible for programme benefits. Eligible households were offered enrolment for a three-year period conditional on meeting the
requirements described above. Once the enrolment period closed, new households were not able to enrol in the programme until the next certification three years later (this was to prevent in-migration into PROGRESA areas).
Monitoring and evaluation were conducted through the Scheme of Guardian (Centinela)
Monitoring Points. Baseline data were collected by Mexico’s Instituto Nacional de Salud Pública during August and September 1998 and from October to December 1999. The survey was a longitudinal rotating random sample of eligible households with children under five years of age. The evaluation of nutritional impact was conducted in a random selection of 202 from the 302 communities scheduled to enrol in the programme at the end of 1998, and 142 randomly selected from the 185 communities enrolled a year later.
The PROGRESA evaluation showed a significant increase in nutrition monitoring and
immunisation rates. Infants under three years old participating in the programme increased their GMP visits by 30 to 60 per cent, and beneficiaries aged birth to 5 had a 12 per cent lower incidence of illness compared to non-PROGRESA children. The data also suggest that PROGRESA had a significant impact on increasing child growth – children aged 6–36 months grew, on average, 1 cm more than the control group children (Table 1). These effects were larger in poorer households with more educated fathers. The population prevalence of stunting was reduced by nearly 10 per cent.
Table 1: The impact of PROGRESA on the height of children aged 6–36 months
Pre-programme nutritional status Treatment group Difference Significance Height-for-age (z-score) -1.72 -1.38 -0.34 p<0.05 Prevalence of stunting (<-2 z-scores height-for-age) 45.1% 35.2% -9.9% p<0.05
Food consumption levels7 also increased. Households receiving PROGRESA benefits in
treatment localities obtained approximately 7 per cent more calories than comparable households in control localities. The increase in household consumption was driven by higher expenditure on fruits, vegetables and animal products.
PROGRESA had a cost-transfer-ratio (CTR) of 0.106 – ie, 10.6 pesos were spent on administrative costs for every 100 pesos transferred to households from the start of the
programme to 2000. However, the adjusted CTR (removing evaluation and other fixed costs) was 0.041, ie only 4.1 pesos spent on administrative costs. A large proportion of the fixed costs were devoted to targeting and conditioning (up to 60 per cent); however, this was felt to be worthwhile given that the targeting was very accurate. In 2005, the total cost of Oportunidades was
estimated at 0.66 per cent of GDP.
7
Measured by assessing caloric availability at household level expressed in calories per person per day, asking households about expenditure and aggregating these (Hoddinott et al 2000).
Case Study Two: Programa de Asignación Familiar (PRAF) in Honduras8
Honduras’ population is 6.9 million and the country has a GDP of US$7 billion; GDP per capita is US$2,665. The adult illiteracy rate is 20 per cent and the health expenditure per capita is
US$156. Its HDI rank is 116 out of 177 countries.9 It is estimated that 29 per cent of children in Honduras are stunted (UNICEF, 2005).
In 1990, PRAF was launched in Honduras to mitigate the social effects of structural adjustment. PRAF-I distributed monetary vouchers to vulnerable groups. In 1999, PRAF-II started. The objective of the programme was to strengthen the human capital of the poorest communities by offering health and education services, training mothers in better nutritional and hygienic practices, and ensuring a cash transfer to improve nutritional intake. In addition, PRAF had an educational objective of increasing the performance in mathematics and language of children enrolled in primary school grades 1–4. PRAF-II was financed by a US$45.2 million loan from the IDB and US$5.1m from the government of Honduras. The programme was implemented and evaluated in 70 municipalities in Honduras with a total population of 660,000.
The demand-side interventions included transfers three times a year to families with pregnant women and/or children under three years of age. The transfer value was $46 per year, or US$4 per beneficiary per month. This represented on average 4 per cent of the pre-programme total household annual expenditure (and one-fifth of the PROGRESA transfer). Families were limited to two subsidies per household (ie, for only two children). Transfers were conditional on five antenatal care visits during pregnancy, perinatal check-ups within ten days of delivery, and monthly GMP and health checks for young children. In addition, an educational subsidy of US$54 per year was given to families with children between the ages of 6 and 12. This was conditional upon children not missing more than 20 days of school per year and not repeating a grade more than once. Households could receive a maximum of three educational subsidies.
The supply-side interventions for health included a cash injection for health centres (around US$6,000 per year), implementation of GMP, and maintaining a process of total quality
management at each health centre. Unlike PROGRESA, PRAF invested directly in supply-side services and did not offer food supplements.
Targeting was done geographically by ranking municipalities by average rates of stunting
observed in the 1997 National Census of the Height of First-Graders. Seventy municipalities were considered and these were randomly assigned to one of four groups, in the ratio 2:1:2:2.
Randomisation was at the municipality level. The four groups were: household-level package only (demand-side), service-level package only (supply-side), both packages, and standard services (control).
Monitoring and evaluation were performed through the regional community offices linked to the programme, who identified the accreditation of beneficiaries through forms processed through an electronic optical reader. The indicators collected included school attendance and enrolment, health centre attendance, and institutional birth delivery. Because of the way PRAF was implemented, the impact of combined household cash transfers and supply-side measures can be compared to the impact of supply-side interventions alone. Table 2 below shows that the PRAF interventions had no significant impact on height-for-age of children.
8
This section relies on Caldes et al (2005), Flores et al (2003), IFPRI (2005), Morris et al (2004), Rawlings and Rubio (2003) and World Bank (2003b and 2003c). The authors contacted Rafael Flores to obtain data on impact on consumption.
9
Table 2: The impact of PRAF on height-for-age z-scores by treatment group among children aged 0–5 years Year Children receiving only demand-side interventions Children receiving both supply- and demand-side interventions Children receiving only supply-side interventions Children living in control areas 2000 -2.05 -2.11 -1.88 -2.16 2002 -2.05 -2.07 -1.89 -2.14 Change 0 0.04 -0.01 0.02 Double Difference (taking into account change in control) -0.02 0.02 -0.03
Thus, there is no evidence of nutritional impact after two years of PRAF implementation, and the levels of stunting remained high at 52 per cent. In addition, Flores et al (2003) note that the project was not able to work as a social safety net when the coffee crisis hit Honduras, and the situational status of children deteriorated.10
It should be noted that coverage on the supply-side of PRAF was low, with only 18 per cent of intended beneficiaries receiving services; this was mainly due to budget constraints that resulted in minimal implementation of supply-side services. Cash coverage was reported to be much higher at 78–79 per cent, while leakage was 4–5 per cent (Flores et al, 2003).
In the first four years of PRAF, the activities associated with the external evaluation and identification of beneficiaries were the most important cost items. The adjusted CTR (removing fixed and evaluation costs) is 0.068, and 49 per cent of the project budget was spent on targeting and supply-side services.
Case Study Three: Red de Protección Social (RPS) in Nicaragua11
Nicaragua’s population is 5.3 million and the country has a GDP of US$4.1 billion; GDP per capita is US$3,262. The adult illiteracy rate is 23.3 per cent and the health expenditure per capita is US$206. Its HDI rank is 112 out of 177 countries.12 It is estimated that 20 per cent of children in Nicaragua are stunted (UNICEF, 2005).
Due to the success of PROGRESA, RPS was launched in Nicaragua in 2000. The pilot phase lasted three years and had a budget of US$11 million, representing 0.2 per cent of GDP. The programme was supported by an Inter-American Development Bank (IADB) loan. In late 2002, due to the promising results, the government of Nicaragua and IADB agreed to an expansion of the programme for three more years, with a budget of US$22m. In 2005, it was reaching 22,492 households and 131,054 individuals (2.5 per cent of the total). The programme was running in 6 per cent of rural areas, 18 per cent of departments and 5 per cent of municipalities.
RPS was closely modelled on PROGRESA. Its specific objectives were to supplement household income for up to three years to increase expenditure on food, to reduce drop-out rates during the first four years of primary school, and to improve the healthcare and nutritional status of children
10
See http://www.msnbc.com/modules/ps/020716coffee/launch.asp?b=hi for more information on the coffee crisis.
11
This section relies on information from the World Bank (2003d) conference, Maluccio and Flores (2003, 2004, 2005) and IFPRI (forthcoming)
12
under the age of five. The key difference from PROGRESA was that RPS contracted, trained and paid private healthcare providers to deliver the services required by the programme; PROGRESA left the supply-side to the education and health ministries.
RPS had two core components: food security, health and nutrition; and education. Each eligible household received a cash transfer, bono alimentario, every other month contingent on
attendance at bi-monthly educational workshops, and on bringing children to scheduled
preventive healthcare appointments. The workshops were held in the communities and typically included 20 participants. RPS adapted the individual counselling material from the Integrated Attention to Child programme13 from Honduras. The preventive healthcare appointments were provided free of charge to beneficiary households and included GMP, vaccination, worm treatment, and vitamin and mineral supplements. Children younger than two years were seen monthly and those aged 2–5 every other month. Each eligible household also received a bono escolar transfer every other month contingent on enrolment and regular school attendance, as well as a mochila escolar school supplies transfer. Teachers also received a bono a la oferta
transfer. The food security transfer was US$224 per year and the school attendance transfer was US$112 (the food security transfer represented about 18 per cent of total annual expenditure in beneficiary households before the programme).
Initially, targeting only took place at geographical level. For the pilot phase, the Nicaraguan government selected the departments of Madriz and Matagalpa from the northern part of the Central Region, due to both their high poverty level and their capacity to implement the programme. In the next stage of geographical targeting, all six municipalities that were already running the Microplanifacación Participativa programme were chosen. Finally, a marginality index was constructed based on information from the 1995 National Population and Housing Census, and an index score was calculated for all 59 rural census comarcas (administrative areas within a municipality, typically including between one and five communities averaging 100 households each) in the selected municipalities. The index was created based on average family size, the percentage of households without piped water in the home, the proportion without a latrine, and the level of illiteracy.
Once an area was chosen, all resident households were eligible for benefits. For health and nutrition, children between the ages of birth and nine years, adolescents aged 10–19 and women aged 20–49 (potential mothers) were all included. However, although the areas chosen were quite poor, approximately 6 per cent of households were excluded from RPS as they possessed substantial resources. The apparent randomness by which this occurred seemed to cause confusion at local level and raised community tensions.
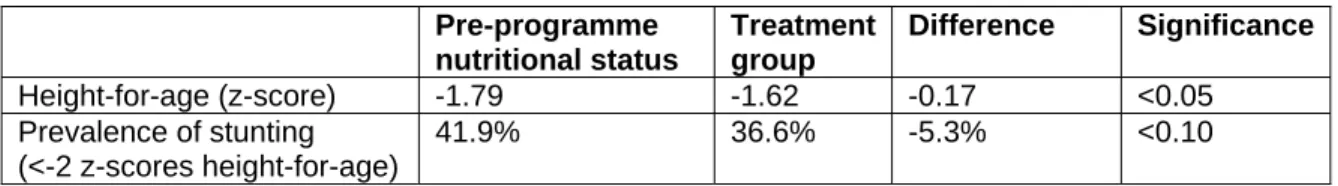
The monitoring and evaluation system was designed so that information would be collected on forms completed during the visit. As a baseline study was conducted, an evaluation could therefore be conducted comparing indicators before and after intervention in both treatment and control communities. Maluccio and Flores (2004) evaluated the impact of RPS in its pilot phase. They concluded that RPS had positive and significant effects on a broad range of indicators and outcomes (compared to a suitably matched control group). RPS supplemented per capita annual total expenditures by, on average, 18 per cent. Most of the increase in expenditure was spent on food; the programme resulted in an average increase of US$41 per capita in annual food
expenditure and an improvement in the diet of beneficiary households. There was a decline in the percentage of stunting from 42 to 37 per cent (p<0.10) among children aged 6–59 months (Table 3).
13
Table 3: The impact of RPS on the height of children aged 6–59 months Pre-programme nutritional status Treatment group Difference Significance Height-for-age (z-score) -1.79 -1.62 -0.17 <0.05 Prevalence of stunting (<-2 z-scores height-for-age) 41.9% 36.6% -5.3% <0.10
The largest share of costs in the first two years of RPS was on external evaluation and the implementation of the supply side of the programme (private healthcare providers). On average, 31 per cent of the budget was devoted to targeting and supply-side interventions. The adjusted CTR was 0.212, ie, 79 cents for the recipient.
Case Study Four: Programa Familias en Acción in Colombia14 (PFA)
Colombia’s population is 44.2 million and the country has a GDP of US$78.7 billion; GDP per capita is US$6,702. The adult illiteracy rate is 5.8 per cent and the health expenditure per capita is US$536. Its HDI rank is 69 out of 177 countries.15 It is estimated that 14 per cent of children in Colombia are stunted (UNICEF, 2005).
In November 2000, the national government of Colombia decided to launch a conditional cash transfer programme based on PROGRESA. Programa Familias en Accion, as it was named, would provide a nutrition subsidy to families with children under seven years of age, and an educational subsidy to children 7–17 years old who came from very poor families. As of 2005, it reached 340,000 households, roughly 3.1 per cent of the population, and 806,000 individuals, 1.8 per cent of the total population. The programme covered 58 per cent of municipalities and 84 per cent of departments. In its first three years, it cost US$336 million, of which US$150m was loaned by the World Bank and US$80m by the Inter-American Development Bank; the remaining
US$106m came from the national government.
The specific programme objectives were: to reduce school drop-out rates and low attendance of children in primary and secondary school, to augment the income of families in extreme poverty with children under the age of seven and increase expenditure on food, to focus attention on the health of children under seven, and to promote healthier practices with respect to health, nutrition, care and the prevention of domestic violence.
Targeting was performed at both geographical and household level through the SISBEN, the Beneficiary Selection System for Social Programmes used in Colombia.16 Municipalities were selected that had a population below 100,000 and an up-to-date SISBEN database. The
municipality could not already be participating in other national programmes, and had to have an adequate provision of education and health services and a bank. Households were targeted if they had been ranked by SISBEN as Level 1 before the 31 December 1999 and had at least one family member under 18 years of age. Level 1 of SISBEN roughly correlates to the poorest 20 per cent of households. Within these households, all children from birth to six years of age were targeted for the nutrition transfer, and all children aged 7–18 years were targeted for the education grants. Ninety per cent of eligible households registered for the programme.
14
This section relies on information from Attanasio and Mesnard (2005), Attanasio et al (2005a), Attanasio
et al (2005b), Mesnard (2005), and World Bank (2003e) 15
UNDP HDI 16
The programme consisted of nutritional and educational cash transfers to the mother. The nutritional transfer was US$15 per month contingent on the family enrolling in growth and development check-ups for children (every two months), vaccinations and health education classes. Families received US$8 per primary school child each month and US$16 per secondary school child each month for education, provided the children attended at least 80 per cent of classes.
The monitoring and evaluation system included four components: internal monitoring (assessing the physical and financial progress of the programme); external sample monitoring through spot checks (provision of transfers in the field); social control (supervision of the beneficiary
community); and external impact evaluation.
A study by Attanzio et al (2005a) demonstrates that the PFA was effective at increasing total food consumption in both rural (19 per cent) and urban (9 per cent) areas. Specifically, the authors found that there were improvements in quality of diet, with a preference for protein foods (milk, meat and eggs) and cereals. The mean height-for-age z-score of children aged 0–24 months increased by approximately 0.2 z-scores (p<0.10).17 No effect on stunting was seen in older age groups, but this was thought to be due to the existence of a successful nursery programme in which the older children take part, which masked the effects of the PFA.
In 2005, the operating cost was US$5m representing 0.1 per cent of GDP.
Case Study Five: The Bolsa FamiliaProgram in Brazil (BF)18
Brazil’s population is 181.4 million and the country has a GDP of US$492.3 billion; GDP per capita is US$7,790. The adult illiteracy rate is 11.6 per cent and the health expenditure per capita is US$611. Its HDI rank is 63 out of 177 countries.19 It is estimated that 11 per cent of children in Brazil are stunted (UNICEF, 2005).
The Bolsa Família (BF) program is a Brazilian federal government conditional cash transfer programme with five objectives, among which are elimination of hunger and alleviation of poverty. The programme was created in October 2003, after unification of four different national cash transfer programmes (Bolsa Escola, Bolsa Alimentação,20 Cartão Alimentação and Vale Gás). The programme provides cash transfers to two different target groups based on household per capita income and household composition:
• Priority is given to households with a monthly per capita income of less than U$23 (this is about 14.5 per cent of the national population). These households receive a base transfer of US$23, regardless of family composition, plus a variable transfer of US$7 for each pregnant or lactating woman, or child aged 0–15 years old. Up to three of the extra $7 transfers may be received per household, thus making the maximum transfer US$44 per family per month.
17
Note the pre- and post-programme height-for-age z-scores are not reported in the evaluation and hence cannot be shown in this report.
18
Most of the information from this section has kindly been put together by Rômulo Paes-Sousa and Leonor Maria Pacheco Santos, from the Secretariat for Evaluation and Information Management, Ministry of Social Development and Hunger Combat. Relevant references (at time of press only available in Portuguese) include Brasil (2004, 2006), Monteiro et al (2005), Caixa Econômica Federal (2006), Câmara dos Deputados (2006)
19
UNDP HDI 20
Note that this programme was evaluated by Olinto et al (2003) and Flores et al (2003). No impact on children’s nutritional status was found, although household consumption did improve. The new BF programme made important changes to the enrolment criteria that may have partially accounted for the positive impact of the new programme.
• Second priority is given to households with a monthly per capita income of U$23–46 (this is a further 18.5 per cent of the national population). These families receive a variable transfer of US$7 for each beneficiary (up to three per family). The maximum transfer in this case is US$21 per family per month.
In both cases, beneficiaries must comply with certain conditionalities. Pregnant women are required to have prenatal care and young children must be taken for growth monitoring and promotion session and vaccinations. School-aged children are required to attend 85 per cent of classes.
Since 2005, the BF programme has operated in all 5,565 Brazilian municipalities. Enrolment of low-income households is enabled by a national register system (the Cadastro Unico). The register of households is updated by municipality staff who interview families to assess their eligibility. Coverage is calculated on the basis of estimating the number of poor families per municipality according to national socio-economic data (see Annex 2 for coverage maps). The effect of the BF programme was studied in a survey conducted during a 2005 Nutrition Day in the northeast region of the country.21 Data was collected on a representative sample of 16,239 children aged 0–59 months. The group that was part of the BF programme (35.3 per cent of sampled children) was compared to non-beneficiaries, after adjusting for socio-economic
variables. The prevalence of stunting (HFA<- 2 z-scores) was 29 per cent lower in the group that had received the BF (4.8 versus 6.8 per cent). When analysing the effect by age groups, there was a significant difference in stunting between the 6–11-month-old children of 62 per cent (2 per cent in the BF and 5.3 per cent in non BF group, p=0,036).
The BF is one of the largest programmes encompassed by the Hunger Zero strategy and in September 2006 it reached 11,117,659 families, with an average monthly cash transfer of US$28.5 per family. The annual investment is about US$3.9bn, financed by contributions from the Brazilian Federal Funds for the Alleviation of Poverty and other Brazilian Federal Funds (which add up to 91 per cent of programme costs) and a US$350 million loan from the World Bank in 2005.
Case Study Six: Bono Solidario (Bono de Desarrollo Humano) in Ecuador22
Ecuador’s population is 12.9 million and the country has a GDP of US$27.2 billion; GDP per capita is US$3,641. The adult illiteracy rate is 9 per cent and the health expenditure per capita is US$197. Its HDI rank is 82 out of 177 countries.23 It is estimated that 26 per cent of children in Ecuador are stunted (UNICEF, 2005).
In September 1998, the government of Ecuador initiated a cash transfer scheme called Bono Solidario (Solidarity Bond) in order to increase the purchasing power of households with individuals meeting certain eligibility requirements. The political justification for the programme was to compensate the poor for losses in purchasing power caused by statutory increases in petroleum and natural gas prices, which had previously been heavily subsidised. As the Bono was implemented hastily for political reasons, no provision was made for evaluation of the programme. The Bono was implemented by the government’s Ministry of Social Welfare.
21
The nutrition survey was led by the Ministry of Social Development and Hunger Combat in co-operation with the Ministry of Health and was conducted in the field by the Nutrition Day (ND) Collaborative Group, composed of 12 universities and 10 State Secretariats of Health (Brasil, 2006).
22
Information in this section comes from Schady and Araujo (2006) and Leon and Younger (2004). 23
Unlike other cash transfer programmes, including PROGRESA and Bolsa Alimentação (Brazil), the Bono, at its inception, was not conditioned on any health- or education-related behaviours on the part of families – it was a pure income transfer. This means, therefore, that the information on impact included here can be interpreted as the income effect.
The general objective of the Bono was to broaden human capital and avoid inter-generational poverty, by channelling cash transfers directly to extremely poor and indigent households. Specifically, the Bono attempted to bridge the consumption gap in poor households, and to contribute towards reducing the levels of chronic malnutrition and preventable diseases in children up to the age of five.
The Bono was a ‘loosely means-tested’ transfer payment given to mothers with children (under 18 years of age), the elderly and the disabled. In 1998, mothers received on average US$15 (100,000 sucres) per month, and the elderly and disabled US$7.50 (50,000 sucres). In 1999, these amounts were increased by 50 per cent to account for high inflation. On average, the transfer amounted to 15 per cent of total household expenditure, a similar level to that of PROGRESA. Transfers were made via the banking system and, once registered, beneficiaries could make their monthly transfer withdrawal from any bank branch.
Targeting has not been very tight. The eligibility criteria were: recipient households should not have an income greater than about US$150 per month, nor contain any individuals working in the formal sector or affiliated with the pension or health system of the formal sector social security system (Instituto Ecuatoriano de Seguro Social). However, it has been noted that, in practice, administrators did not apply formal checks of these criteria at the beginning of the programme. Instead, participants simply had to apply to Bono saying that they met the criteria (this was often done at a church). The programme had one enrolment period, after which participant rolls remained unchanged, even if a household’s conditions had altered. However, as of 2004, administrators have checked the list electronically, removing anyone who owns automobiles or urban real estate valued above set limits, or has electricity or telephone bills above a certain amount. As a result of this weak targeting, it has been estimated that two-thirds of the Bono’s beneficiaries actually have an income higher than the official US$150 per month, and that half of all potential beneficiaries have not received the transfer. Note that overall coverage of the programme was extremely high, at 45 per cent of Ecuadorian households (1.2 million beneficiary households).
As the monitoring and evaluation system was not incorporated into the original scheme, the effectiveness of the Bono is unclear. Leon and Younger (2004) examined its impact on all three anthropometric measures, but have acknowledged that their methodology is less reliable than that used in evaluations of PROGRESA. The model that they constructed regresses the height-for-age z-score on the log of Bono income per capita (given to mother), the log of household expenditures per capita, and other individual and household characteristics that could influence children’s height.24 The key result from the data analysis is that none of the Bono income share variables are statistically significant in the model. There is, therefore, no evidence that mother’s income has a differential impact on children’s nutritional status compared to other income sources (this disputes the argument that women’s income has a stronger effect on child nutritional status than household shared income).
Nevertheless, the Bono income contributes to household expenditure, so its total impact also includes an effect from the expenditure per capita variable. For both height-for-age and weight-for-age, household expenditure has a statistically significant impact on z-scores. The authors estimated that a doubling of household expenditure per capita would increase height- and weight-for-age by 0.64 and 0.44 z-scores respectively. Table 4 shows a calculation made by the authors simulating what the impact of the transfer would have on height-for-age given that the transfer
24
was approximately 11 per cent of income expenditure on average. It can be seen that this impact is small but statistically significant.
Table 4: The simulated impact of the Bono transfer on the height of children aged 6–59 months
Bono income set to zero
Observed Difference Significance Height-for-age (z-score) -1.14 -1.08 -0.06 Reported as
significant but p-value not available Prevalence of stunting (<-2 z-scores height-for-age) 25.1% 23.6% -1.5%
Note that the impact of the Bono is minor in comparison to PROGRESA. The authors of the evaluation argue that the greater effectiveness of PROGRESA on child nutritional status in comparison with Bono is because of the former’s other supply-side components, such as mandatory health visits. In 2003, the government decided to begin conditioning the Bono on certain health-seeking behaviours, but as of 2004 the changes had not been put into practice, as the government and banks have not agreed on procedures for enforcing the conditions. The new conditional cash transfer scheme, the Bono de Desarrollo Humano (BDH, Human Development subsidy), was based on the Bono Solidario and Beca Escolar (scholarship) schemes.25
The Bono represented 1 per cent of GDP, the government’s largest social expenditure outside of education (2.5 per cent). The administrative costs were low, at less than 4 per cent of total disbursements.
Case Study Seven: The Kalomo District Social Cash Transfer Scheme in Zambia26
This programme is different from the previous case studies because it took place in an extremely poor country. Zambia has a population of 11.3 million and a GND per capita of US$887.27 It has an adult illiteracy rate of 32.1 per cent and an HIV prevalence of 16.5 per cent. Its health
expenditure per capita is US$51 and its HDI rank is 166 out of 177 countries.28 It is estimated that 49 per cent of pre-school children are stunted (UNICEF, 2005).
In November 2003, the Ministry of Community Development and Services (MCDSS) of Zambia decided to initiate a pilot Social Cash Transfer Scheme in Kalomo District. This was to be
financed by German Technical Assistance (GTZ) for an initial period of two years. First, there was a test phase from November to April 2003 and, based on the promising results, the scheme was officially launched in 2004. By February 2005, the scheme had 21 paypoints in 143 villages and
25
The BDH improved on the Bono in several ways. First, it included health conditionalities requiring children aged birth to 5 within all beneficiary households to visit health posts for growth and development check-ups and immunisation purposes. Second, a new targeting mechanism was used: a proxy means test established under the Beneficiary Identification and Selection System for social programmes (SelBen). SelBen is a proxy means test that uses information on household demographic components, assets and other variables to classify households according to their welfare levels. The programme included an information and
monitoring system. The impact of BDH on child nutritional status has not been assessed as far as we could tell. BDH has a budget of US$200m, equivalent to 57 per cent of all social assistance expenditure and 0.7 per cent of GDP, making it the biggest CCT in Latin America in terms of budget share. On 1 June 2006, the World Bank approved a US$60m loan to Ecuador to support BDH.
26
This section relies on Schubert (2005), Ministry of Community Development and Social Services and GTZ (2005), HelpAge International/IDS/Save the Children UK (2005), http://www.socialcashtransfers-zambia.org/, and personal communication with Bernd Schubert, [email protected]
27
UNDP HDI 28
monthly cash transfers to 1,027 households totalling 3,856 people in Kalomo Central and Kanchele.
The pilot scheme had several objectives. The first was to reduce extreme poverty, hunger and starvation in the ten Ministry of Community Development and Social Services most destitute and incapacitated households in the pilot region (approximately 1,000 households). The focus was mainly on households headed by the elderly and caring for orphans due to the debility or death of the breadwinner, most often as a result of HIV and AIDS. In addition, the pilot was used to generate information on feasibility and financial sustainability, and the social impacts of the scheme, to determine whether it should become part of a long-term national social protection strategy for Zambia.
The pilot was designed after research had been conducted at national, district, village and household level by the GTZ-assisted Social Safety Net Project of the Ministry of Community Development and Social Services (MCDSS). Data collection from six villages in Choma District, Southern Province, revealed that roughly 10 per cent of all households urgently required social welfare interventions, most often due to the death of a breadwinner through AIDS. These households were excluded from most social welfare schemes which focused on self-help and labour activities (Food for Work, etc) as they did not have a productive member in the household. Cash (rather than food) was given because: (i) in the research, households had said they would find it more helpful to use according to their own priorities; (ii) it was viewed as more economical, since the administrative and logistical costs were less than for food; and (iii) the purchasing power of households could result in an economic multiplier effect for the local economy. Each household chosen for the scheme received a monthly instalment of ZMK30,000 (US$6), the average price of a 50kg bag of maize. After complaints that this amount was not enough, it was increased to ZMK40,000 (US$8) to households with children. No conditions were attached to the transfer. Beneficiaries received their money through electronic transfers. Those situated within 15km of Kalomo town opened savings accounts at the Kalomo branch of the Finance Bank into which the money was transferred. Beneficiaries living further away visited paypoints established at rural health centres and schools. The financial transactions were monitored by the District Social Welfare Officer.
Targeting of households was based on two criteria. The first was that the household must be ‘critically’ poor. The second was that households must be incapacitated, in that they had no able-bodied person of working age, the breadwinner was sick or had died, and there was a high dependency ratio (about 55 per cent of beneficiary households had lost their main income-earner to AIDS). Targeting was implemented through the Public Welfare Assistance Scheme (PWAS) of MCDSS. The PWAS already had welfare assistance committees at district, sub-district and village levels. At village level, there were publicly-elected Community Welfare Assistance Committees (CWAC) covering an area of 200 to 400 households.
After training, the committees used a multi-stage participatory process to identify the 10 per cent of households which were most needy and incapacitated in the area covered by the committee. First, potential candidates were interviewed and the household structure and degree of poverty documented. Then, the CWAC ranked the interviewed households according to their severity of destitution: worst-off households ranking 1, second worst off 2, etc. The CWAC presented their ranking in a meeting with the community and discussed it with them until consensus was reached. Finally, applications were sent for the 10 per cent worst-off households to the area and district level welfare assistance co-ordinating committees for final approval.
Monitoring and evaluation were undertaken by both the district social welfare officer and an independent consultant. Baseline data were collected from beneficiary households immediately after selection for the programme but before they received the first transfer – from September to December 2004. Quarterly monitoring collected information on the effectiveness of targeting, the
reliability, timeliness and costs of the scheme, the effect of transfers on household decision-making processes, the impact of transfers on household-level welfare indicators and the impact on the community.
The key findings of the initial monitoring were that administrative costs were low at 17 per cent, with the remaining 83 per cent of the budget actually reaching beneficiaries. Targeting was effective, in that 74 per cent of beneficiary households had no member fit to work, 84 per cent were female- or elderly-headed with children, and 70 per cent of these children were orphans. The shortcoming with targeting was because not all households that were poor and incapacitated were receiving benefits, because of the 10 per cent limit. In some villages, more than 10 per cent of households fulfilled the eligibility criteria. Ninety-seven per cent of recipients were happy with the performance of banks and transfers, although 32 per cent (disabled, sick and elderly) found it difficult to access them. This is currently being addressed by allowing another household member to become a signatory and access transfers.
In terms of the use of transfers by households, 63 per cent spent the money on goods, 29 per cent on investment and 8 per cent on savings. The distribution between these three activities depended on the season. Of the percentage spent on goods, 66 per cent was for food, 9 per cent for clothing and blankets, 7 per cent for articles related to hygiene, 6 per cent for education, 5 per cent for transport and 3 per cent for health. Of the percentage invested, 40 per cent was used to buy a goat, 39 per cent a chicken and 12 per cent for seeds, fertiliser and hiring labour.
Households also saved on average 8 per cent of the transfer.
The impact data from Kalomo is much weaker than that presented in the earlier case studies. The final evaluation of the project is due to be published later in 2006, so only monitoring data is presented here. Note that some of the following improvements could be due to seasonality or other factors not related to the programme (eg, a good harvest). In terms of nutritional outcomes, the monitoring reports suggest that there was a reduction from 23 to 12 per cent in the
percentage of households having only one meal a day, and a reduction from 54 to 34 per cent in the number of beneficiaries reporting hunger pangs after a meal (indicating an increase in the quantity of food consumed). According to a small sample of children’s growth monitoring cards, the percentage of underweight children aged 0–5 years decreased from 41 to 33 per cent. This last figure should be viewed with extreme caution as: (i) not all children had growth monitoring cards; (ii) growth monitoring data are notoriously inaccurate; (iii) only a very small number of children were actually monitored; and (iv) anthropometric data may be affected by seasonality of food availability and disease. However, note that other qualitative data supported the indication that households did eat improved diets and that nutrition may therefore have improved as a result of the scheme.
Due to the success of the pilot project, the MCDSS and the African Development Bank (ADB) have planned a Zambia Child Welfare Project (ZCWP) to run from 2005 to 2009, including an expansion of the Social Cash Transfer Scheme to eight districts for the five-year period. The project may be financed by an ADB grant of US$4m and a Zambian government contribution of US$1m. GTZ would contribute technical assistance of US$1m. GTZ has also established a Social Protection Sector Advisory Group, chaired by the Permanent Secretary of the MCDSS. The Group’s main task is to integrate social protection into the poverty reduction strategy paper (PRSP) 2006–08, as well as to provide an institutional platform to successively integrate the Social Cash Transfer Scheme into the GTZ budget process. In addition, the UK Department of International Development (DFID) has signed a Programme Partnership Agreement with CARE International which includes a Social Cash Transfer Component.
If the Social Cash Transfer Scheme is extended to all the 200,000 destitute households29 in Zambia, the annual cost would be US$20m, 0.4 per cent of Zambian GDP and 4 per cent of the annual foreign aid inflow.30 The scheme would therefore be financially sustainable with the support of donors.
Case Study Eight: The KwaZulu-Natal Child Support Grant (CSG) in South Africa31
South Africa’s population is 46.9 million and the country has a GDP of US$159.9 billion; GDP per capita is US$10,346. The adult illiteracy rate is 17.6 per cent and the health expenditure per capita is US$689. Its HDI rank is 120 out of 177 countries.32 It is estimated that 25 per cent of children in South Africa are stunted (UNICEF, 2005).
In April 1998, the South African Cabinet approved the implementation of a national cash transfer programme called the Child Support Grant (CSG). The objective of the CSG was to contribute to the cost of raising children in very poor households. As a child-focused benefit emphasising the child and means of support for it, it had the motto ‘follow the child’. The initial goal was to have three million children enrolled by 2003, but after one year the take-up rate was low at 1 per cent due to difficulties in the application process. However, once this was shortened, enrolment grew dramatically. By July 2003, enrolment had reached 760,000 children in KwaZulu-Natal.
The programme was financed through the national government and administered through the existing grant administration system. At provincial level, the Department of Social Welfare oversaw the functioning of the regional and district welfare offices. The district welfare offices received applications from beneficiaries, which they processed and entered into a central computer database. Beneficiaries accessed their payment through separate pay centres – either post offices, banks or private contractors providing cash payments.
Targeting of beneficiaries was through means testing. When applying at the district welfare office, primary caregivers declared their monthly household income. If this was less than R800
(US$127) for urban households and R1,100 (US$174) for rural households, the grant was awarded. There were penalties for not disclosing full household income. All children under 14 years of age were eligible for the programme, with each child’s primary caregiver receiving R170 (US$27) per month. One caregiver could receive a maximum of six CSGs. The grant represented roughly 15–20 per cent of the beneficiary household’s monthly income, and the transfer was unconditional.
An analysis by Gertler and Woolard (2005) states that it is too soon to tell if this scheme has had an impact. A monitoring and evaluation system was not put in place and the scheme was introduced without randomised control trials or baseline surveys. However, DFID has quoted results from a preliminary study using a control group consisting of children eligible but still waiting to receive benefits, which indicates that there is a significant impact on the height (3–4cm improvement) of children aged 0–20 months. Unfortunately, Save the Children UK has not been able to get hold of this report.
29
This definition (from GTZ, 2006) of ‘destitute’ includes households with average energy consumption per capita of less than 1,400 Kcal/day with a high dependency ratio, ie, the non-viable poor. Note that this is a very extreme definition of poverty.
30
Ministry of Community Development and Social Services and GTZ (2006), p 13 31
This section is based on Hunter (2004), Case et al (2004), and Gertler and Woolard (2005). 32
Discussion
The case studies described in this paper demonstrate that cash transfer programmes have the potential to improve children’s diet and nutritional status. The positive impacts reported here exceed those reported from the more typical community-based nutrition programmes such as the Bangladesh Integrated Nutrition Programme (Moazzem Hossain et al, 2005. The tables below summarise the impact of the Latin American programmes on mean height-for-age and the prevalence of stunting.
Table 5: Summary impacts of the Latin American cash transfer programmes on mean height-for-age z-score (data from BF not available)
Age group (months) Pre-programme nutritional status Treatment group Difference Significance PROGRESA 6–36 -1.72 -1.38 -0.34 p<0.05 PRAF 0–59 -2.11 -2.07 -0.233 n.s. RPS 6–59 -1.79 -1.62 -0.17 p<0.05 PFA 0–24 -0.2 P<0.10 Bono34 6–59 -1.14 -1.08 -0.06 Reported as significant but p-value not available
Table 6: Summary impacts of the Latin American cash transfer programmes on the prevalence of stunting defined as <-2 z-scores height-for-age. (No prevalence data is available from the PFA.)
Age group (months) Pre-programme nutritional status Treatment group Difference Significance PROGRESA 6–36 45.1% 35.2% -9.9% p<0.05 PRAF 0–59 52% n.s. RPS 6–59 41.9% 36.6% -5.3% P<0.10 BF 6–11 5.3% 2% -3.3% P<0.05
Bono35 6–59 25.1% 23.6% -1.5% Not available
In the following discussion, we attempt to pull out some of the more important factors that seem to have resulted in a positive impact, and present some questions for Save the Children UK programmes to consider as they think about the appropriateness of cash transfer programmes in their country. It is important to note at this point that this discussion focuses only on the nutritional impacts of these programmes; other positive impacts – for example on education, child labour and asset creation – may have been recorded but will not be addressed here.
In our opinion, the PROGRESA programme was not only the first of a generation of cash transfer programmes but probably also the ‘gold standard’ programme. The RPS in Nicaragua, the BF in Brazil and the PFA in Colombia, which were very similar in design to PROGRESA, also had significant positive outcomes on nutritional status. However, the PRAF in Honduras did not have a positive outcome and we will try to explain why we think this happened. The Bono programme in Ecuador was different from the other Latin American programmes in that it was unconditional;
33
This difference is calculated after taking into account the control differences 34
These figures were calculated by a simulation rather than being actually observed 35
however, small positive impacts were seen on nutritional status. The information currently available from the southern African programmes seems to indicate that they have had a positive outcome on nutrition. However, the evaluation data from these programmes are not as robust as for those from Latin American, so our conclusions in these instances cannot be as firm.
What made PROGRESA so successful?
Previous discussions about the impact of PROGRESA have concluded that it is not possible to separate out the effects of the cash transfer, the provision of health services and nutritional supplements, and the nutrition and health education. This analysis is no different and we will never know exactly which was the most important factor. However, a comparison of PROGRESA with the programme that did not work might help to illuminate some of the key points.
We believe that the most important characteristics of PROGRESA were (in no particular order): 1. A large cash transfer – households received, on average, one-third of their income through
the programme.
2. Transfers were regular (every two months) and made to women.36 3. Targeting was objective and transparent.
4. Coverage was high – 76 per cent of households in the selected areas were targeted for cash transfers, and of these 97 per cent took up the programme.
5. High-quality food supplements were given to all children aged 6–24 months and to older growth-faltering children.
6. Free healthcare was provided to households.
7. Nutrition and health education was provided to all household members by well-trained medical staff.
8. The government of Mexico funded 100 per cent of the programme and controlled its development from the beginning.
The other three successful programmes in Latin America – the RPS in Nicaragua, the PFA in Colombia and the BF in Brazil – shared many of these characteristics. The few differences between them were:
• All three were at least partially financed by loans from either the World Bank or the Inter-American Development Bank, as opposed to 100 per cent financing by their national government.
• The RPS contracted, trained and paid private healthcare providers to deliver the services required by the programme, whereas PROGRESA and the PFA left the supply-side interventions to the government health and education ministries.
• The targeting system of RPS was not as clear at household level as that of either the PFA or PROGRESA; however, programme coverage was high (94 per cent of households received cash transfers in eligible areas). The Brazilian government made changes to the targeting of the BF that are believed to be at least partially responsible for an improvement in the programme’s impact.
• Young children enrolled in the RPS received vitamin and mineral supplements, but the PFA and BF children did not.
Given the success of the RPS, the PFA and the BF, it could be argued that the differences described above were not crucially important, eg, mineral and vitamin supplements may or may not be important depending on the context. However, what we believe is critical is the size of the transfer. The main difference between the PRAF and the successful programmes was that the
36
Many authors think that this is important because it improves women’s status within both the community and the household, and also because women are more likely than men to spend their income on food and healthcare for children. Save the Children UK’s experience in targeting household heads with cash-for-work in Ethiopia has not revealed that men spend the money inappropriately; however, this may vary from population to population.
transfer was small – only 4 per cent of household income. Moreover, while the beneficiaries in the other programmes received their cash monthly or bi-monthly, PRAF beneficiaries were only paid every six months. Coverage of the supply-side interventions (access to healthcare, etc) was also low in the PRAF, at only 18 per cent (at least in the first year of implementation when the
evaluation was being conducted).
The African case studies differ dramatically from PROGRESA because they are unconditional and households were not obliged to undergo health/nutrition education or attend health checks. Children were also not provided with nutritional supplements. What they did share with
PROGRESA was a relatively large transfer and, at least in Kalomo, transparent targeting. This analysis cannot provide a definitive answer to the question of whether conditional transfers are better than non-conditional ones. A comparison of the Bono and PROGRESA could shed light on this question, since the Bono did not have conditions attached to the cash transfers. The authors of the evaluation of the Bono suggest that conditional cash transfer schemes are better since they affect both the demand and the supply side, thereby impacting on child nutritional status beyond the income effect. However, while the current data from the Bono and from Kalomo imply that unconditional transfers can result in a positive impact on nutritional data, it would be interesting to look more closely at how this improvement happened – was it purely through improving dietary quality or did children also have improved access to healthcare, etc?
Clearly, conditionality will add costs to a programme in order to improve existing services. The effectiveness of supply-side interventions depends heavily on an adequate health infrastructure, making these schemes difficult to implement in poorer countries. In these situations, a
programme could contract private healthcare providers, as RPS did, to ensure sufficient supply-side resources. However, this would raise the programme’s cost and put its financial sustainability into question; Save the Children UK does not generally support this kind of intervention. Also, in some situations, as in the case of Zambia, the majority of households may have no productive members, so it might be difficult for carers to fulfil any conditionalities due to structural factors. Save the Children UK staff will need to consider whether or not a transfer programme should be conditional on a case-by-case basis. Note, however, that we are unlikely to be able to reduce stunting significantly without improving the health of children in many of the poorer countries in which we work and hence attention must be given to primary healthcare and other basic services in programmes that aim to reduce chronic malnutrition.
As for other programmes, there can be no hard and fixed rules about how cash transfer programmes should be designed – everything depends on the context. However, we hope that the following questions might be useful for programme staff thinking through how to design such a scheme, or trying to influence governments to take on this type of programme.
1. Are households able to afford an adequate diet, healthcare and education costs for their children? If so, then they probably do not need a cash transfer programme.
2. How big a transfer do you need? Do you know the costs of an adequate diet and healthcare and primary education? Are there any other costs that should be factored in to achieve a decent standard of living or, for example, compensate a household for the lack of a working adult?
3. What proportion of households need the transfer? If this is very high, consider a universal transfer; otherwise consider targeting. Also, take into consideration a rights perspective, potential social tensions, and cost.
4. How can you make the targeting system transparent and accurate? Do you need
participatory approaches, or can you use a system from another programme which is already established? What difference would it make if women were targeted?
5. What type of transfer are you planning – social assistance or cash-for-work? What would be the frequency and mode of the transfer? Is there already a government system to distribute cash to people? Does it have the necessary capacity? What will Save the Children’s relationship to the government be in this programme? If there is no government, how else could the money be transferred?
6. Is the Ministry of Health capacity sufficient to provide health/nutrition services for young children (for instance, if you made the programme conditional on receiving immunisations and mineral/vitamin supplements, would the Ministry of Health be able to deliver these services)? Is there an existing government system? If so, how can you influence this? Does the implementing ministry have the necessary capacity?
7. Have you got the capacity to properly evaluate the programme?
8. What is the exit strategy to withdraw Save the Children’s engagement from the programme? Is the programme sustainable? Can the government afford to take on a programme in the long term?
9. In addition to designing a cash programme, what other components (eg, linking to health services) are required to achieve greatest impact?
References
Attanasio, O and Mesnard, A (2005) The Impact of a Conditional Cash Transfer Programme on Consumption in Colombia, Centre for the Evaluation of Development Policies, Institute for Fiscal Studies, London
Attanasio, O, Battistin, E, Fitzsimons, E, Meghir, C, Mesnard, A and Vera-Hernandez, M (2005a)
Evaluación del Impacto del Programa Familias en Acción – Subsidos Condicionados de la Red de Apoyo Social: Informe de Primer Seguimiento, Unión Temporal IFS, Econometria and SEI, Bogota
Attanasio, O, Gómez, L C, Heredia, P and Vera-Hernández, M (2005b) The short-term impact of a conditional cash subsidy on child health and nutrition in Colombia,Centre for the Evaluation of Development Policies, Institute for Fiscal Studies, London
Barrientos, A and Holmes, R (2006) Social Assistance in Developing Countries Database, Institute of Development Studies, University of Sussex and Department for International Development, London
Bate, P (2005) The Story Behind Oportunidades, Inter-American Development Bank, Washington, DC
Behrman, J and Hoddinott, J (2001) An Evaluation of the Impact of PROGRESA on Pre-school Child Height, Discussion Paper No, 104, Food Consumption and Nutrition Division, International Food Policy Research Institute (IFPRI), Washington, DC
Birdsall, N (2004) ‘To help poor be pupils, not wage earners, Brazil pays parents’, New York Times, New York, NY
Brasil (2004) Presidência da República, Decreto nº 5.209 de 17 de setembro de 2004, Regulamenta a Lei no 10.836 que cria o Programa Bolsa Família. Available at: https://www.planalto.gov.br/ccivil_03/_Ato2004-2006/2004/Decreto/D5209.htm
Brasil (2006) ‘Chamada nutricional: um estudo sobre a situação nutricional das crianças do semi-árido brasileiro’, Cadernos de Estudos Desenvolvimento Social em Debate, N. 4, Brasília, DF: Ministério do Desenvolvimento Social e Combate à Fome, 2006. ISSN 977180807504-0. Available at:
http://www.mds.gov.br/institucional/secretarias/secretaria-de-avaliacao-e-gestao-da-informacao-sagi/estudos-e-pesquisas/cadernos_de_estudos/cadernos_estudos.htm
Caixa Econômica Federal (2006) Consulta de benefícios por Unidade da Federação, Folha de pagamento 09/2006. Available at:
https://webp.caixa.gov.br/sibec/consulta/beneficio/04.01.00-00_00.asp
Caldés, N, Coady, D and Maluccio, J A (2005) The Cost of Poverty Alleviation Transfer Programmes: A comparative analysis of three programmes in Latin America, Department of Economics, Middlebury College, Middlebury, VT
Câmara dos Deputados (2006) Execução Orçamentária. Execução Orçamentária 2006 – Versão ACCESS97" (Ação 006O e Ação 099A). Available at:
http://www.camara.gov.br/internet/orcament/principal/
Case, A, Hosegood, V and Lund, F (2004) The Reach and Impact of Child Support Grants: Evidence from KwaZulu-Natal, Africa Centre for Health and Population Studies, Princeton, NJ Dwyer, D and Bruce, J (1988) ‘Introduction’, in D Dwyer and J Bruce (eds), A Home Divided: Women and income in the Third World, Stanford University Press, Stanford, CA
Fapohunda, E (1988) ‘The nonpooling household: a challenge to theory’, in D Dwyer and J Bruce (eds.), A Home Divided: Women and income in the Third World, Stanford University Press, Stanford, CA
Flores, R S et al (2003) Evaluation of the Family Allowance Program (PRAF) in Honduras: Health and nutrition impacts, Social Policy Monitoring Network, http://www.ifpri.org/themes/praf.htm Gertler, P (2000) Final Report: The impact of PROGRESA on health, International Food Policy Research Institute (IFPRI), Washington, DC
Gertler, P and Boyce, S (2001) An Experiment in Incentive-Based Welfare: The impact of PROGRESA on health in Mexico, University of California, Berkeley, CA
Gertler, P and Woolard, I (2005) The Impact of Conditional Cash Transfers on Human
Development Outcomes: A review of evidence from PROGESA in Mexico and some implications for policy debates in South and Southern Africa, World Bank, Washington, DC