Role of invasive and non-native fish species in the
Balaton-catchment
PhD thesis
Árpád Ferincz
Doctoral School of Chemistry and Environmental Sciences, University of Pannonia
Supervisors:
Dr. Nóra Kováts, associate professor Department of Limnology, University of Pannonia
Veszprém (Hungary)
Dr. Gábor Paulovits, senior research fellow Balaton Limnological Institute, Centre for Ecological Research, Hungarian Academy of Sciences
Tihany (Hungary)
Department of Limnology Veszprém
2
IDEGENHONOS HALAK HELYE ÉS SZEREPE A BALATON-VÍZGYŰJTŐ ÖKOSZISZTÉMÁJÁBAN
Írta: Ferincz Árpád
Készült a Pannon Egyetem Kémiai és Környezettudományi Doktori Iskolája keretében. Témavezető 1.: Dr. Kováts Nóra
Elfogadásra javaslom (igen / nem) ………
(aláírás) Témavezető 2.: Dr. Paulovits Gábor
Elfogadásra javaslom (igen / nem) ………
(aláírás)
A jelölt a doktori szigorlaton ...%-ot ért el,
Az értekezést bírálóként elfogadásra javaslom:
Bíráló neve: …... …... igen /nem
………. (aláírás)
Bíráló neve: …... …... igen /nem
………. (aláírás)
A jelölt az értekezés nyilvános vitáján …...%-ot ért el.
Veszprém, ……….
a Bíráló Bizottság elnöke
A doktori (PhD) oklevél minősítése …...
……… Az EDHT elnöke
3 Table of Contents Abbreviations 6 Abstract 7 Kivonat 8 Auszug 9 1. Introduction 10 1.1 Aims 11 1.2 Definitions 13 2. Literature review 14
2.1 The biological invasion as a process 14
2.2 Possible mechanisms of an invasion 16
2.3 Human modified aquatic habitats: seedbeds of invasions 17
2.3.1 Biological invasions in disturbed watersheds 17
2.3.2 Long-term fish fauna development and invasion scenario analysis in Reservoirs 18
2.4 Ecological Risk Assessment of Non-Indigenous species 19
2.4.1 Protocol Types 20 2.4.1.1 Scoring Systems 20 2.4.1.2 Decision-Tree Models 20 2.4.1.3 Scoring-Decision-Tree Systems 21 2.4.1.4 Probabilistic modelling 22 2.4.1.5 Niche modelling 22
2.4.2 The Fish Invasiveness Scoring Kit (FISK) 23
2.5 Non-indigenous fish species in the Balaton-Catchment: a brief review 23 2.6 The “berek” areas: Almost unknown marshlands in the neighborhood of Europe’s
most deeply investigated Lake 27
3. Materials and methods 28
3.1 Survey of the non-indigenous fish species of the catchment: factors affecting the
non-indigenous fish distributions 28
3.1.1 Study area and sampling campaigns 28
3.1.2 Sampling methods: Source of fish datasets 31
3.1.3 Environmental Data 31
3.1.4 Statistical Analysis 33
3.2 Invasion scenario analysis of gibel carp in Lake Fenéki (Kis-Balaton Waterquality
4
3.2.1 Study Area 34
3.2.2 Sample collection 34
3.2.3 Statistical analysis 35
3.3 Ecological Risk assessment of non-indigenous fish species of the catchment using
the FISK (Fish Invasiveness Scoring Kit) algorithm 35
3.4 Faunistical examination of five marshland (berek) areas in the southern shoreline
of Lake Balaton 37
3.4.1 Study area 37
3.4.2 Sampling methods 38
3.4.3 Statistical analysis 38
4. Results 40
4.1 Survey of the non-indigenous fish species of the catchment: factors affecting the
non-indigenous fish distributions 40
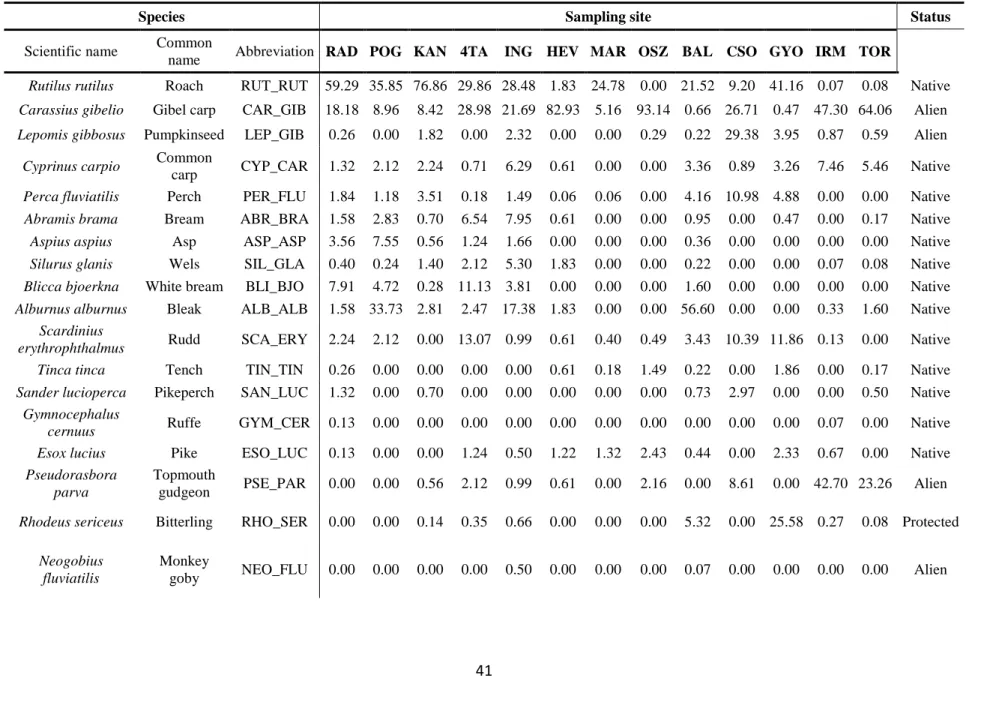
4.1.1 Species composition, diversity and naturalness 40
4.1.2 Patterns in relative abundances 45
4.1.3 Effect of local environmental and land use pattens on the relative abundance of
non-indigenous fish species 47
4.2 Invasion Scenario analysis of gibel carp (Carassius gibelio) in the KBWPS-II (Lake
Fenéki) 51
4.2.1 Species number, diversity 51
4.2.2 Changes in the assemblage structure 54
4.3 Ecological Risk Assessment of non-indigenous species 57
4.4 Faunistical examination of five marshland (berek) areas in the southern shoreline of
Lake Balaton 63
5. Discussion 66
5.1 Occurrence and distribution patterns of non-indigenous species 66
5.1.1 Species composition, diversity, naturalness and assemblage structure 66 5.1.2 Effect of local environmental and land use pattens on the relative abundance of
non-indigenous fish species 68
5.1.3 The role of local invasions on catchment level and management opportunities 69 5.2 Invasion scenario analyisis of gibel carp in Lake Fenéki (KBWPS-II.) 70
5.3 Ecological Risk Assesment using the FISK algorithm 72
5.3.1 Calibration of FISK and Risk Assessment of non-indigenous fish species in the
catchment 72
5.3.2 Validation of FISK for the catchment 76
5.3.3 Comparison of FISK I. and FISK II. systems 77
5.4 Faunistical examination of five marshland (berek) areas in the southern shoreline of
5 6. Summary 79 7. Összefoglalás 81 8. Thesis points 83 9. Tézispontok 84 10. Acknowledgements/Köszönetnyilvánítás 86 11. References 88
12. Data of scientific activities 103
12.1 International SCI-IF papers related to the topics of the theses 103 12.2 Other international lectored papers, related to the topics of the theses (without IF) 103 12.3 Refereed papers in Hungarian, related to the topics of the theses 104 12.4 Conference abstracts, related to the topic of the dissertation 104
12.5 Research reports, related to the topics of the dissertation 106
12.6 SCI-IF papers in other topic 107
12.7 Referreed papers in Hungarian in other topics 107
12.8 Conference abstracts related to other topics 108
6
Abbreviations
ANI: Assemblage Naturalness Index Arcsin-sqrt: arcus sinus-square root AUC: Area Under the (ROC) Curve CART: Classification and Decision Trees DC: Direct current
DDT: Dichlore Diphenyl Trichlore-ethane ERA: Ecological Risk Assessment
FISK I.: the version 1.19 of FISK FISK II.: the version 2.03 of FISK FISK: Fish Invasiveness Scoring Kit GIS: Geographical Information System H: Hypothesis
KBWPS: Kis-Balaton Waterquality Protection System log: logarithm (10 based)
OLS: Ordinary Least Squares PA: Presence/Absence
PCA: Principal Components Analysis RA: Relative abundance
RDA: Redundancy Analysis ROC: Recievers Opearating Curve S: Number of Species
YOY: Young of the year
PEC: Predicted Environmental Concentration PNEC: Predicted No Effect Concentration
7
Abstract
The fish assemblage of major lentic habitats of the Balaton catchment were analysed in the first study of this theses, including local environmental parameters and land use variables in order, to find relationships between these variables and the distribution and abundance of indigenous fish species. The studies have led to the conclusion that although at least one non-indigenous fish species was present in every examined site, the abundance of non-natives and also the deviation of the fish fauna from the natural state is the highest in the wetlands and the fish ponds under operation. Periodical dry-outs could be highlighted from the explanatory variables, which seemed to have positive relationships with the abundance of non-natives, especially with gibel carp (Carassius gibelio).
The long-term (1992-2011) changes of fish assemblage in the Lake Fenéki (Kis-Balaton Waterquality Protection System) were analysed in the second study, in order to assess the effects of the gibel carp invasion, which occurred after the impoundment. Although the invasion affected negatively the native assemblage, especially crucian carp (Carassius carassius) - which was completely outcompeted - the increase in the number of species and in diversity was not influenced in the examined period. Successive change in the fish assemblage was detected, however it showed a completely different pattern than former literature had indicated was from reservoirs of Central-Europe. Three phases were identified in the fauna development: a (1.) marsh phase, a (2.) invasion phase and a (3.) stabilization phase, instead of the formerly described 5 stages.
An Ecological Risk Assessment of non-indigenous species was conducted in the third study of this thesis, using the Fish Invasiveness Scoring Kit (FISK). Four of the 12 recently occurring non-native species were highlighted as of ‘high risk’ or invasive species, after the calibration of the method to the local conditions, from which gibel carp is considered to be the most dangerous, characterized by the highest score. Validation of the methodology was also carried out using the cumulative relative abundance and frequency of occurrence data, but no significant relationships have been found.
8
Kivonat
Az értekezés első vizsgálatában a Balaton-vízgyűjtő jelentősebb állóvízi élőhely-típusait elemezte a szerző a halállomány össztétele, a helyi szinten ható környezeti tényezők, és a terület használatát jellemző változók bevonásával, legfőképpen arra keresve a választ, hogy mely tényezők befolyásolják leginkább az idegenhonos halfajok elterjedését. A szerző megállapította, hogy bár minden vizsgált élőhelyen előfordult legalább egy idegenhonos faj, a fauna természetessége a működő halastavakban és a vizsgált berekterületeken a legkisebb, az idegenhonos fajok relatív abundanciája ugyanitt a legnagyobb. A vizsgált magyarázó változók közül kiemelendő, szignifikáns ható tényező az élőhely kiszáradása, amellyel úgy tűnik az idegenhonos fajok, de különösen az ezüstkárász (Carassius gibelio) tömegessége pozitív kapcsolatban van.
Az értekezésben bemutatott második vizsgálat a Kis-Balaton Vízminőség-védelmi Rendszer Fenéki-taván hosszú-távú (1992-2011) halállomány-összetétel dinamikai elemzésével foglalkozik, vizsgálja az ott lezajlott ezüstkárász-invázió hatásait. Ez a kutatás rávilágított arra, hogy bár az ezüstkárász invázió negatívan hatott a területen korábban előforduló őshonos faunaelemekre, teljesen kiszorította a széles kárászt (Carassius carassius), a frissen elárasztott víztározóban nem gátolta a fajszám és diverzitás növekedését a vizsgált időszakban. Megállapításra került, hogy a tározóban a halfauna szukcesszíven változott, de a folyamat nem volt megfeleltethető a közép-európai víztározók esetére korábban leírt modellnek. A korábban meghatározott öt fázis helyett csak hármat lehetett elkülöníteni: (1.) a lápi fázist; (2.) az inváziós fázist és (3.) a stabilizációs fázist.
A harmadik vizsgálatban a Fish Invasiveness Scoring Kit (FISK) segítségével került értékelésre a Balaton-vízgyűjtőn recensen megtalálható idegenhonos halfajok ökológiai kockázata. A módszer helyi viszonyokra való kalibrálása után megállapítható volt, hogy a 12 előforduló idegenhonos faj közül 4 sorolandó a magas kockázatú, invazív kategóriába, ezek közül is kiemelendő az ezüstkárász, amely a legmagasabb pontszámot kapta. A módszer validálásra is került: az első vizsgálatból származó kumulatív relatív abundancia és előfordulási gyakoriság adatok korrelációvizsgálata a FISK elemzésekből származó pontszámokkal megtörtént, de szignifikáns összefüggés nem mutatkozott.
9
Auszug
In der vorlegenden Dissertation analysieren wir die signifikanten Lebensraum-type von stehendes Gewässer von dem Einzugsgebiet des Plattensees mit die Verwendung variablen der Fischvorräte, der lokalen Umgebungsfaktoren und der Landnutzung, hauptsächlich um eine Antwort zu finden, welche Variablen die Verbreitung von nicht-heimische Fischarten meist beeinflussen. Unsere Erkennungen zeigten darauf zu, dass obwohl in Fall jeder geprüften Lebensraum mindestens eine die nicht-heimische Fischarte vorkommt, die Natürlichkeit der Fauna ist bei aktive Fischteichen und Haingebiete die Minderwertigste, die relative Abundanz der nicht-heimischen Fischarte hier jedoch die größte ist. Von die geprüften Erklärungsvariablen scheint die Austrocknung des Lebensraumes eine signifikante positive Verbindung mit der Masse die nicht-heimischen Arte, insbesondere mit der Masse des Giebels (Carassius gibelio) zu zeigen.
In unserer zweiten Untersuchung führten wir die langfristige Analyse der Dynamik der Fischbesatz-Zusammensetzung an Fenéki-teich des Kis-Balaton Wasserschutzsystems durch, untersuchten die Effekte der dort abgegangenen Giebel-Invasion. Diese Untersuchung zeigte, dass zwar die Giebel-Invasion ein negativer Einfluss auf die an diesem Gebiet früher vorkommenden Fauna Elemente hatte, völlig verdrängte den Bauernkarpfen (Carassius carassius), in fall der kürzlich überfluteten Reservoir inhibierte es nicht die Zunahme der Artenanzahl und Diversität in der Betrachtungszeitraum. Unsere Ermittlungen zeigten, dass die Fischfauna zeigte sukzessive Änderungen in Fall der Wasserspeicher, jedoch, der Ablauf des Prozesses passte in die früher für Mittel-Europäische Wasserspeicher vorgelegte Modelle nicht ein. Wir könnten nur 3 der früher definierte 5 Phasen trennen: (1.) Sumpf Phase; (2.) Invasionsphase; (3.) Stabilisationsphase.
In unserer dritten Untersuchung analysierten wir den Risikofaktor die im Plattensee Einzugsgebiet befindliche nicht-heimische Fischarten mit der Hilfe des Fish Invasiveness Scoring Kit (FISK). Nach der Kalibration der Methode zur Lokalverhältnisse haben wir festgestellt, dass 4 von 12 hervorkommende Fischrassen bedeuten ein großes Risiko, können als Invasiv klassifiziert werden. Unter diesen ist der Giebel ausprägend, mit der höchsten Punktzahl. Wir führten auch die Validierung der Methode durch: die kumulative Relativabundanz-, und Häufigkeitsdaten von unsere erste Untersuchung wurden mit Punktzahle des FISK-analyse vergleicht, jedoch eine signifikante Korrelation war nicht feststellbar.
10
1. Introduction
The problem of non-indigenous species and biological invasion has been widely discussed since the book entitled „The Ecology of Invasions by Animals and Plants” by Elton (1958) was published. In recent times, biodiversity of freshwaters has been decreasing at an alarming rate, faster than in terrestrial ecosystems (Dudgeon et al. 2006). In this process, exotic and invasive species were the second leading cause after habitat destruction and fragmentation (Rainbow 1998, Williamson 1999, Erős 2007). Freshwaters are considered as the most invaded habitats by alien species in the world (Cohen 2002). Biological invasions may cause not only ecological cataclysms, but also heavy economical costs (Pimentel et al. 2000, Perrings et al. 2002). These species can disturb native communities in many ways, e.g. by hybridization, competition, predation or parasitic interactions, either directly or indirectly (e.g.: Carmona-Catot et al. 2013, Kreps et al. 2012, Emde et al. 2012, Wouters et al. 2012, Preston et al. 2012). These effects are generally difficult to measure in economical terms, however the cost of defense against invasive species or the loss in the yields of agricultural product is increasing (Oreska and Aldridge 2011, Scalera 2010).
The introduction of fish species is a common phenomenon worldwide since the ancient Roman times, due to numerous reasons, such as aquaculture utilization or aquarium rearing (Balon 1995, Strecker et al. 2011). Although the generally negative effect of such introductions have been recognised, the number of intentional introductions (and the additional accidental ones) most probably will not show decreasing tendency, due to the increasing protein-need of the human population (Casal 2006).
In Hungary, exotic species have reached 25% ratio in the ichtyofauna (Harka and Sallai 2004), which is one of the highest ratios in Europe (Economidis et al 2000, Copp et al. 2006, Lusk et al 2010, Leunda 2010) but there is only scarce usable ecological or even up to date distribution information about the species. The need for and the significance of such studies is growing in parallel with the developing EU regulation on the prevention and management of the introduction and spread of invasive alien species (European Commision 2013).
In my opinion, the chance of controlling such an invasion, given the recent level of general knowledge, is limited. Hence, studies on the role of non-indigenous fish species in our waters and revealing the factors limiting or affecting their distribution patterns are needed.
11
Lake Balaton with its catchment is one of the most important and prominent regions of Hungary. Not only in the view of its natural heritage and beautiful landscapes, but also in its economical role. As the economic consequences of the spread of non-native species have been growing, he most detailed understanding of their present status is of high priority.
1.1 Aims
1. In the first part of my thesis, the status of non-indigenous species in the Balaton catchment was analyzed to:
1.1: describe the distribution patterns of non-indigenous species in the typical lentic habitats of the catchment.
1.2: reveal whether there are any spatial patterns in the distribution of non-native species in species composition or at assemblage structure level.
1.3: reveal the role of environmental and land use parameters in affecting the patterns of non-indigenous fish abundances.
2. The second main objective was an invasion scenario analysis of gibel carp (Carassius gibelio) in the Kis-Balaton Waterquality Protection System (KBWPS), regarding:
2.1 the temporal patterns in the change of fish assemblage structure between 1992 and 2011.
2.2 the effect of gibel carp invasion on the qualitative (species) composition of the native fish assemblage.
2.3. the effect of gibel carp invasion on the successive processes of the fish assemblage.
3. In the third study, the asymmetric adverse effect of non-natives was quantified using an Ecological Risk Assessment Protocol, based on recent information on the distribution and assemblage level role of non-natives. In this analysis:
3.1 the risk posed by non-indigenous fish species was quantified using the FISK (Fish Invasiveness Scoring Kit) algorithm.
12
3.3 the FISK was validated for the catchment using relative abundance and frequency of occurrence data.
3.4 the results of the original (FISK v1.19) and revised (FISK v2.03) versions of FISK were compared.
4. In the fourth study, numerous sites were surveyed in the Balaton-catchment between 2011 and 2013. Five of these sites are wetlands (“berek”) being situated by the southern shoreline of the lake and are under the Ramsar convention and members of Natura2000 network. Prior to our studies, the fish fauna of these habitats was almost unknown, hence my objective was to provide the first ichtyofaunistic data from these areas.
13
1.2 Definitions
The most important definitions of terms, which are used in the thesis are described and explained here:
Biological invasion: Successful establishment and spread of species outside their native range (Facon et al. 2006).
Invasive species: This definition is considered the most complicated and diverse one, thus here we present three formulations: (1) species with strictly monotonously expanding population (abundance) size at a given locality (Botta-Dukát et al. 2004). (2) A non-indigenous species that spreads from the point of introduction and becomes abundant (Richardson et al. 2000, Kolar and Lodge 2001). (3) Indigenous or non-indigenous species which spreads with or without the aid of humans, in natural or semi-natural habitats, producing a significant change in composition, structure or ecosystem processes or causing severe economic loss to human activity (Copp et al. 2005a). In my opinion spreading of a species without any kind of human help (for example building a canal between two river basins) is area expansion, not invasion.
Established species: a species with self-sustaining population, outside of its native range (Richardson et al. 2000, Kolar and Lodge 2001)
Indigenous species: a species found within its native range (Richardson et al. 2000, Kolar and Lodge 2001)
Non-indigenous species (=alien species, non-native species): a species introduced to areas beyond its native range by human activity (Richardson et al. 2000, Kolar and Lodge 2001) Non-invasive species: a non-indigenous species that remains localized within its new environment (Richardson et al. 2000, Kolar and Lodge 2001)
Transition: One step in the invasion process (Richardson et al. 2000, Kolar and Lodge 2001) Casual species: a species, which is introduced, but unable to sustain its presence without human intervention (Copp et al. 2005a), despite the ability to reproduce in the novel environment (Richardson et al. 2000).
Decision tree: Type of tree diagram used in determining the optimal strategy of action, in situations having several possible alternatives with uncertain outcomes. The resulting chart or diagram (which looks like a cluster of tree branches) displays the structure of a particular
14
decision, and the interrelationships and interplays between different alternatives, decisions, and possible outcomes (Snyder et al. 2012)
Ecological Risk Assessment (ERA): Estimates the likelihood of negative impact of a given stressor (here: non-indigenous species) on a recipient (here: ecosystem).
Introduction: is the deliberate (intentional) or unintentional (accidental) transfer and/or release, by direct or indirect human agency, of an organism into the wild, or into locations not completely isolated from the surrounding environment, by humans in geographical areas where the given taxon is not native. This applies to translocations within and between political states (countries) (Copp et al. 2005a).
15
2. Literature review
2.1 The biological invasion as a process
Biological invasion is a complex process. There are some more or less distinguishable phases or stages in the scenario (Kolar and Lodge 2001, Sakai et al. 2001, Heger and Trepl 2003). The stages are not rigid; they could also be described as a continuum (Williamson 2006). No real consensus in the literature can be found about the names and principally the definitions of the phases, hence, here we introduce one sequence of stages based on a review of fish invasions (Garcia-Berthou 2007):
1. Transport to a new geographical region 2. Escape or release to the wild
3. Establishment 4. Dispersal or spread
5. Interaction or integration (becoming a problem)
The probability of a transition between stages is low. It is generally argued that only 1% of the incoming species are able to become invasive. This phenomenon is named “The Rule of Tens” (or the Tens Rule) (Williamson and Brown 1986, Williamson and Fitter 1996). The rule was first realized by the study of plant invasion in Great-Britain, but the adaptability to other cases was revealed (Richardson and Pysek 2006). Recent papers, however, suggest that the vulnerability of freshwater ecosystem is considered higher, therefore introduction risk estimates from the Tens Rule are not reliable (Lapointe et al. 2012, Jaric and Cvijanovic 2012)
There is no recipe or general rule for a species to make each transition. A characteristic feature which enables or helps a successful transition can be a disadvantage, or even defeat for another (Kolar and Lodge 2001).
16
2.2 Possible mechanisms of an invasion
As cited above, the general characteristics of invasive species could not yet been identified, but some mechanism of an invasion could be characterized (Kolar and Lodge 2001). Two major sorts of goals could be identified in research papers searching for the general causes of invasions: (1) What enables a species to became an invader or a community to be invaded? (2) Comparison of successful and failed introductions in order to find a definitive list of characters that define a good invasion strategy or a vulnerable community (Facon et al. 2006). In spite of dozens of studies, carried out by the leading invasion biologists, these approaches failed (or only partly worked), because they focused separately either on the properties of the invaders or the communities (Alcaraz et al. 2005, Olden et al. 2006). Invasions mean matches or interactions between the species and ecosystems (Shea and Chesson 2002). A non-indigenous species is able to displace a native one due to two kinds of reasons: (1) It has ‘a priori’ natural pre-adaptations to exploit particular environments. In such cases, invasion is only limited by migration abilities (Allendorf and Lundquist 2003). (2) If there are no ‘a priori’ adaptations, some eco-evolutionary changes are needed (Lee 2002, Lambrinos 2004). With the combinations of these mechanism types, Facon et al. (2006) described a migration-based conceptual framework which could be useful to understand the invasion processes. They described three theoretical invasion scenarios:
(1) Migration change. According to this scenario, the pre-existing match between the invading organism and environment is essential. After a rapid change in the migration regime (eg. human help), the introduced species becomes capable of spreading in the new environment. Species with low natural migration abilities belong to this scenario. In the new environment, the invasive species performs better than natives, due to the reasons which are collectively discussed in the “enemy release hypothesis”. Shortly, it means that invading species benefit from the lack of specific native or natural enemies (Elton 1958, Keane and Crawley 2002).
(2.) Environmental change. This scenario becomes possible, when there are no migration limits and a new match between the environment and the organism occurs due to environmental change. In such situations, it is difficult to separate whether the event is invasion or range expansion. There are three potential types of environmental changes: (1) climate change (subtypes: natural and human induced), (2) human induced local scale
17
disturbances, and (3) the case when an already running invasion process opens the door for another alien species (invasion meltdown) (Simberloff and Von Holle 1999).
(3.) Evolutionary change. The invasion starts with an internal change in the genom of the presumptive invader. It can be a simple mutation or even evoked by different evolutionary forces. This scenario occurs with high likelihood, if the founder population of the introduced species is small. In this case, genetic variation is low, which enables genetic drift and sometimes the population can gain evolutionary potential from this. In another situation, genetic variation can be increased by multiple introductions from spatially distant source populations. Higher genetic diversity sometimes results in a new invasive lineage (Facon et al. 2006).
2.3 Human modified aquatic habitats: seedbeds of invasions
2.3.1 Biological invasions in disturbed watersheds
Successful biological invasions involve complex interactions between the invading species and the recipient habitats (Hayes and Berry 2008). Biologists noticed a long time ago that certain regions and habitats appear to be particularly susceptible to invasions and several hypotheses have been constructed in order to find general rules (Marchetti et al. 2006). Site characteristics suggested to favor successful invasion include (1) similar environment to the native range of invader, (2) low to moderate environmental variability, (3) high degree of disturbance, especially by human activity, and (4) low native species richness (Elton 1958, Lodge 1993).
However, many species may get established in one habitat but fail to invade adjoining areas despite continous opportunity. By examining such an invasion on landscape or even catchment scale, we may be able to determine the reasons of their success or failure in given habitats, and afterwards, implement management efforts and make predictions regarding similar systems (Light 2003). According to the traditional view, the increasing intensity or frequency of disturbance facilitate invasions (Elton 1958, Moyle and Light 1996, Hierro et al. 2006, Johnson et al. 2008). However, some recent regional-scale studies indicated the inverse effect of disturbances. For example, Light (2003) found negative correlation between the occurrence of wet years and the abundance of the invasive signal crayfish (Pacifastacus lenisculus) in the Tucknee River basin (USA, California), and concluded that unpredictable
18
flow regime and occurrence of heavy floods affect negatively the abundance of the crayfish. Similarly negative effect of hydrological disturbance on invasion success of brown trout (Salmo trutta L.) was found in the Manuherikia catchment (New-Zealand) (Leprieur et al. 2006). These and similar results imply that disruption of natural disturbance regimes will increase the likelihood of successful invasions (Moret et al. 2006).
The effect of local and landscape variables on the distribution and assembly of native and non-indigenous fish species and assemblages in the streams of the Balaton-catchment were examined by Sály et al. (2011) and Sály (2013). These studies, in contrary to the former results of Wang et al. (2003) concluded that local variables have a higher role in predicting assemblage patterns than landscape variables. The pattern explaining power of local environmental variables have been negatively affected by the non-indigenous species, however on the other hand, they concluded that the effect of landscape variables on fish assemblages depended strongly on the level of disturbance, even though the types and level of disturbances were not exactly assessed.
2.3.2 Long-term fish fauna development and invasion scenario analysis in reservoirs
The importance of long-term (>10 years) research in fish ecology is unquestionable, but only relatively few such papers are available (Smokorowski and Kelso 2002). The importance of reservoirs is growing all over the world, in parallel with the expansion of the human population and increasing demand for energy or drinking water. (Arnell 1998, Christensen et al. 2004, Williamson et al. 2009). Although these type of waterbodies are the target of most biomanipulation experiments (e.g.: Scharf 2008, Seda and Kubecka 1997), the relevance of reservoir studies is not restricted to application and management issues, and their role in recognition of community assembling rules is fundamental (Gido et al. 2009).
Information on the fish fauna development of reservoirs is restricted mostly to their deep and oligotrophic representatives (Gido et al. 2000, Riha et al. 2009). Their assemblage structure changes are characterized by successive processes with the participation of native species. These processes are well documented and usually well predictable. Based on several case studies, Kubecka (1993) divided the assemblage development of Central European reservoirs into five phases, according to the change in dominant fish species during reservoir ageing: (1) riverine species phase; (2) pike (Esox lucius L.) phase; (3) perch (Perca fluviatilis L.) phase; (4) transient perch-cyprinid phase; and (5) cyprinid-dominated phase. These studies
19
(e.g.: Hladík et al. 2008, Riha et al. 2009), even though some of them are quite recent, do not deal with the role of invasive species in such processes. Although numerous studies demonstrate the connection between the disturbance and invasibility even in the case of reservoirs (Havel et al. 2005, Johnson et al. 2008, Tarkan et al. 2012a), limited amount of data is available on the assemblage structuring function of an invasive species throughout longer periods.
2.4 Ecological Risk Assessment of non-indigenous species
Risk analysis has originally been used for the assessment of human health risk and typically restricted to hazard identification and dose-response measurements (Stohlgren and Schnase 2006). Risk assessment has also been used to quantify the consequences of (mainly chemical) contaminants, for example the effect of DDT on different bird species was assessed (Ratcliff 1967). In the 1990s, the basic concepts of risk analysis were used more frequently in the assessments of ecological risks (Stohlgren and Schnase 2006). Non-indigenous species can be considered as such ecological hazards, since their occurrence might cause damage or extinction of native communities or species. In risk assessment protocols designed for chemicals, the risk is defined as the ratio of the predicted environmental concentration (PEC) to the predicted no effect concentration (PNEC). In case of biological stressors, this ratio is incalculable, while the exposure might increase (or even fluctuate) in time and/or in space for example by migration and reproduction. These special features require special algorithms, protocols designed for the screening and assessment the role of non-indigenous species.
In many cases, the risk associated with already established non-indigenous species should also be assessed (retrospective assessment). On local scale, risk of dispersion from one habitat to another can be an issue of key importance, especially when there is any risk management option available to control within-country dispersal. The negative effect of non-indigenous species (also within the invasive category) is strongly asymmetric. Retrospective ecological risk assessment (ERA) might be able to make such differentiations between the species introduced formerly.
20
2.4.1 Protocol types
There are five commonly used types of risk assessment protocols, dealing with non-indigeous species: scoring systems, decision-tree models, combination of scoring-decision-tree systems, probabilistic models and niche modelling.
2.4.1.1 Scoring systems
Scoring systems prioritize the risk or threat posed by non-indigeous species. Scores are assigned based on the answers to a series of questions about the species, such as: species biology and ecology; potential to arrive, establishment and spread in an area; and potential impact on the invaded environment. Scores assigned to individual questions are combined in some manner, typically by addition or multiplication, by taking the mean or an extremum of sub-scores or by a combination of these to come up with an overall score for the species. An uncertainty rank is often assigned to the score for each question. These scores can then generate a prioritized list of high to low priority species and indicate the certainty associated with each score.
Scoring systems can be used for screening in both introduced/established and not yet introduced situations. Species that receive a score below a given threshold may be deemed to pose such a sufficiently low risk that no management actions, preventative measures or prohibitions on importation are necessary. Alternatively, a high score may indicate that preventative measures or prohibitions are necessary (Snyder et al. 2012).
2.4.1.2 Decision-tree models
A decision-tree is designed to screen species in or out of the class of invasive species in a systematic manner. In most cases, a dichotomous tree structure is used. A series of dichotomous questions must be answered leading the risk assessor to a decision: screen in; screen out; or assess further.
Decision-trees are not typically considered to be methods of prioritization or ranking. A screened out species is qualified as posing no risk and a screened in species poses some risk. Most decision-trees in the invasive species literature do not address prioritizing species.
21
Nonetheless, since decision-trees employ an iterative process, they could also be modified to prioritize screened in species based on the different decision-tree paths that led to the determination (Tucker and Richardson 1995, Snyder et al. 2012).
This family of methods assumes that (potentially) invading species differs from non-invasive species in some way. If a sort of differences between non-invasives and others could be found, the potential invaders could be identified (Kolar 2004). The differentiation might be based on species life history characteristics, such as: r-selected traits, high dispersal, parthenogenetic or vegetative reproduction, high genetic variability, phenotypic plasticity, large native range, eurytopy, polyphagy, human commensalism (Lodge 1993). (One could argue with the usefulness of these characters in special cases, when an invasive makes a transition in the cascade!)
The method involves multivariate statistical analyses (discriminant analysis (DA), CART analysis) based on every available data about life history characters, collected from literature sources. The major limitation of this method is that it can only predict those potential invaders, which already made a successful invasion elsewhere (Kolar 2004).
In practice, this approach was used in the case of the historical fish invasions in the Laurentian Great Lakes. Kolar and Lodge (2002) were able to differentiate fish species introduced successfully from those that failed. They used 26 variables (14 life history traits, 5 environmental factors, 6 aspects of invasions history and the degree of human use). The DA and classification and decision trees (CART) analyses identified 4 variables that discriminated a successful invader with 87 – 96% accuracy.
2.4.1.3 Scoring-Decision-Tree Systems
Occasionally , scoring and decision-tree approaches have been combined, typically with the scoring system embedded within a decision-tree framework where the score leads the assessor through a series of decisions and, ultimately, a certain screening decision (Snyder et al. 2012). Probably the widely used protocol of this type is the European Plant Protection Organization Prioritization Protocol (EPPO) (Brunel 2009).
22
2.4.1.4 Probabilistic modelling
Probabilistic systems use prior knowledge on species biology and invasion history elsewhere to form invasion probabilities for the assessment area in question, and incorporate quantitative uncertainty and variation (Diez et al. 2012). Probability thresholds related to risk are determined using known invasive and non-invasive species in the assessment area. For example, Keller et al. (2007) used a nuisance probability model within a decision-tree framework to assess the risk of freshwater molluscs.
2.4.1.5 Niche modelling
This methodology is based on a general machine learning algorithm, used to predict the distribution of species from geographical and ecological data (Stockwell and Peters 1999, Drake and Bossenbroek 2004). Input parameters consist of presence/absence (PA) information of species in discreet localities and spatially explicit niche parameters such as temperature, precipitation or elevation for example. During the modeling process, an iterative search for nonrandom correlations between the distribution data (PA datasets) and niche parameters is carried out. The outputs are identified areas where the investigated species may become established. The accuracy of the models could be tested using datasets from the native range of the species to be investigated. This tool is powerful enough to be used for any taxon and allows predictions about the potential distribution with fairly fine resolution. There are some disadvantages too: the result predicts only the potential ranges, and gives no information about impacts, nevertheless, it needs precise geospatial data distribution information (Stockwell and Peters 1999, Stockwell and Peterson 2002, Payne and Stockwell 2002, Kolar 2004).
Niche modelling was successfully used for predicting the potential range of zebra mussel (Dreissena polymorpha) in the USA (Drake and Bossenbroek 2004), distribution of 12 fish species in Kansas (McNyset 2005), and recently for modelling the potential holarctic distribution of amur sleeper (Perccottus glenii) (Reshetnikov and Ficetola 2011).
23
2.4.2 The Fish Invasiveness Scoring Kit (FISK)
For the Ecological Risk Assessment of non-native fish in the Balaton-catchment, the Fish Invasiveness Scoring Kit (FISK) was selected (Copp et al. 2005b, Copp e al. 2009). The reason for choosing this protocol was multiple: between the ERA tools reviewed, this was the most widely used (United Kingdom, Belarus, Japan, Australia, Florida (US), Iberian Peninsula, Finland, Turkey and Balkans), least complicated, but scientific-based one, with a well-understandable, “policy maker friendly” output (Copp et al. 2009, Mastitsky et al. 2010, Verreycken et al. 2009, Onikura et al. 2011, Vilizzi and Copp 2012, Almeida et al. 2013, Puntila et al. 2013., Lawson et al. 2013, Simonović et al. 2013, Tarkan et al. 2013). The baseline of FISK is the WRA (Weed Risk Assessment) system, developed by Pheloung et al. (1999) and according to Snyder et al. (2012) belongs to the Scoring system type ERA tools. The FISK is using 49 questions to assess the potential risk related to 8 topics, like: domestication/cultivation; climate and distribution; invasive elsewhere, undesirable traits, feeding guild; reproduction; dispersal mechanism and persistence attributes. These topics cover the whole sequence of invasion process.
2.5 Non-indigenous fish species in the Balaton catchment: a brief review
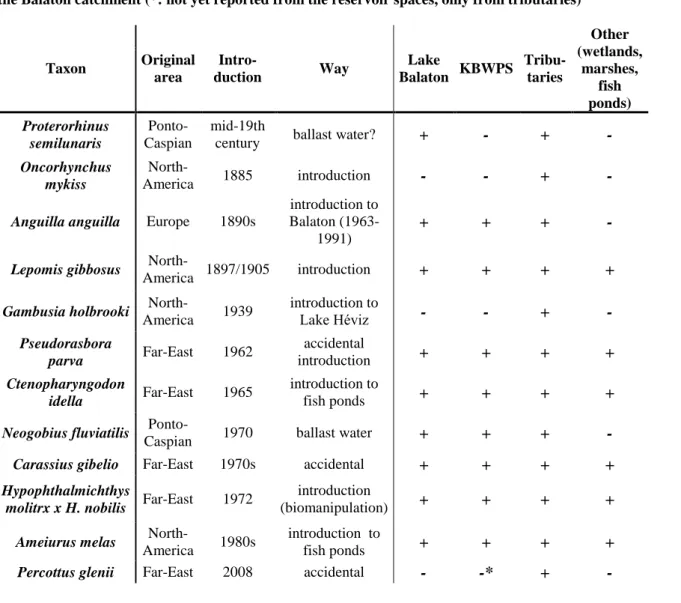
In this section, the introduction history of non-indigenous fish species, which are permanently and recently inhabiting the Balaton catchment was revieved. According to recent and comprehensive surveys, 12 non-native fish species can be found in the catchment (Table 1, Specziár 2009, Erős et al. 2009, Takács et al. 2011, Sály et al. 2011, Ferincz et al. 2012).
24
Table 1.: Introduction history, origin and occurrence of non-indigenous fish species currently inhabiting the Balaton catchment (*: not yet reported from the reservoir spaces, only from tributaries)
Taxon Original area Intro-duction Way Lake Balaton KBWPS Tribu-taries Other (wetlands, marshes, fish ponds) Proterorhinus semilunaris Ponto-Caspian mid-19th
century ballast water? + - + -
Oncorhynchus mykiss
North-America 1885 introduction - - + -
Anguilla anguilla Europe 1890s
introduction to Balaton
(1963-1991)
+ + + -
Lepomis gibbosus
North-America 1897/1905 introduction + + + +
Gambusia holbrooki
North-America 1939 introduction to Lake Héviz - - + - Pseudorasbora parva Far-East 1962 accidental introduction + + + + Ctenopharyngodon idella Far-East 1965 introduction to fish ponds + + + +
Neogobius fluviatilis
Ponto-Caspian 1970 ballast water + + + -
Carassius gibelio Far-East 1970s accidental + + + +
Hypophthalmichthys
molitrx x H. nobilis Far-East 1972
introduction
(biomanipulation) + + + +
Ameiurus melas
North-America 1980s
introduction to
fish ponds + + + +
Percottus glenii Far-East 2008 accidental - -* + -
More information about failed introductions and non-natives which disappeared could be found in the works of e.g.: Entz and Sebestyén (1942), Bíró (1997), Bíró et al. (2003), Harka and Sallai (2004). The first standardized surveys of fish fauna were started only in the late 1980s by examining the lake (Paulovits et al. 1994), the KBWPS (Bíró and Paulovits 1994), and the tributaries (Szipola and Végh 1992). The fish fauna of such important and abundant habitats like marshlands, abandoned or even functioning fish ponds are still only partially known (Ferincz et al. 2014).
Traditionally the book of Herman (1887) has been handled as reference condition regarding the fish fauna. It has also mentioned the most probably first non-native species from the lake: the tubenosed goby (Proterorhinus semilunaris). Three other species, pumpkinseed (Lepomis gibbosus), rainbow trout (Oncorhynchus mykiss) and eel (Anguilla anguilla) were
25
introduced to the catchment until the end of the 19th century for aquaculture and ornamental purposes (Herman 1890, Gönczy and Tölg 1997, Vutskits 1897, Györe 1995). The introduction of mosquitofish (Gambusia affinis) into the thermal lake of Héviz remained local, as the species cannot overwinter outside the lake (Specziár 2004).
The next wave of introductions started in the 1960s and lasted for a decade: several species with Far-Eastern origin were stocked. Topmouth gudgeon (Pseudorasbora parva) was a typical free rider, which was introduced with an uncontrolled stock of common carp (Cyprinus carpio) (Pintér 1987). The first stock of grass carp (Ctenophayngodon idella) arrived in 1965 into a fish pond in the catchment. It needs to be mentioned that grass carp has never been stocked directly (and verifiably) to the lake (Harka and Sallai 2004). The taxonomical status of the stock silver and bighead carps (Hypophthalmichthys molitrx; H. nobilis) is unclarified in the lake. H. molitrix was introduced in order to maintain the euthrophication problem of Lake Balaton, but the origin of the recent population is unclarified. The hybridisation of the two species was indicated by recent studies (Takács et al. 2011, Boros et al. 2012), thus I refer them as hybrids in this theses. This large-scale biomanipulation experiment was a major mistake and caused more problems than benefits (Virág 1995, Boros et al. 2012, Boros et al. 2013).
The monkey goby (Neogobius fluviatilis) was found in the lake in 1970, but due the low intensity of ichtyological investigations in this period, the exact date of its establishment is not known (Bíró 1972). The species most probably arrived through the Sió canal, in a ballast tank of a ship. Our knowledge on the introduction of gibel carp (Carassius gibelio) into the Catchment is limited. The gynogenetic form of the species has occurred since the 1970s (Tóth 1975, Specziár 2009). The first specimen most probably came accidentally with the stock of other species.
As such, the last intentional introduction can be dated to the early 1980s, when black bullhead (Ameiurus melas) were stocked into a fish pond near Fonyód. The species escaped rapidly, then began to spread and outcompeted the formerly introduced congener brown bullhead (Ameiurus nebulosus) (Harka 1997). Last of the introduced species, amur sleeper (Perccottus glenii) appeared in 2008 in a tributary of the KBWPS. This small bodied Odontobutiid species is considered the main threat for the native, strictly protected mudminnow (Umbra krameri), spreading continously in the vegetated canal (Erős et al. 2008, Takács et al. 2012a).
26
The speed and stages of introductions are illustrated in Figure 1. The slope of the curve is slightly lower than it was found in the case of the Hungarian section of the Danube for the same period (Weiperth et al. 2013), but this could be explained with the accessibility of the watershed. The Balaton catchment is still considered as a quite closed system, which could be an advantage in the future. Conservation management can benefit from this isolation, if appropriate regulations allow. Two main periods of mostly intentional introductions can be distinguished on the graph. The first occurred in the late 19th century and meant two aquaculture utilized species (eel, rainbow trout) and the pumpkinseed which was stocked for ornamental purposes. The second wave of intentional introductions in the 1960s and ’70s is considered more problematic and resulted altogether in 4 new species.
Figure 1: Cumulative number of established non-indigenous species between 1850 and 2010 (2nd degree polynomial regression, R2=0.9314, F=61.07, p<0.00001)
27
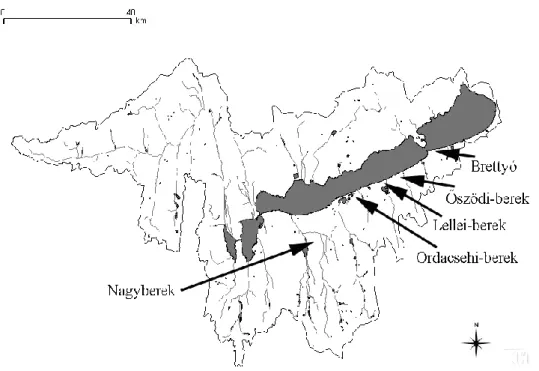
2.6 The “berek” areas: Almost unknown marshlands in the neighborhood of Europe’s most well investigated lake
Before the water conditions of Lake Balaton were regulated, the wetland areas recently lying in the southern shoreline of Lake Balaton had belonged to the lake as shallow bays (these specific wetlands are called berek in Hungarian). After the opening of the Sió-floodgate in 1863/64, the water level was lowered by app. 2 m, these bays which were usually situated behind a sand bar got disconnected. The still water covered areas behind the bar have only been drained partially after further channalization and suction (Dövényi 2010, Zlinszky and Tímár 2013). The remained wetland areas and their huge canal system provided refugia for the flora and fauna to survive, at least partially. These marshland areas in general are considered to be almost unknown in the view of their ichtyofauna, which is surprising because ichtyological studies have been intensive in the catchment at least since 2006 (Sály et al. 2011, Takács et al. 2011). The review of Majer and Bíró (2001) mentioned these areas as potentially characterized by valuable ichtyofauna, however, no exact data have been provided. Only sporadic literatural data exist regarding the fish fauna of these areas. Faunistical datasets from some reports, based on non-standardized methods indicated the presence of 6 species in the Ordacsehi-berek (Figure 3.), including the protected sunbleak (Leucaspius delineatus) (Ferincz 2005, 2006). The presence of mudminnow (Umbra krameri) was also published by Harka and Sallai (2004) from the Ordacsehi-berek. The presence of 5 species was verified in the Nagyberek by Ferincz et al. (2010) and an additional species, weatherfish (Misgurnus fossilis) was noticed in 2013 (Ferincz et al. 2013).
Regarding their role in nature conservation and international conventions (Natura2000, Ramsar Convention), the description and monitoring of the ichtyofauna of these marshlands would be necessary.
28
3. Materials and methods
3.1 Survey of the non-indigenous fish species of the catchment: factors affecting the distribution of non-indigenous species
3.1.1 Study area and sampling campaign
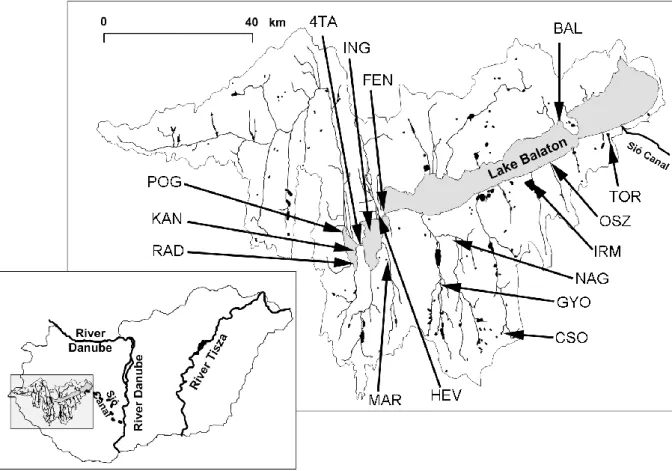
Altogether 15 lentic sampling localities were chosen in different parts of the catchment (Figure 2). Fish samples were collected from April of 2011 to November of 2011.
Figure 2.: Map of the Balaton catchment, with the sampling sites surveyed in 2011 (Abbreviations: HÉV: Hévíz-páhoki Canal, Fenékpuszta; FEN: Lake Balaton, Fenékpuszta; BAL: Lake Balaton, Sajkod; TOR: Pond 10., Siófok-Töreki Pond System; OSZ: Őszöd-marshland, Balatonőszöd; IRM: Pond 7., Balatonlelle-Irmapuszta Pond System; NAG: Nagyberek; GYO: Pond 2., Marcali-Gyótapuszta Pond System; CSO:
Csombárdi – pond, Csombárd; MAR: Marótvölgyi-Canal, Főnyed; RAD: Inner Reservoir Space of KBWPS-I (Kis-Balaton Water Protected System).; KÁN: Inner Reservoir Space of KBWPS-I.; POG: Outer Reservoir Space KBWPS – I.; ING: KBWPS-II., 4TA: Interconnecting canal between KBWPS
29
The whole catchment area can be considered to be highly modified by human land use (e.g. Sály et al. 2011). As described in Section 2.5, the fish fauna of the small watercourses and the lake itself is quite well known. The sampling sites of this study were selected to represent mostly unexplored, but typical lentic wetlands of the catchment: intensively managed fish ponds (2 sites); extensively managed, nature reserve ponds (2 sites); marshes (or wetlands) (2 sites); canals (2 sites); the reservoirs of Kis-Balaton Waterquality Protection System (KBWPS) (5 sites); and the littoral zone of Lake Balaton (2 sites) Sampling sites were as follows:
Hévíz-páhoki Canal, Fenékpuszta (HÉV): This canal carries the outflowing water of the thermal lake of Héviz into River Zala. The estuary is situated close to the outflow of River Zala from the second stage of Kis-Balaton Water Protection System. Sampling area is located 1 km upstream from the estuary. The vegetation of the shorezone is mostly reed, and massive submerse vegetation.
Lake Balaton, Fenékpuszta (FEN): Detailed description of Lake Balaton can be found e.g. in Istvánovics et al. (2007). The sampling site was situated app. 1.5 km north of the Zala estuary and can be characterized by semi-natural, wide vegetation on the edge.
Lake Balaton, Sajkod (BAL): This site is located in the most protected and most natural bay of Lake Balaton. It can be characterized by high quality, wide reed and reed-mace belt and dense submerse vegetation in patches.
Siófok-Töreki Pond System (TOR), Pond 10: This relatively small (12.4 ha) valley-dam pond is a part of a fish pond system (altogether 11 ponds), recently used as a recreational (angling) pond. Native and non-native species (carp (Cyprinus carpio); pikeperch (Sander lucioperca); grass carp (Ctenopharyngodon idella)) are often stocked. The shoreline has a narrow vegetation line, with some fallen trees. The water supply originates from the Cinege-creek, flowing to Lake Balaton.
Őszöd-marshland, Balatonőszöd (OSZ): This area (app. 70 ha) formerly had belonged to Lake Balaton, but after the opening of the Sió-floodgate it became disconnected. A peat mine was operated until the 1970s and afterwards, the borrow pits were inundated. The water supply is provided mainly from precipitation and the level is regulated by suction to Lake Balaton. The open water surface is spotted by reed islands. Shoreline vegetation is developed. Balatonlelle-Irmapuszta Pond System (IRM), Pond 7: This pond is a typical fish farming pond in this area. The 46 ha open water surface is surrounded by a developed reed belt. The
30
water supply is provided by the Tetves-creek which is connected to Lake Balaton, but sometimes inadequately.
Nagyberek (NAG): This area is the largest remain of a former bay of Lake Balaton. The sampling area is situated in the northern part of the app. 350 ha reconstructed wetland (mostly open water surface with reed islands and inundated willow bushes). Water supply mostly comes from precipitation, water level is controlled by a floodgate.
Marcali-Gyótapuszta Pond System (GYO), Pond 2: The oldest pond system in the watershed, with a dam. Area of the sampling pond is 36 ha, with reed in the littoral, dense submerged vegetation in the whole area of the pond. Its water supply comes from the Boronka-creek. Since 2002, only extensive fish management has been implemented, with the aim of nature conservation.
Csombárdi Pond (CSO): One of the most southern ponds in the watershed. It is connected to the Pogányvölgyi Stream system. Approximately 2/3 of its 7 ha area is covered by vegetation (mostly cattail, reed to less extent), the submerged vegetation is also dense. Since 2008, only extensive fish management has been implemented, with the aim of nature conservation. Marótvölgyi-Canal, Főnyed (MAR): The canal is one of the most important tributaries of the 2nd phase of the Kis-Balaton Water Protection System, and has several intensely managed fish ponds in its watershed. Although its area is heavily modified, its vegetation has a natural character: the shorezone is covered by reed, the submerged vegetation is very dense. It is the first site of occurrence of the amur sleeper (Perccottus glenii) in the watershed (Erős et al. 2008).
KBWPS – I, Lake Hídvégi (Kis-Balaton Water Protection System) (KAN; RAD; POG): For detailed descrition of KBWPS, see e.g. Pomogyi 1993; Tátrai et al. 2000; Korponai et al. 2010. Sampling was carried out in the moderately developed reed-cattail vegetation in the littoral of the reservoir which was inundated in 1985. Submerged vegetation is not typical, the bottom is normally muddy.
Interconnecting canal of KBWPS – I and II. (4TA): An approximately 20-30 m wide canal in the former bed of River Zala, with a dense macrophyte (willow bushes, reed) coverage in the shoreline.
31
Unfortunately, due to the drought inducated waterlevel decrease in case of the Fenékpuszta site (FEN) and the complete drying out of Nagyberek (NAG), the dataset of these sampling sites included only 1 or 2 samplings. Hence, these places were excluded from the further analyses.
3.1.2 Sampling methods: Source of fish datasets
Electrofishing was carried out seasonally, 3 times in each site: in spring (April/May), summer (June/July) and autumn (October) in 2011. Sampling was conducted along the same transect in every season near the vegetated shoreline from a small, 12 V electric motor powered rubber boat using a SAMUS 725 MP, 12 V battery-powered device (used at Pulse DC 380-580 V; 50-70 Hz). Based on the methodological investigations of Erős et al. (2009) and Specziár et al. (2012), this method has adequate power to obtain reliable information regarding the assemblage structure. The duration of each sampling occasion was 60 minutes, which represented a transect length of 1606 ± 210 m, in average. Each captured fish was identified at species level and then released, except the non-natives. The data of 0+ (YOY) fish were excluded from the analyses.
3.1.3 Environmental Data
The sampling sites were charactized by 13 habitat and 6 land use characteristics (Table 2). For littoral macrovegetation cover (Reed, Rmace, LOther), percentage ratios were calculated based on visual estimation for every 50 m segment of the transects we electrofished. For the calculation of percentage ratios for bottom quality and means for water depth, they were measured at 10 randomly selected points close to the transects. These measurements were conducted during summer sampling. A HORIBA U-10 water quality checker was used to measure turbidity, conductivity and pH at each sampling occasion. Surface area and land use data were gathered from digitalized topographical maps using GIS software or from literature sources (Dövényi 2010, VKKI 2010). In some cases (mainly for the assessment of the occurrence of droughts), the managers of the watersheds (staff of the national park directorates) were interviewed.
32
Table 2: List of the environmental variables used in the RDA and variance partitioning (all habitat characteristic data were log(x+1) transformed)
Name Abbreviation Measure Mean±SD
Habitat characteristics
(Local effects)
Reed (Phragmites communis) Reed Shoreline coverage (%) 58.46±27.69 Reed-mace (Typha sp.) Rmace Shoreline coverage (%) 29.76±26.03 Other macrophytes in the littoral zone (e.g.: Carex sp., Juncus sp.) LOther Shoreline coverage (%) 9.61±13.65
Submerse macrophytes (Potamogeton sp., Myriophillum sp.,
Ceratophyllum sp.) Smerse Coverage (%) 27.07±28.85
Area Area km2 52.06±156.7
Silt Silt Bottom coverage (%) 62.3±30.92 Sand Sand Bottom coverage (%) 18.46±21.07 Gravel Gravel Bottom coverage (%) 10.38±18.24
Clay Clay Bottom coverage (%) 8.84±11.46
Turbidity Turbid NTU 117±118.7
Conductivity Cond µS/cm 703.38±136.3
pH pH 8.41±0.41
Average depth Depth cm 105.38±44.99
Land use characteristics
Activity of commercial fisheries Fishing
Binary data Water level managed by suction Suction
Water supply from inflow/tributary Inflow Watershed dried out at least once in the last 10 years Drought
Human made habitat Constructed Protected habitat Protected
33
3.1.4 Statistical Analysis
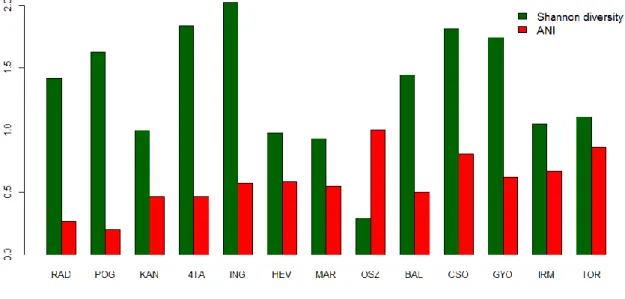
Spearman rank correlation was applied to test the relationship between the total abundance (mean/cumulative number of specimen) and spatial frequency of occurrence data. The taxonomic diversity of each sampling site was assessed by using Shannon-index. The incrimination or stress of Shannon’s H, caused by the non-indigenous species was assessed using the Assemblage Naturalness Index (ANI) (Sály 2007, 2009). The relationship between ANI and total relative abundance of non-native species was tested with Spearmann’s rank correlations. These analyses were conducted in PAST software (Hammer et al. 2001).
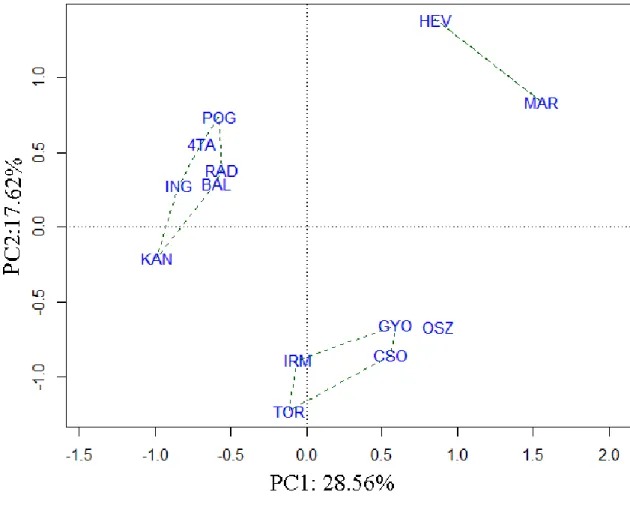
The arcsin-sqrt transformed fish datasets based on relative abundance (RA) data, summarized for each site were used for the assemblage level analyses. The pattern of species composition (PA) was assessed in a PCA ordination. A Bray-Curtis dissimilarities based nearest neighbour cluster analysis was performed in paralel and its results were displayed on the ordination diagram. Another PCA was performed on the RA dataset. All environmental variables listed in Table 2 were used in a forward selection procedure of redundancy analysis (RDA) to select variables that significantly explain the distribution of the non-indigenous species. Forward selection revealed significant effects both among habitat characteristics (reed coverage, clay bottom coverage, turbidity, area) and land use variables (drought occurrence), which were used in a variance partitioning model (Borcard et al. 1992). A similar model was built for the native species only, to investigate the potential effect of the investigated variables on the native fish assemblage. These analyses were made in R software (R Development Core Team 2013), with the package ’packfor’ (Dray et al. 2013) and ’vegan’ (Oksanen et al. 2013).
34
3.2 Invasion scenario analysis of gibel carp in Lake Fenéki (Kis-Balaton Waterquality Protection System)
3.2.1 Study Area
The Ingó-marsh (N: 46°38’46.68”, E: 17°11’24.10”) is the first inundated part of the shallow (1.1–1.2 m deep) hypertrophic (Hatvani et al. 2011; Kovács et al. 2010) Lake Fenéki (also called: Kis-Balaton Waterquality Protection System (KBWPS), 2nd stage), being situated a few kilometres southwest from Lake Balaton (Figure 2, ING). Originally, this area belonged to Lake Balaton as its most western basin. After 1863, the Sió-floodgate started to operate and the water level lowered by approx. 2 meters, and Kis-Balaton became disconnected. The area continued to dry out, and the complete disappearance of open water surfaces happened only in the 1950s. The remains of the native fish fauna could only survive in some draining canals and two small ponds (Bíró and Paulovits 1994, Korponai et al. 2010). In the 1970s, after the recognition of the accelerating euthrophication of Lake Balaton, the reconstruction of KBWPS began (Lotz 1988).
The system is made of two reservoirs: the first (Lake Hídvégi, 21 km2), which is characterized as open watersurface gives ideal conditions for algae to reproduce and has been operating since 1985. The second (Lake Fenéki), which was the study area, was inundated partly (16 km2 from the planned 54 km2) in 1992 (Tátrai et al. 2000). The main purpose of the KBWPS is to retain the nutrients carried by the River Zala (Pomogyi 1993). The water in KBWPS is slightly alkaline (pH=7.5–8.5); characterized by 600–700 µS/cm conductivity (see more: Kovács et al. 2010, Hatvani et al. 2011).
3.2.2 Sample collection
Seasonal samplings have been carried out from 1992 to 2011 (3 samplings annually: April/May, June/July and October). Altogether, data from 12 years were included in the analysis as data were lacking or not standard in some years (1998; 2002; 2004-2008 and 2010). I was involved to these surveys only in 2009 and 2011, other datasets was provided by my supervisor. A standard locality near the vegetated (reed and reed-mace) shoreline and inundated willow-bushes was electrofished from a boat, using a 12 V battery powered device (used at Pulse DC 300-500 V; 50-70 Hz). This sampling site represents all of the typical
35
habitats of the Ingó-marsh. The duration of each sampling occasion was 60 minutes, which is equal to 1606 ± 210 m transects, in average. Each individual caught has been identified at species level, and then released.
3.2.3 Statistical analysis
Ordinary Least Square (OLS) regression has been used for temporal trend detection in the cumulative number of specimen. Logarithmic regression has been used for yearly total species number and Shannon-diversity, calculated for the whole sample for the year.
Relative abundances were calculated as the ratio of number of individuals of a given species to the total number of individuals in the catch. Cumulative relative abundances of species groups (eg. non-indigenous species; natives) were calculated as summarized relative abundances of species belonging each group. Relative abundance data were arcsin-square root transformed. Centered Principal Components Analysis (PCA) was carried out on the relative abundance data matrix to explore the patterns of assemblage level changes, at first on the whole time-series. As huge contrast between the first two years (1992 and 1993) and latter years were recognized, another PCA on the datasets of years between 1994 and 2011 was performed. An Analysis of Similarities (ANOSIM) on the Morishita dissimilarity matrices was performed on the two most possible groups, revealed by the PCA, to test whether their assemblage structures differs significantly. Analyses were performed with vegan package in R statistical environment (Oksanen et al. 2013, R Development Core Team 2013).
The functional composition (i.e. ‘trophic guild’) of fish assemblages was determined based on the work of Erős et al. (2009). Species missing from this study were categorized by using the system of Balon (1981). In order to assess changes in the relative abundance of trophic guilds in the sampling period, the OLS method was used.
3.3 Ecological Risk Assessment of non-indigenous fish species of the Catchment using the FISK (Fish Invasiveness Screening Kit) algorithm
The FISK questionnaire has two versions. The orignal (FISK v1.19, FISK I, Appendix 1) was developed and first time used in the UK, by Copp et al. (2009), then successfully adopted in Belarus (Mastitsky et al. 2010), Belgium (Verreycken et al. 2009) and Japan (Onikura et al.


![Stability indicating HPLC method for the determination of chiral purity of r-(-)-5-[2-aminopropyl]-2-methoxybenzene sulfonamide](data:image/gif;base64,R0lGODlhAQABAIAAAP///wAAACH5BAEAAAAALAAAAAABAAEAAAICRAEAOw==)