Philippines
Metro Manila LRT Line 1 Capacity Expansion Project
External Evaluator: Atsushi Fujino (KRI International Corp.) Field Survey: September 2004 1. Project Profile and Japan’s ODA Loan
Project site location map One of the newly-procured carriages
1.1 Background
The LRT (Light Rail Transit) Line 1 (14.5km) was financed by a loan from the Belgian government and began its operation in 1985. It was the first mass transportation constructed in the Philippine’s and runs north to south through Metropolitan Manila (17 municipalities, covering an area of 636km2, population 9.93 million; Tokyo’s 23 wards cover an area of 621km2, population 8.41 million). In 1994, LRT Line 1 carried approximately 403,000 passengers per day (the Toei Mita Line has around 500,000 passengesr per day) and had become a firmly established means of transportation for citizens in the area. However, increases in the number of passengers meant that the capacity with the existing two-car trains reached the limitation. Since 1990, passengers were often forced to be left off during the morning rush hour and the trains were delayed on a daily basis.
Meanwhile, economic growth in the 1990s led to a surge in the number of vehicles and the resultant congestion on roads in Metro Manila generated economic losses and air pollution. Under such circumstances, there were calls for the immediate provision of a safe, comfortable, inexpensive and punctual mass transport system.
1.2 Objectives
The project’s objective was to expand the transport capacity of Metro Manila Light Rail Transit (LRT) Line 1 and to improve passengers’ comfort by procuring new rolling stock cars and by improving existing facilities, and thereby alleviates congestion on the roads and improves in the urban environment.
Baguio Cebu City Manila Davao Philippines Project site
1.3 Borrower/Executing Agency
Government of the Philippine Republic/Light Rail Transit Authority (LRTA)
1.4 Outline of Loan Agreement
Loan Amount/Disbursed Amount 9,795 million yen/9,325 million yen
Exchange of Notes/Loan Agreement November 1994/December 1994
Terms and Conditions Interest Rate
Repayment Date (Grace Period) Procurement
3.0% 30 years (10 years)
General untied
(Consultant component: partially untied)
Final Disbursement Date April 2002
Contractors Marubeni Corporation (Japan),
ABB Daimler-Benz Transportation (Sweden), ABB Power Inc. (Sweden), etc.
Consultants Katahira Engineering International (Japan),
Nippon Koei Co., Ltd. (Japan), Tonichi Engineering Consultants, Inc. (Japan), De Leuw Cather International Limited (USA), etc.
Feasibility Study (F/S), etc. Government of the Philippine Republic
2. Results and Evaluation 2.1 Relevance
2.2.1 Relevance of project plans at appraisal
At appraisal, the five-year Medium-Term Philippine Development Plan (1993-1998) called for alleviating traffic congestion in Metro Manila and improving the environment in the capital. To achieve these goals, there was a growing need to establish a mass transport in Metro Manila. This project was assigned high priority1 in that it was designed to tackle the above issues; it involved the provision of rolling stock cars for LRT Line 1, whose capacity had reached its limitation.
2.2.2 Relevance of project plans at evaluation
The current five-year Medium-Term Philippine Development Plan (2004-2010) cites the alleviation of traffic congestion in Metro Manila and efforts to improve the urban environment as an ongoing important issue. In addition, the Metro Manila Urban Transportation Integration Plan2, which is a Master Plan for the period from 1999 to 2025, highlights the importance of developing a public transport system in the capital. As this demonstrates, the capacity expansion in LRT Line 1 by this project was designed to
1 The LRT Line 1 Capacity Expansion Project was one of the flagship (priority) project’s to be selected by
then president Fidel Valdez Ramos in 1993. The LRT Line 2 Construction Project was also selected.
2 The Master Plan (M/P) was developed under technical assistance from the Japan International Cooperation
address the above issues and have therefore maintained their significance to the present day3.
2.2 Efficiency 2.2.1 Outputs
A comparison of the planned and actual outputs for rolling stock cars procurement and improvements to existing facilities with is shown in Table 1. A map of the project site is shown in Figure 1.
Table 1. Comparison of Planned and Actual Outputs
Planned (appraisal) Actual (ex-post evaluation)
1. Procurement of rolling stock cars: 32 cars (addition of single cars with identical spec to the existing 2-car trains for each of the 32 currently operational trains)
* Capacity: 1,122 passengers/train
2. Upgrading of existing facilities: electrical equipment, storage track, electric overhead lines, signals/telecommunications system, station buildings, rolling stock cars depot
3. Consulting services: bidding assistance, work management, technical assistance for
operation and maintenance work (foreign consultants: 65M/M; local consultants: 82M/M)
1. 28 cars (7 new 4-car trains) * Capacity: 1,358 passengers/train
2. Platform extensions, ballast (paving stone) replacement work (additional)
3. Foreign consultants: 81M/M; local consultants: 82.68M/M
3 Phase 2 of this project, which is financed by a Japanese ODA loan (L/A: April 2000; loan amount: 22,262
million yen) and aims to effect further expansions in the capacity of LRT Line 1, is currently in progress (major outputs: procurement of rolling stock, improvements to the signaling system). Similarly, a Japanese ODA loan was used to fund construction of LRT Line 2, which began its operation in 2004.
Figure 1. Project site location map
Concerning rolling stock cars procurement, it was planned that new cars with identical specifications would be procured for existing two-car trains so that each train would then consist of three cars. However, transport demand exceeding appraisal forecasts was confirmed and accordingly, new four-car trains were procured instead. The 32 existing two-car trains were reconfigured as 21 three-car trains.
The improvements to existing facilities were basically implemented in accordance with the original plans, but station platforms were also extended to conform with the introduction of four-car trains abovementioned, and some of the ballast (paving stone) replacement work that was initially scheduled to be financed by the executing agency under a separate project was added onto the outputs of this project.
2.2.2 Project Period
The appraisal documents stated that the project was to be implemented in a 61-month period from December 1994 to December 1999. However, the project in fact took 88 months to complete (December 1994 – March 2002). The delays were primarily due to the delay for the technical evaluation, because the bidding procedures required long time
In planning Monumento LRT Line 1 Libertad Baclaran North Avenue LRT Line 2 Cubao MRT Line 3 Santolan Manila Bay Central Carriedo D. Jose Tayman
to complete4. It should be noted that, without the ballast replacement work, all original outputs were completed in May 2001 (i.e. in 78 months).
2.2.3 Project Cost
Total project costs were estimated at 10,439 million yen, with 9,795 million to be covered by Japan’s ODA loan. Actual project costs amounted to 10,173 million yen (97.5% of the planned budget), with Japan’s ODA loan portion totaling 9,315 million; thus both sums were kept within the original budget.
2.3 Effectiveness
2.3.1 Transit Capacity Expansions
In procuring rolling stock cars and upgrading existing facilities on LRT Line 1, the implementation of this project served to increase maximum passenger capacity (one-way) from 18,000 passengers/hour before the project to 27,000 passengers/hour after the project. Furthermore, as shown in
Table 2, the number of running trains has increased over pre-project levels.
However, inefficient spare parts procurement procedures for operation and maintenance has led to a drop in the operating rate of trains since 2001 when the major portion of the project’s outputs was completed, ,and consequently the number of running trains is on the decline.
Table 2. No. of Services and Capacity Operating Rates for LRT Line 1 Trains No. of services (p.a.) Operating rate
1994 334,176 N/A
2001 455,113 74.4%
2002 434,242 76.3%
2003 385,965 69.8%
Source: LRTA
2.3.2 Increased Number of Passenger
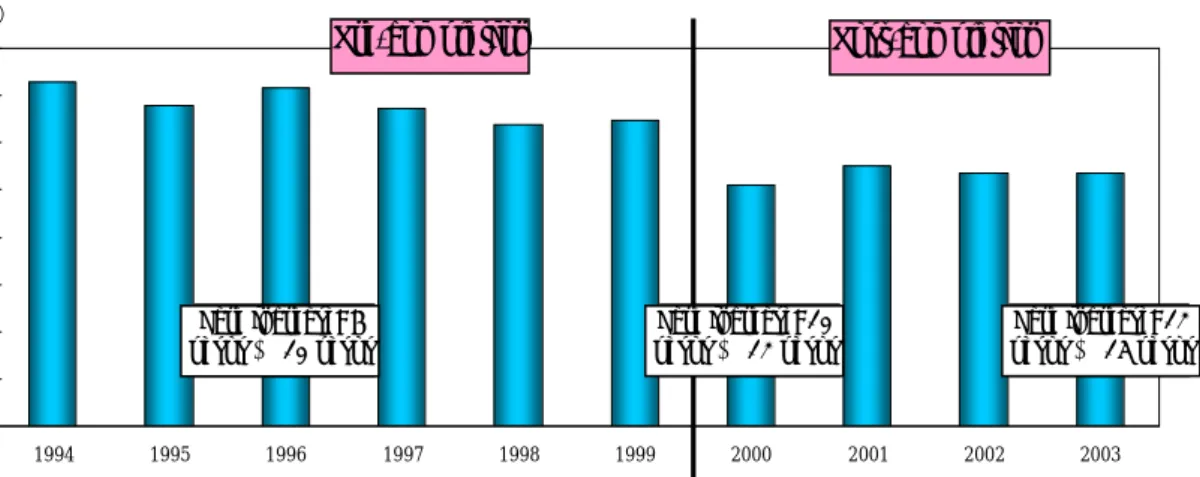
At appraisal, it was supposed that expanding the capacity of LRT Line 1 would lead to increases in the number of passengers. However, the number of passengers two years after the completion of the project (2003) was just 107.2 million, or 52.4% of the original target of 204.4 million two years after the completion (initially set for 2001; see Figure 3). This is partly due to a slowdown in economic growth attributable to the Asian economic crisis. Another reason is that the impact of opening of MRT Line 3, which competes the route with LRT Line 1, was greater than expected5.
4 According to interviews with staff of the LRTA planning department held during the evaluation.
5 MRT Line 3 (16.8km) was built using private funding and become fully operational in 2000; at evaluation Fig. 2. EDSA Station during
Figure 3. Number of Passengers on LRT Line 1 0 20 40 60 80 100 120 140 160 1994 1995 1996 1997 1998 1999 2000 2001 2002 2003 (百万人) 運賃値上 10ペ ソ → 1 2 ペ ソ 運賃値上 1 2ペ ソ → 1 5 ペ ソ 運賃値上 6ペ ソ → 1 0 ペ ソ 完 成 後 完 成 前 Source: LRTA
2.3.3 Revenues from Fares6
The target for revenues from passenger fares on LRT Line 1 was set at 1,430.8 million pesos two years after the completion (2001). Taking inflation into account, the target (at 2003 prices) was calculated to be 2,454.2 million pesos7. Actual revenues (in 2003) amounted to 1,256.7 million pesos, or 51.2% of the target.
2.3.4 Improved Passenger Comfort
The capacity expansion in this project has served to improve passenger comfort. As Table 3 shows, daily congestion has improved by more than 10%, from an average 80.0% in 1994 to 68.8% in 2003. Furthermore, this evaluation revealed that the project has contributed to the virtual elimination of passengers, who were forced to wait for the next train, during the morning rush hour at appraisal.
Table 3. Congestion Rates Average daily congestion rate 1994 80.0% 2001 60.2% 2002 61.2% 2003 68.8% Source: LRTA
it was carrying approximately 150 million passengers per year.
6 At appraisal, the fare was 6 pesos, but this was raised to 10 pesos in 1996, to 12 pesos in 2000, and then
to15 pesos in 2003.
7 This figure was calculated using the consumer price index (International Financial Statistics [IMF]) for
1994 - 2003. Pre-completion Post-completion Fare increase: 6 pesos → 10 pesos Fare increase: 12 pesos → 15 pesos Fare increase: 10 pesos → 12 pesos
Various measures have been taken with a view to improving passenger comfort on LRT Line 1, including the introduction of women-only cars and the installation of special seats for the elderly and disabled. According to the beneficiary survey8 conducted during the field survey for this evaluation, 74.1% of respondents stated that they were either “extremely satisfied” or “satisfied” with the comfort of LRT Line 1 services, due to these measures.
2.3.5 Recalculation of FIRR
At appraisal, the project’s financial internal rate of return (FIRR) was estimated at 7.1%; for the calculation with costs as project costs and operation/maintenance costs, and benefits as the revenues from fares. The same parameters were used for the recalculation, which yielded a figure of 1.7%, or less than the target value. This lower figure is explained by the drop in the number of passengers, which means that the revenues from fares have failed to reach target levels (refer to section 2.3.3 for details).
2.4 Impact
2.4.1 Alleviation of Traffic Congestion
In expanding the capacity of LRT Line 1, this project was expected to alleviate traffic congestion in Metro Manila. Although city-wide increases in traffic volume have produced similar trends on roads adjacent to LRT Line 1, it is estimated that the project has somewhat served to curb these increases. The beneficiary survey found that 53.1% of respondents believe that the project has contributed to reductions in traffic congestion on roads along with LRT Line 1.
2.4.2 Mitigation of Air Pollution/Traffic Noise Level
Besides helping to alleviate traffic congestion, the project was also expected to contribute to reductions in air pollution and traffic noise on roads adjacent to LRT Line 1. According to results from the beneficiary survey, 55.6% and 46.9% of respondents evaluated the project as having respectively contributed to reductions in air pollution and road noise.
Furthermore, as Table 4 shows, total suspended particulate (TSP) concentrations measured at various points along LRT Line 1 are all lower than the Philippine national
8 As part of the ex-post evaluation, 162 passengers on LRT Line 1 (disembarking at Monumento, Carriedo
or EDSA stations) were interviewed using a questionnaire, with a view to establishing whether or not services have improved, whether or not these improvements have served to alleviate congestion on the roads, and what impact the project has had on air pollution and road noise.
Fig. 4. The inside of a women-only train car
standard of 230 µg/Ncm.
Table 4. Total Suspended Particulate (TSP) Concentrations (24-hour average) Year Tayuman Station vicinity Libertad Station vicinity
2001 130µg/Ncm 162µg/Ncm 2002 168µg/Ncm 151µg/Ncm 2003 173µg/Ncm 174µg/Ncm Source: DENR 2.5 Sustainability 2.5.1 Executing Agency 2.5.1.1 Technical Capacity
The operation and maintenance of the facilities and equipment developed in this project is outsourced to private-sector contractors selected by LRTA. The selection process is subject to competitive bidding, which ensures that the contractors have the requisite technical capacity to undertake the work in hand.
2.5.1.2 Operation and Maintenance System
At appraisal, operation and maintenance work was outsourced to METRO Inc., a wholly-owned subsidiary of LRTA9. Today, the LRTA operations division is responsible for running train services, while maintenance work is outsourced to private-sector contractors as stated above (see Figure 6). Plans for the rail sector, of which LRT forms a part, are developed by the Department of Transportation and Communication (DOTC), i.e. the supervisory agency.
9 Services on LRT Line 1 were suspended during the strikes of July 25 and August 2, 2000. LRTA did not
subsequently renew its contract with METRO Inc., and from August of that year began outsourcing its maintenance operations to private-sector contractors.
Fig. 5. Maintenance work in progress at the depot
Figure 6. Organization Chart of O&M System 民間委 託 業者 理事会 長 官 管理部 財務部 計画部 運営部 法務・人事課 総 務 課 経 理 課 予算・財政計画課 運行グループ エンジニアリング・ グループ 資金管理課 情報管理 システム課 運営担当 維持管理担当 2.5.1.3 Financial Status
Prior to project implementation at the end of 1992, LRTA was burdened with excess debts. It had long-term liabilities totaling 5.2 billion pesos and its profits were squeezed by the repayments and interest due on these liabilities. At appraisal, an act to increase authorized capital to 12 billion pesos aimed at shoring up LRTA’s debts was under discussion in Congress.
In 2003, after the project was completed, LRTA’s long-term debt amounted to 11.8 billion and its profit margins were squeezed by interest payments amounting to P870 million and exchange losses totaling P2.75 billion. Further, no capital increase had occurred at evaluation because, while the act passed through the Lower House it was rejected by the Upper House, and LRTA remained crippled by debt.
The government of the Philippines injected subsidies of P830 million in fiscal 2002 and of P7.6 billion in fiscal 2003, in a measure that was designed to compensate for LRTA’s worsening profitability. Furthermore, the Department of Transportation and Communication, the supervisory agency, has indicated that, in view of the considerable role played by LRTA in alleviating traffic congestion in Metro Manila (i.e. the public nature of the authority), it is believed that the aforementioned capital expansion act failed to gain cabinet approval because ministers believed that government-backed bonds could be relied upon to cover LRTA’s debts. Although LRTA’s Farebox rate10 (see Table 5) has fallen against pre-project levels, it has been rising steadily in recent years and there are no specific problems in terms of the profitability of LRTA’s rail operations. As evidenced above, despite its excessive debt burden, LRTA appears to have secured financial sustainability.
10 The Farebox ratio = sales/operating costs (excluding depreciation costs). Board of Directors Director-Ge Boad Administration Division Legal Affairs/Personnel Dept General Affairs Dept Financial Affairs Division Accounting Dept Budget/Financial Planning Dept Asset Management Dept Planning Division Data Management Systems Dept Operations Division Operations Group Engineering Group P r iv at e-se c tor Con tr a c tors Operations Maintenance
Table 5. Financial Indicators (Unit: million pesos)
Year Sales Operating profit Net profit Farebox ratio
1994 789.7 183.0 ▲256.9 171%
2001 1,147.0 ▲168.4 ▲967.2 116%
2002 1,211.9 ▲111.2 ▲1,529.3 121%
2003 1,256.7 ▲218.1 3,780.9 123%
Year Assets Liabilities Net worth
1994 6,373 7,305 ▲932
2001 18,692 23,593 ▲4,901
2002 26,522 33,399 ▲6,877
2003 40,081 41,576 ▲1,495
Source: LRTA
As of April 2005, the Lower House Railways Committee was in the process of re-examining the capital expansion act. Furthermore, LRTA has indicated its intention to expand non-rail operations (its real estate and advertising businesses) with a view to improving its profitability.
2.5.2 Current Operation and Maintenance Status
As already stated, inefficient spare parts procurement procedures led to problems in dealing promptly with train breakdowns. Checks on train operability performed during the field survey confirmed that one of the trains procured for this project was not operating due to breakdown. However, the Japan Bank for International Cooperation (JBIC) undertook a study in 2004 aimed at improving procurement procedures and it is anticipated that this train will resume normal operation in the near future.
3. Feedback
3.1 Lessons Learned None
3.2 Recommendations [To the Executing Agency]
LRTA’s financial status remains tight, and in order that this does not affect the sustainability of project effects, it is essential that LRTA continues in its efforts to improve its overall profit status by both raising the profitability of its rail operation and expanding its non-rail operations. A capital injection from the government of the Philippines by the passing of the capital expansion act will also be critical to improving the financial status of LRTA.
Comparison of Original and Actual Scope
Item Planned Actual (1) Outputs
1. Procurement of
rolling stock cars
32 cars: additional cars with identical spec to existing 2-car trains for each of the currently operable 32 trains
Capacity: 1,122 passengers/train
28 cars: 7 new 4-car trains
Capacity: 1,358 passengers/train
2. Upgrading of
existing facilities
・ Electrical equipment
・ Storage track
・ Electric overhead lines
・ Signaling/telecommunicatio
ns equipment
・ Station buildings/rolling stock cars depot
・ As planned ・ As planned ・ As planned ・ As planned ・ Platform extensions ・ Additional replacement of
ballast (paving stones)
3. Consulting services ・ Bidding assistance
・ Work management
・ Technical assistance for
O&M (Foreign consultants: 65M/M; local consultants: 82M/M) ・ As planned ・ As planned ・ As planned (Foreign consultants: 81M/M, local consultants: 82.68M/M) (2) Project period Dec. 1994 – Dec. 1999 (61 months) Dec. 1994 – Mar. 2002 (88 months) (3) Project costs Foreign currency Local currency Total
ODA loan portion Exchange rate 9,795 million yen 644 million yen (171 million pesos) 10,439 million yen 9,795 million yen 1 peso = 3.76 yen (January 1994) 9,325 million yen 858 million yen (254 million pesos) 10,183 million yen 9,325 million yen 1 peso = 3.38 yen (1994-2002 average)