Simulating radiation damage in a bcc Fe system with
embedded yttria nanoparticles
Tomas Lazauskas, Steven D Kenny, Roger Smith
Department of Mathematical Sciences, Loughborough University, Leicestershire, LE11 3TU, UK
Gurpreet Nagra, Manan Dholakia, M.C. Valsakumar Materials Science Group, IGCAR, Kalpakkam-603 102, Tamil Nadu, India
Abstract
We present a molecular dynamics study of radiation damage arising from nuclear collisions close to embedded yttria nanoparticles in a bcc Fe matrix. The model assumes a perfect body-centred cubic (bcc) iron matrix in which yttria nanoparticles are embedded as a simplified model of an Oxide Dis-persion Strengthened steel. It is shown how the nanoparticles interact with nearby initiated collision cascades, through cascade blocking and absorbing energy. Fe defects accumulate at the interface both directly from the ballistic collisions and also by attraction of defects generated close by. The nanopar-ticles generally remain intact during a radiation event and release absorbed energy over times longer than the ballistic phase of the collision cascade.
Keywords: Oxide Dispersion Strengthened Steel, Radiation damage, Molecular Dynamics, Yttria, Nanoparticle
1. Introduction
Over recent years oxide dispersion strengthened (ODS) steels have drawn attention of scientists around the world as a potential material for the next-generation fusion and future fission reactors. They have excellent structural and chemical stability at high temperature and in chemically reactive
ronments, high creep resistance and are relatively stable under intense neu-tron radiation. This means that they have potential for an extended service time compared to existing materials in severe radiation conditions [1, 2, 3, 4]. Although there has been a number of experimental studies performed to investigate ODS steel’s performance under irradiation [4], the processes that are responsible for the radiation resistant properties and the role of the em-bedded nanoparticles are still unclear. This paper is focussed on identifying such processes by performing a Molecular Dynamics (MD) study on simpli-fied model of an ODS system, i.e. an yttria nanoparticle embedded in an Fe matrix.
2. Method
Collision cascade studies involve imparting energy to an atom in the sys-tem, called the primary knock-on atom (PKA) and investigating the defect production mechanisms over the ballistic phase of the cascade. An energetic neutron can impart 10’s of keV of energy to such a PKA but studies have shown [5] that the defect structures that remain at the end of the cascade are often quite similar in form independent of the PKA energy in the nu-clear energy transfer regime. In oxides the cascades can branch producing sub-cascades that form the same residual defects [6]. In metals where a vacancy-rich core around the PKA is produced together with well-separated interstitial clusters, it is only the size and number of the vacancy clusters and the interstitial loops that vary with energy [7]. The basic form of the induced radiation damage remains the same, even though interstitial loops and vacancy clusters grow bigger as the cascade energy increases. For this investigation we therefore concentrate our study mainly on obtaining good statistics from 1 keV cascades by initiating a series of trajectories, directed over an irreducible symmetry zone in the perfect bcc lattice but with the PKA chosen at different positions with regard to the embedded nanoparti-cle, rather than investigate higher energy PKA’s. A few cascades at higher energies were also investigated but only qualitatively.
2.1. Potentials
All the interactions between different types of atoms are described using interatomic potentials. All potentials are splined to the ZBL [8] screened
Coulomb potential, for close particle separation, using a sixth order expo-nential polynomial. They are then smoothly truncated to zero at a distance
rcut−of f. The form of the pair potentials used is given in (eq. 1):
V (rij) = VZBL(rij), rij < ra, eC0+C1rij+C2r2ij+C3rij3+C4r4ij+C5r5ij, r a ≤rij ≤rb, VP ot.(rij), rb< rij < rcut,
VDamp.f unc.(rij), rcut≤rij ≤rcut-off,
0, rij ≥rcut-off,
(1)
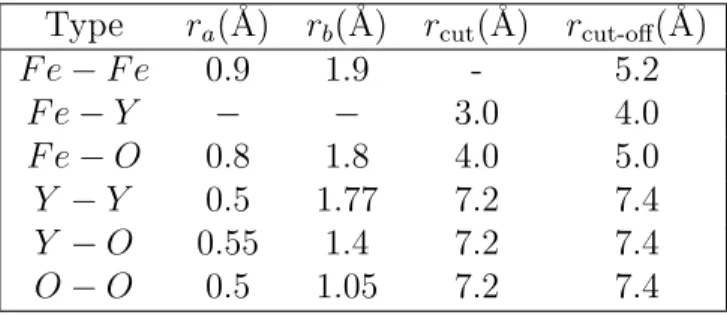
where rij is the atomic separation, C0 −C5 are splining constants, VP ot. and VDamp.f unc. are interatomic potentials and smooth damping functions respectively. The distances ra, rb, rcut, rcut-off are the active ranges for the
given expressions. All these values depend on the types of interacting atoms. Values for the constants are given in table 1. Splining constants were chosen to give a smooth join between VZBL and the sum of VP ot. and the Coulomb energy by making V (rij) and its first two derivatives continuous.
For theF e−F e interactions a Finnis-Sinclair-type potential formulated by Ackland was used [9] for VP ot.. Here VDamp.f unc. is not used, because the potential is intrinsically smoothed to zero at the cut-off. A weakly attractive Morse potential [10] is implemented to describe theF e−Ointeraction (VP ot.) with a well depth of De = 0.3 eV at re = 2.5 ˚A. These values were chosen to stabilise the yttria nanoparticle within the iron lattice by providing weak binding between theO andF eatoms. TheF e−Y, interactions are expressed only by the repulsive ZBL potential. In the case of Y −Y, a fixed charge Coulombic interaction was splined to the ZBL potential. Finally VP ot. for the Y −O, andO−O interactions was modelled by a standard Buckingham potential [11], combined with a fixed charge Coulomb interaction. TheY−O,
Y − Y and O −O parameters where obtained by fitting to the bixbyite crystal structure and are full charge, non-shell models taken from [12]. All the damping functions are sine and cosine in form. Table 2 gives the splining intervals and cut-off ranges for the interatomic potentials functions.
In our model, fixed charges are given only to the yttria nanoparticle’s atoms. We wish to exclude electrostatic interactions between nanoparticles, therefore, in order to gain functionality and speed in our simulations we used the Fennel approximation [13] to estimate long range electrostatic forces.
Type C0 C1 C2 C3 C4 C5 F e−F e 30.247 −92.533 142.350 −110.846 41.549 −6.007 F e−O 4.573 15.113 −38.907 35.795 −14.835 2.231 Y −Y 11.835 −10.445 4.965 −0.571 −0.091 −0.001 Y −O 16.644 −51.389 107.996 −118.968 61.950 −12.154 O−O −0.913 64.440 −209.567 295.900 −194.812 49.001
Table 1: Values of splining function constants. The units forCiare in ˚A
−i
.
Type ra(˚A) rb(˚A) rcut(˚A) rcut-off(˚A)
F e−F e 0.9 1.9 - 5.2 F e−Y − − 3.0 4.0 F e−O 0.8 1.8 4.0 5.0 Y −Y 0.5 1.77 7.2 7.4 Y −O 0.55 1.4 7.2 7.4 O−O 0.5 1.05 7.2 7.4
Table 2: Splining intervals and cut-off radii.
The Fennel approximation for these interactions is expressed as follows:
φel.(rij) = qiqj h erf c(αr) r − erf c(αRc) Rc + erf c(αRc) R2 c + 2α √ π exp(−α2R2 c) Rc (r−Rc) , r≤Rc (2)
where qi, qj are the charges of the interacting atoms and the cut-off value
Rc of 15 ˚A was chosen for our work. Such a cut-off range was chosen to ensure interaction only between the atoms within a given nanoparticle and not between neighbouring nanoparticles. The damping constant α = 0.15 ˚
A−1 was chosen to ensure smooth damping of the electrostatic interaction. This value was found to be the most appropriate after testing but is slightly lower than was suggested in the original paper (0.2−0.25 ˚A−1) and effectively extends the truncation region.
The set of chosen potentials were tested by checking if the the bixbyite structure, with a lattice constant equal to 10.604 ˚A, is stable at high tem-perature. This was done using a bulk yttria system, of 10,000 atoms, with periodic boundary conditions and heated to 500 K with the Coulomb forces evaluated using the Ewald method. Over a period of 20 ps, the lattice re-mained in the bixbyite structure.
2.2. Modelling the structure of the system
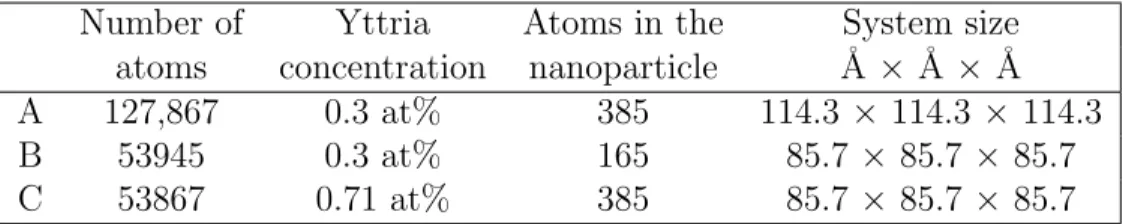
The systems used in the simulations (see table 3) consist of a body-centred cubic structured iron lattice with a stoichiometric yttria nanoparticle placed at the approximate centre of the system. The yttria nanoparticle is initially created outside the bcc iron simulation box as a sphere of a certain radius in the bixbyite crystal structure and then placed within the iron matrix by removing corresponding iron atoms. The lattice is then relaxed to ensure a stable local configuration using the damped MD technique [14]. An approx-imate yttria concentration of 0.3 at% was used in accordance with some of the experimental data from IGCAR [15]. The size of the systems A and B in the table 3 where chosen to keep the agreement with the observed concen-tration of yttria and to have nanoparticles that are most likely to be formed according to the same experimental data. System C was chosen to have a greater concentration of yttria in order to save computational time by using a smaller system.
Number of Yttria Atoms in the System size
atoms concentration nanoparticle ˚A × ˚A × ˚A
A 127,867 0.3 at% 385 114.3 ×114.3 × 114.3
B 53945 0.3 at% 165 85.7 × 85.7 × 85.7
C 53867 0.71 at% 385 85.7 × 85.7 × 85.7
Table 3: System sizes for the different models used in the simulations. All systems have a Y2O3 nanoparticle placed near the centre of the lattice.
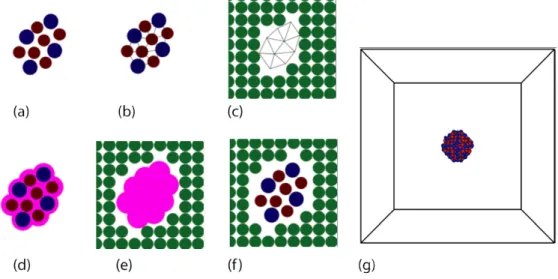
It was found that the best way to embed a nanoparticle was to use Delau-nay’s triangulation [16] method, implemented from the Python Visualisation ToolKit (VTK) library. This was used to remove all the iron atoms, whose position are overlapped by the triangulated surface within a specified radius around each yttria atom. A schematic illustration of the procedure is given in figure 1.
In order to estimate the gap size that should be left between the yttria particle and the iron atoms, a study of the Y2O3 cluster formation energy
(calculated using eq. 3) dependency on the void size was undertaken. Thus
ECsVm
f =Ec+ (m−s)Evac−NF eEF ebulk−NYEYbulk −NOEObulk, (3) where Ec represents the lattice energy with the yttria nanoparticle, Evac is the vacancy formation energy in a pure bcc iron lattice,NXEXbulk (where X =
Figure 1: A schematic illustration of the yttria positioning procedure in the Fe lattice. The steps are: (a) generate the yttria particle, (b) triangulate the yttria particle’s surface, (c) overlap the triangulated surface in the Fe system and remove the internal Fe atoms, (d) create surrounding surfaces around each yttria particle, (e) identify the overlapping Fe atoms, (g) remove the overlapping Fe atoms. The final figure (g) shows the nanoparticle embedded in the Fe matrix where only the atoms corresponding to the yttria nanoparticle are shown. The size of the simulation box is that given by system A in Table 1 so the box sides are 114 ˚A in length.
Fe, Y or O) is the number of atoms multiplied by the atom’s bulk energy, s
is the number of atoms in a cluster andm is the number of iron vacancies. It should be noted that with this methodology, the embedded nanoparticles are non-commensurate with the bcc Fe lattice but maintain their basic bixbyite cubic structure albeit with some distortion at the Fe interface. The structures were relaxed and the gaps with the minimum formation energy were chosen. The void size is determined from the radius by which iron atoms are removed around each atom from the nanoparticle as shown in figure 1. The study was carried out using 11 different sized yttria nanoparticles with the gap size (distance between the nearest particles in the cluster and the matrix before relaxation) varied from 0.6 ˚A to 2.4 ˚A. The value of 1.6 ˚A for the gap size was found to be optimal.
2.3. Simulating radiation damage with MD
To simulate the radiation damage cascade, a given energy was imparted to an Fe atom in the system, the primary knock-on atom (PKA). Energies of between 0.5 and 5 keV were chosen but with most statistics obtained for 1 keV cascades. Results in pure Fe have shown that irrespective of the PKA energy, the radiation damage after the collisional phase of the cascade consists of a vacancy rich region close to the initial PKA site surrounded by outlying interstitials, see e.g. [17, 18, 7]. The PKA energy determines the number of vacancies formed and the extent and size of the interstitial loops. These results depend only weakly on whether the temperature of the system is initially 0 K or room temperature so for purposes of direct comparison between trajectories in the pure Fe and the embedded nanoparticle case, all the simulations here were carried out on a system originally at 0 K. The Molecular Dynamics code employed is called LBOMD and was developed at Loughborough University and has been used in many radiation damage studies [19, 20].
The results depend strongly on the initial direction of the PKA and suf-ficient sampling should be done to obtain good statistics. In the embedded nanoparticle case, the situation is more complicated since the crystal sym-metry is broken. For a perfect bcc structured lattice the sampled region is constructed by picking a centering atom in a unit cell and dividing the cell with the symmetry planes. Then remaining region can be sampled over 66 different directions within the lattice from [1 0 0] to [1 1 0] and [1 1 1] with a step size of 0.1 in y and z coordinates. Despite the break in symmetry we use the same sampling process with directions chosen as shown in figure 2.
X Z PKA-1 PKA-2 PKA-3 PKA-4 PKA-6 PKA-7 PKA-8 PKA-5
Figure 2: (a) The bcc structure’s irreducible region; (b) The chosen PKA atoms for 1 keV simulations; (c) The irreducible region sampled by 66 directions starting from from [1 0 0] to [1 1 0] and [1 1 1], with a step size of 0.1 for y, z components. Cascades were initiated in these directions from the PKA’s shown in (b).
Most of our simulations were carried out with a 1 keV PKA energy and directed towards the nanoparticle. Eight sets of simulations were performed for System A from table 3, in which the distance of the PKA from the nanoparticle’s centre was varied between 16 ˚A and 57 ˚A in order to simulate various PKA distances and positions around yttria nanoparticle (Figure 2 (b)). These PKA atoms were chosen to give a representative sample of dif-ferent cases. For larger distances at 1 keV, the PKA’s energy is dispersed away from the embedded particle.
All simulations have periodic boundary conditions applied. To describe residual damage after a collision cascade, the system is investigated by com-paring its initial and final states. If an atom cannot be found within of 0.9 ˚
A radius of one of the original crystal positions, this atom’s original position is identified as a vacancy. If an atom has moved from its original position more than 0.9 ˚A and does not occupy any “free” atom position, it is iden-tified as interstitial. The value was chosen for visualisation purposes of the main interstitial point defect which is a dumbbell. In total more than 600 simulations were carried out to provide statistics.
3. Results
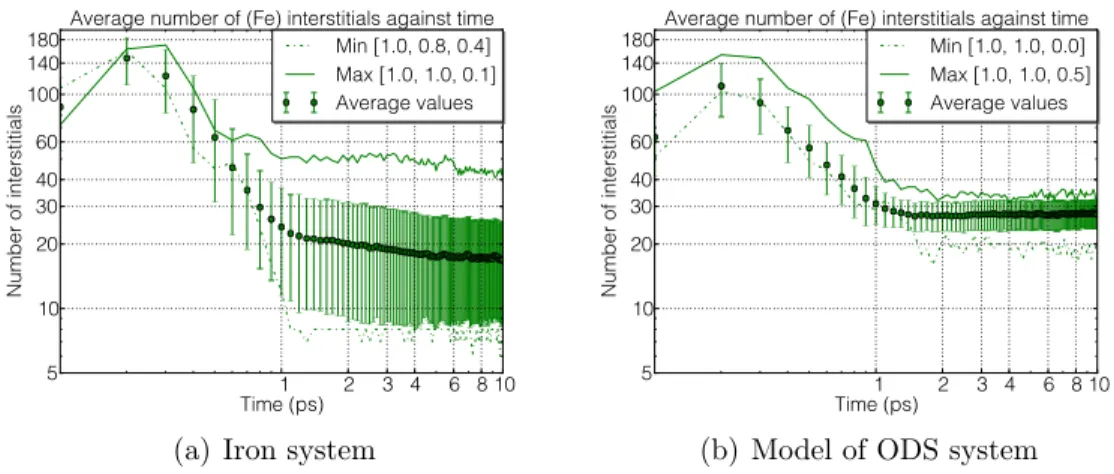
Fig. 3 shows the evolution of the number of iron interstitials in pure iron (a) and the model ODS (b) systems during the collision cascades. In the latter case, the PKA positions were varied as shown in Fig. 2 so the results are an average of the different PKA distances.
1 2 3 4 6 8 10 Time (ps) 5 10 20 30 40 60 100 140 180 Number of interstitials
Average number of (Fe) interstitials against time Min [1.0, 0.8, 0.4] Max [1.0, 1.0, 0.1] Average values
(a) Iron system
1 2 3 4 6 8 10 Time (ps) 5 10 20 30 40 60 100 140 180 Number of interstitials
Average number of (Fe) interstitials against time Min [1.0, 1.0, 0.0] Max [1.0, 1.0, 0.5] Average values
(b) Model of ODS system
Figure 3: Comparison of defect (iron interstitial) numbers sampled over 66 directions for 10 ps. Circles indicate average defect number in the system every 100 fs with 1 σerror bars.
Differences can be observed between these two cases. In both systems the peak defect numbers occur during the first two hundred femto-seconds (collisional phase) after which recombination processes take place.
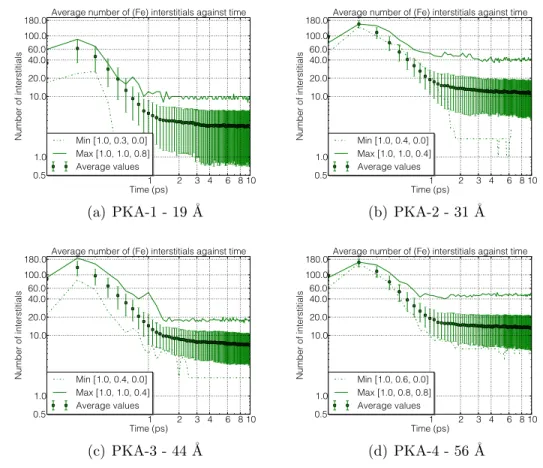
The average peak number of interstitials in the iron system is≈ 148 with standard deviation≈33 at 200 fs compared to≈110 and≈30 accordingly in the embedded nanoparticle system at the same time. Significant differences between the systems remain even after the recombination process. At the end of the simulation the average number of interstitials in the iron system is ≈ 18 with standard deviation ≈ 8, compared to 28 and 3 in the ODS system. This would appear at first sight to be contrary to the expectation that the nanoparticles would increase radiation tolerance and result in fewer defects. If however the interstitial defects located at the interface between the nanoparticle and the matrix are not counted as true defects, then the situation changes. In this case, the closer the PKA is initiated to yttria nanoparticle the lower the defect count (Fig. 4) compared to defect numbers in pure iron system (Fig. 3(a)) but as the PKA distance from the nanoparticle
increases, as expected the defect count approaches that for pure Fe; compare Fig. 4(d) and Fig. 3(a)).
1 2 3 4 6 8 10 Time (ps) 0.5 1.0 10.0 20.0 40.0 60.0 100.0 180.0 Number of interstitials
Average number of (Fe) interstitials against time
Min [1.0, 0.3, 0.0] Max [1.0, 1.0, 0.8] Average values (a) PKA-1 - 19 ˚A 1 2 3 4 6 8 10 Time (ps) 0.5 1.0 10.0 20.0 40.0 60.0 100.0 180.0 Number of interstitials
Average number of (Fe) interstitials against time
Min [1.0, 0.4, 0.0] Max [1.0, 1.0, 0.4] Average values (b) PKA-2 - 31 ˚A 1 2 3 4 6 8 10 Time (ps) 0.5 1.0 10.0 20.0 40.0 60.0 100.0 180.0 Number of interstitials
Average number of (Fe) interstitials against time
Min [1.0, 0.4, 0.0] Max [1.0, 1.0, 0.4] Average values (c) PKA-3 - 44 ˚A 1 2 3 4 6 8 10 Time (ps) 0.5 1.0 10.0 20.0 40.0 60.0 100.0 180.0 Number of interstitials
Average number of (Fe) interstitials against time
Min [1.0, 0.6, 0.0] Max [1.0, 0.8, 0.8] Average values
(d) PKA-4 - 56 ˚A
Figure 4: The number of interstitial defects in the model of ODS system after 1 keV collision cascades in 66 directions by choosing PKA atoms located at different distances from the centre of yttria nanoparticle, from 16 ˚A (a) to 57 ˚A (d).
We now examine in more detail the mechanisms by which the interstitials are formed at this interface and how the nanoparticle itself behaves when subjected to impact by energetic Fe particles.
3.1. Effect of the nanoparticle on the cascade
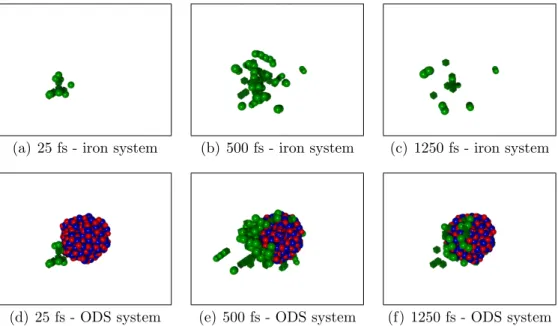
A common feature of the collision cascades is the ability of the yttria nanoparticle to prevent damage spread as illustrated in Fig. 5. In this ex-ample we compare two collision cascades by choosing a PKA at the same position in both systems and directing it in the [1 0.6 0.5] direction with 1
keV kinetic energy. Numbers in square brackets refer to the relative velocity components parallel to the coordinate axes, with the x-component normalised to 1. (Fig. 5 (a,b,c)) and (Fig. 5 (d,e,f)) represent systems of pure iron and ODS model accordingly.
(a) 25 fs - iron system (b) 500 fs - iron system (c) 1250 fs - iron system
(d) 25 fs - ODS system (e) 500 fs - ODS system (f) 1250 fs - ODS system
Figure 5: Snapshots of collision cascade evolution in the pure iron and the embedded nanoparticle systems for the initial same PKA direction at 1 keV. Yttrium is represented by blue spheres and oxygen by red spheres. Green spheres are Fe interstitials and green cubes are Fe vacancies. Fe atoms that remain on lattice sites are not shown.
In Fig. 5 only the Fe defects in the system and the atoms from the yttria particle are shown. At the very beginning of the cascade, both cases have a similar defect configuration (Fig. 5(a) and 5(d)) but there are differences after 500 fs and 1250 fs. In the ODS system the cascade is effectively blocked by the nanoparticle and almost every interstitial is located on the nanoparti-cle’s surface with a vacancy cluster at the origin of collision cascade. In the pure Fe case the cascade is more spread out. Although only one cascade is shown here, the result is typical of many of the different collision cascades that were analysed.
A key feature of the process is that Fe atoms can relocate to positions within the nanoparticle during the ballistic phase of the cascade if it has enough energy to penetrate the nanoparticle. However in all cases considered the Fe atoms were ultimately ejected from within the nanoparticle to reside
at the interface. This may be a feature of the potential description used since we have used a simplified model, whereas it is known that an Fe-Y-O system can attain a garnet structure. However to develop a variable charge model for the Fe-Y-O interactions that would capture this feature is beyond the scope of this paper. Thus defects at the interface can appear both by a direct blocking mechanism or by ejection of Fe interstitials from the nanoparticle.
These are not the only mechanisms by which defects form at the interface. Interstitial defects that form close to the particle can migrate there as it shown in Fig. 6. Here a dumbbell interstitial is initially formed less than 10 ˚
A from the particle but is attracted there in the later stages of the cascade. In this example the PKA atom was directed in the [1 0.2 0.0] direction with 1 keV kinetic energy. At the very beginning of simulation, the collision cascade spreads out next to yttria nanoparticle, as is shown in the snapshot at 500 fs in Fig. 6(a). After the ballistic phase of the cascade, defect com-binations can be identified (Fig. 6(b)). By following the evolution of two defects (numbered 1 - interstitial and 2 - dumbbell), it can be clearly seen in Fig. 6(c) that both defects move towards to yttria nanoparticle in the direc-tion [1 1 0] where after 4600 fs (Fig. 6(d)) both reside at the nanoparticle’s surface. Similar mechanisms were noticed in most of the simulations when interstitials occur in a region close to the yttria nanoparticle. By checking the distribution of interstitials around the yttria nanoparticle, the region be-tween 3.5−8.0 ˚A at the end of the simulations does not contain interstitials due to the recombination of defects and the defect attraction described in figure 6.
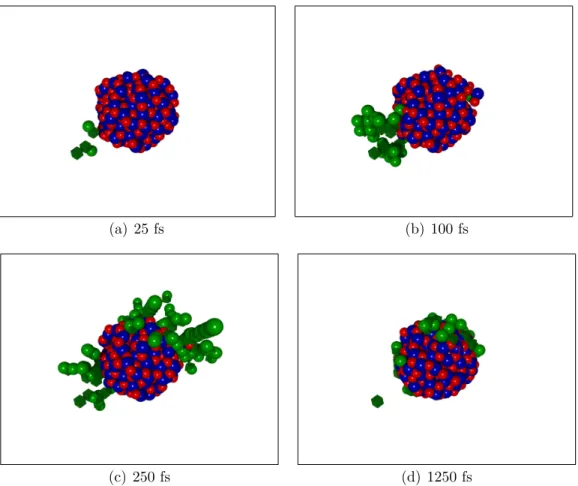
When a collision cascade is initiated next to an yttria nanoparticle not all Fe atoms are trapped inside and ejected. Moving Fe atoms can arrive with enough kinetic energy to pass through the nanoparticle and cause structural damage to the material on the other side as shown in Fig. 7.
In this example a semi-channelling direction, ([1 0.3 0.0]) was chosen from the same PKA position and the same initial kinetic energy as in the previous example. After 25 fs Fig. 7(a)), the iron atom still has approximately 700 eV of kinetic energy when entering the nanoparticle. It then passes through the yttria atoms and after 100 fs (Fig. 7(b)) leaves, retaining less than 100 eV of its kinetic energy. It then causes damage on the other side of the nanoparticle (Fig. 7(c)) and after recombination processes only defects accumulated around the surface of the nanoparticle remain.
In Fig. 8 we present statistics from the 66 target directions from a PKA situated 19 ˚A from the particle, by presenting the number of iron atoms
pass-(a) 500 fs 2 1 (b) 1200 fs 2 1 (c) 2200 fs 12 (d) 4600 fs
Figure 6: Snapshots of a 1 keV collision cascade showing defect attraction to the nanopar-ticle during the cascade relaxation process.
(a) 25 fs (b) 100 fs
(c) 250 fs (d) 1250 fs
Figure 7: Snapshots of collision cascade evolution near a nanoparticle when an Fe recoil passes through the nanoparticle
(a) The number of iron atoms passing through the nanoparticle according to initial PKA direction: black 0, red -1 (dark grey in b&w), yellow - 2 (light grey in b&w). 0 100 200 300 400 500 600 700 800 900 1000
Kinetic energy (eV)
Energy difference Energy on leaving
(b) Kinetic energies of iron atoms passing through the yttria nanoparticle: red - absorbed energy, black - remaing energy.
Figure 8: Analysis of number iron atoms passing through the yttria nanoparticle and their energies.
ing through the nanoparticle, (Fig. 8(a)) and the atom energies on entering and leaving (Fig. 8(b)). Black circles in Fig. 8(a) indicate the direction when the nanoparticle acted as ‘a wall’ and none of the iron atoms passed through; red circles indicate the direction with one iron atom passing through and yel-low - two iron atoms. The black bars in Fig. 8(b) represent the iron atom’s energy when it leaves the nanoparticle and the red bar is the energy absorbed by the nanoparticle. It can be seen that the nanoparticle can absorb up to 850 eV of energy without permanent displacement of atoms.
3.2. Effect of the cascade on the nanoparticle
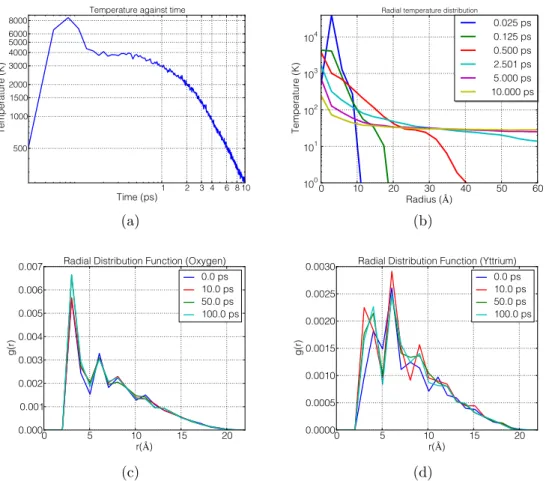
The effect of the cascade on the nanoparticle can be examined by plot-ting the kinetic energy of its constituent atoms as a function of time. For this purpose it is useful to convert their kinetic energy into an effective tem-perature T and plot T against time as shown in Fig. 9. It is clearly seen that much of the kinetic energy from the collision cascade is absorbed by the atoms in the nanoparticle. However Fig. 5 shows that none of the atoms in the nanoparticle were displaced into the Fe matrix. This was a feature of all the 1 keV cascades and is consistent with calculations of collision cascades in
ceramic materials which have a much higher displacement threshold energy than in metals [20]. 1 2 3 4 6 8 10 Time (ps) 500 1000 1500 2000 3000 4000 5000 6000 8000 Temperature (K)
Temperature against time
(a) 0 10 20 30 40 50 60 Radius ( ) 100 101 102 103 104 Temperature (K)
Radial temperature distribution
0.025 ps 0.125 ps 0.500 ps 2.501 ps 5.000 ps 10.000 ps (b) 0 5 10 15 20 r( ) 0.000 0.001 0.002 0.003 0.004 0.005 0.006 0.007 g(r)
Radial Distribution Function (Oxygen) 0.0 ps 10.0 ps 50.0 ps 100.0 ps (c) 0 5 10 15 20 r( ) 0.0000 0.0005 0.0010 0.0015 0.0020 0.0025 0.0030 g(r)
Radial Distribution Function (Yttrium) 0.0 ps 10.0 ps 50.0 ps 100.0 ps
(d)
Figure 9: (a) - The effective temperature evolution of the atoms comprising the yttria nanoparticle calculated from their kinetic energy, (b) - the temperature evolution of the Fe matrix atoms measured from the nanoparticle’s surface, (c-d) - the radial distribution function of the oxygen and yttrium atoms as a function of time.
Fig. 9 (a) illustrates an important feature of the collisional process. After the initial temperature peak, energy is gradually released into the system and the nanoparticle temperature equilibrates with its surroundings over a longer time scale than that for which the collision cascade is modelled, which is terminated when the defect numbers become stabilised. By calculating the temperature of atoms within a certain radius of the nanoparticle we can follow its evolution. Fig. 9 (b) shows the gradual diffusion of the
nanopar-ticle’s absorbed energy as a function of time. This suggests a mechanism by which the radiation damage can be reduced. The nanoparticle absorbs kinetic energy which would otherwise be used in the production of Fe de-fects and by releasing the energy more slowly over a longer time scale it is then converted into atomic vibrations rather than permanent displacements. Thus the region close to the nanoparticle remains ‘hot’ after the cascade has begun to subside which allows for higher mobility of the defects in this re-gion. Figs. 9 (c-d) show how the radial distribution function for the atoms within the nanoparticle [21] typically changes after irradiation. Initially (at 0.0 ps) the atoms in the nanoparticle have a mainly cubic form. After irra-diation (at 10.0 ps) the features in the radial distribution function does not change significantly according to oxygen plot, but a shift to the left can be seen in yttrium case. We have continued some of the simulations to 100.0 ps and as can be seen in fig. 9 (c-d). Whereas the O distribution does not change in time there is a shift in the yttrium at 10 and 50 ps but after 100 ps, the distribution is very similar to the initial distribution. Experimentally a shift of yttrium atoms from their exact projected positions [22] has been observed. This aspect will be further investigated with larger nanoparticles in the future.
3.3. Other PKA energies and nanoparticle sizes
Some simulations were also carried out for different PKA energies and different nanoparticle sizes for qualitative comparison with fewer trajectories and therefore poorer statistics. Similar processes to those found for 1 keV were observed. By simulating collision cascades in systems B and C (ta-ble 3) and comparing the results, where the PKA energy was varied from 0.5 keV up to 5 keV, an increase of defect numbers in the system with larger nanoparticles was observed with defects again accumulating on the larger nanoparticle’s surface.
In the 1 keV simulations yttria nanoparticles have shown good resistance to radiation damage, remaining mainly intact and such a tendency is also the case with the higher energy collision cascades. Only few atoms are ejected from the nanoparticle following head on collisions at high energy. Such an example is shown in figure 10 for a 5 keV PKA that was initiated close to the yttria nanoparticle’s surface. In this case a single O atom was ejected from the nano-cluster which also creates residual damage along it’s trajectory in the Fe lattice. This is consistent with preliminary MD results from the group at IGCAR in pure Y2O3showing that it is much easier to displace atoms from
5keV PKA
(a) Before a collision with the nano-particle
O recoil
PKA
(b) After a collision with the nano-particle
Figure 10: A 5 keV collision cascade simulation with the PKA initiated close to the nanoparticle.
the oxygen sub-lattice. However in our case most 5 keV trajectories initiated in the Fe region failed to dislodge atoms from the embedded yttria particle into the Fe matrix with the nanoparticle absorbing most of the collisional energy.
4. Conclusions
We have applied MD collision cascade simulations to determine the influ-ence of yttria nanoparticles embedded in bcc Fe on irradiation. The chosen potentials were tested separately in a bulk yttria system to confirm that the bixbyite crystal structure was stable at higher temperatures. For the small nanoparticles considered here, the structure embedded in the Fe lattice is not commensurate with the bcc lattice and there is relaxation away from the perfect bixbyite structure at the interface. There is some experimental evidence that larger nanoparticles do form a commensurate structure with the Fe lattice so an improvement to the interaction potentials used here, by for example, using a variable charge methodology should be a future prior-ity. Results from the simulations have shown how the cascades interact with yttria nanoparticles. Different behaviour and processes can be seen: When a collision occurs in an yttria-free region, the irradiation is, as expected, sim-ilar to that observed in a pure bcc iron system but when initiated close to a nanoparticle, the particle can act as a block to the propagation of a colli-sion cascade. In this case energy can be ‘transferred’ to the yttria particle,
so instead of creating residual defects in the Fe lattice structure, energy is absorbed by the yttria nanoparticle and gradually released through atomic vibrations over longer time-scales then the MD simulation. There is a par-tial amorphisation of the nanoparticle structure during this process but after large times the nanoparticle structure is similar to that before irradiation. Fe defect attraction to the nanoparticle interface can also occur, thus lowering the number of residual defects in the bulk crystal structure.
Preliminary results for higher energy PKAs (5 keV) show that only in the event of a near head-on collision with an incoming energetic Fe atom, does the ejection of an O atom from the cluster occur. The results give therefore some hint that the ODS materials might be more radiation resistant that the pure metal with further investigations in an attempt to quantify this hypothesis, currently in progress.
Acknowledgements
The work was funded by EPSRC grant EP/I012400/1 with Chris Grovenor of Oxford University as lead investigator. Thanks go to him and Dr C. S. Sundar of IGCAR for useful comments and discussions.
[1] G. Odette, M. Alinger, B. Wirth, Annual Review of Materials Research 38 (2008) 471–503.
[2] R. L. Klueh, P. J. Maziasz, I. S. Kim, L. Heatherly, D. T. Hoelzer, N. Hashimoto, E. A. Kenik, K. Miyahara, Journal of Nuclear Materials 307-311 (2002) 773–777.
[3] S. Ukai, M. Fujiwara, Journal of Nuclear Materials 307-311 (2002) 749– 757.
[4] V. Sagaradze, V. Shalaev, V. Arbuzov, B. Goshchitskii, Y. Tian, W. Qun, S. Jiguang, Journal of Nuclear Materials 295 (2001) 265–272. [5] R. Stoller, Journal of Nuclear Materials 276 (2000) 22–32.
[6] B. Uberuaga, R. Smith, A. Cleave, G. Henkelman, R. Grimes, A. Voter, K. Sickafus, Physical Review B 71 (2005) 1–12.
[7] C. Becquart, C. Domain, J. van Duysen, J. Raulot, Journal of Nuclear Materials 294 (2001) 274–287.
[8] J. Ziegler, J. Biersack, U. Littmark, Pergamon Press, New York (1985). [9] G. J. Ackland, D. J. Bacon, A. F. Calder, T. Harry, Philosophical
Mag-azine A 75 (1997) 713–732.
[10] P. M. Morse, Physical Review 34 (1929) 57–64.
[11] G. Lewis, C. R. A. Catlow, Journal of Physics C: Solid State Physic 18 (1985) 1149–1161.
[12] C. R. A. Catlow, Proceedings of the Royal Society A: Mathematical, Physical and Engineering Sciences 353 (1977) 533–561.
[13] C. J. Fennell, J. D. Gezelter, The Journal of chemical physics 124 (2006) 234104.
[14] M. Jakas, D. H. Jr, Physical Review B 30 (1984) 3573–3574.
[15] C. Sundar, Private Communication at Indo-UK Civil Nuclear Collabo-ration Review Meeting, Mamallapuram, India: Characterization of the Small-scale Structure of the Yttria-based Particles in ODS, March 6-9, 2011.
[16] W. Schroeder, K. Martin, B. Lorensen, The Visualization Toolkit: An Object-oriented Approach to 3D Graphics., Kitware, Inc., New York, 4 edition, 2006.
[17] A. B. Calder, Journal of Nuclear Materials 207 (1993) 25–45.
[18] D. Bacon, Y. Osetsky, R. Stoller, R. Voskoboinikov, Journal of Nuclear Materials 323 (2003) 152–162.
[19] C. F. Sanz-Navarro, S. D. Kenny, A. R. Porter, S. M. Pickles, in: Proc. UK e-Science All Hands Meeting, Nottingham, UKham, UK, available from http://www.allhands.org.uk/2004/proceedings/papers/107.pdf, 2004.
[20] L. Kittiratanawasin, R. Smith, B. Uberuaga, K. Sickafus, Nuclear In-struments and Methods in Physics Research Section B: Beam Interac-tions with Materials and Atoms 268 (2010) 2901–2906.
[21] D. E. J. Harrison, R. d. J. Rodriguez, R. Smith, Journal of Physics: Condensed Matter 1 (1989) 7113–7122.