Runtime Monitoring for
Dependable Hardware Design
Zur Erlangung des akademischen Grades eines
Doktors der Ingenieurwissenschaften
von der KIT-Fakult¨at f¨ur Informatik des Karlsruher Instituts f¨ur Technologie (KIT)
genehmigte
Dissertation
von
Arunkumar Vijayan
aus Pandalam, IndiaTag der m¨undlichen Pr¨ufung: 06.06.2019
Erster Gutachter: Prof. Dr. Mehdi B. Tahoori, KIT
First of all, I would like to express my immense gratitude to my advisor Prof. Mehdi Tahoori for his relentless support throughout my PhD. His guidance helped me in overcoming several obstacles in my research. In addition, I am extremely grateful to my co-advisor Prof. Krish-nendu Chakrabarty in supporting me throughout my research with guidance and motivation. I would like to thank all of my colleagues in the Chair of Dependable Nano Computing at Karlsruhe Institute of Technology for their technical as well as personal support. I especially thank Dr. Saman Kiamehr for his invaluable support as a friend and a mentor. I would also like to thank Dr. Fabian Oboril, Dr. Mojtaba Ebrahimi and Dr. Farshad Firouzi for their contributions to my research and for the numerous technical discussions we had.
Words cannot express my thankfulness to my wonderful colleagues Sarath Mohanachandran, Dr. Mohammad Saber Golanbari, Dr. Anteneh Gebregiorgis, Dr. Rajendra Bishnoi and Samir Ben Dodo who were with me almost throughout my journey with their continuous support in personal and professional life.
I would also like to thank Ms. Iris Schroeder-Piepka for her friendly support and also for handling all the required documents during the entire PhD. Along with that, I thank Ms. Audrey Bohlinger who helped a lot with the paperwork in the final months of my PhD.
Nothing would have been possible without the love and support of three special people in my life; my mother Geetha, my father Vijayan and my wife Amitha. I am indebted to them for the sacrifices they have made to see me achieve this goal.
Kleinbachstr. 19a 76227 Karlsruhe
Hiermit erkl¨are ich an Eides statt, dass ich die von mir vorgelegte Arbeit selbstst¨andig verfasst habe, dass ich die verwendeten Quellen, Internet-Quellen und Hilfsmittel vollst¨andig angegeben haben und dass ich die Stellen der Arbeit - einschließlich Tabellen, Karten und Abbildungen - die anderen Werken oder dem Internet im Wortlaut oder dem Sinn nach entnommen sind, auf jeden Fall unter Angabe der Quelle als Entlehnung kenntlich gemacht habe.
Karlsruhe, April 2019 Arunkumar Vijayan
With technology scaling advancement and globalization of integrated circuit (IC) manufac-turing, a host of vulnerabilities affect dependability of computing hardware. Each integrated circuit chip is born with a unique personality due to process variations and grows uniquely due to operating conditions, workload and environment. Hence, design-time solutions for depend-ability, based on deterministic models, are no longer sufficient for ICs fabricated at nanoscale technology nodes. There is a need for runtime analysis of the state of a system and adoption of appropriate mitigation actions to ensure dependability.
Transistors are prone to workload-dependent aging phenomena that increase delay in circuit paths leading to false computations. In addition, specific workloads can induce accelerated aging leading to reduction in reliable lifetime of a chip. Apart from aging, transient compu-tational errors (soft errors) can be caused by chip exposure to radiations that can result in abnormal behavior in critical systems. The propagation or masking of such errors is dependent on the workload executed on the system. Fabricated chips can also include malicious circuits called hardware Trojans, deliberately inserted during chip design or manufacture, that can compromise security. Due to the stealthy nature of inserted malicious circuits before their activation, it is extremely difficult to verify the chip as Trojan-free.
The complexity of these dependability issues makes simple dependability modeling and mitigation inefficient. This complexity arises from various sources including design (technology, device, circuit and architecture) parameters, fabrication parameters, runtime workload and environment. This is the motivation to explore machine learning and runtime methods that can potentially deal with such complexities.
In this thesis, we propose solutions to ensure dependable operation of computing hardware under different workload and environmental conditions. We devise machine learning techniques to model, monitor and mitigate various dependability effects. Different learning methods are used to identify low cost workload observables and to build prediction models that correlate the workload observables with dependability metrics corresponding to reliability and security attributes. We also developed low cost hardware monitoring circuits that can capture the workload observables during runtime with lower area and power overheads. In contrast to the state-of-the-art techniques exploiting micro-architectural observables for monitoring, we explore the potential of workload characterization at logic level of hardware abstraction. We identify better logic level features to enable fine-grained runtime monitoring. This logic-level analysis also comes with several knobs to tune for higher prediction accuracy and lower over-heads.
We experimented this philosophy of identifying logic-level observables based on learning methods and implementing low cost monitors to enable adaptive mitigation of static aging, dynamic aging, radiation-induced soft errors and also to identify the activation of hardware Trojans. In this regard, we developed a prediction model to track the workload impact on aging degradation of a chip that can be used on-the-fly to decide upon mitigation techniques such as task migration, dynamic voltage and frequency scaling. This prediction model is implemented in software that potentially ranks workloads based on their aging stress severity. To ensure resilience against accelerated aging effect, we propose a monitoring hardware that monitors a subset of critical flip-flops for an accelerated aging phase of the workload and raise a flag when a timing-critical path experiences severe aging stress. We implemented a technique to
relax the stress by the execution of a specific subroutine that exercises the critically stressed timing paths. We propose a technique to estimate the online soft-error vulnerability of memory arrays and logic cores based on the monitoring of a small set of flip-flops in the design. We also developed a method based on anomaly detection to identify workload signatures of hardware Trojan payload during runtime activation of a Trojan as a last line of defense. Based on these experiments, this thesis demonstrates the potential of advanced feature extraction at logic-level of abstraction and learning-based prediction based on runtime data to achieve better dependability for hardware designs.
Mit dem Voranschreiten der Technologieskalierung und der Globalisierung der Produktion von integrierten Schaltkreisen er¨offnen sich eine F¨ulle von Schwachstellen bez¨uglich der Verl¨asslichkeit von Computerhardware. Jeder Mikrochip wird aufgrund von Produktionss-chwankungen mit einem einzigartigen Charakter geboren, welcher sich durch seine Arbeitsbe-dingungen, Belastung und Umgebung in individueller Weise entwickelt. Daher sind determin-istische Modelle, welche zur Entwurfszeit die Verl¨asslichkeit prognostizieren, nicht mehr aus-reichend um Integrierte Schaltkreise mit Nanometertechnologie sinnvoll abbilden zu k¨onnen. Der Bedarf einer Laufzeitanalyse des Zustandes steigt und mit ihm die notwendigen Maß-nahmen zum Erhalt der Zuverl¨assigkeit. Transistoren sind anf¨allig f¨ur auslastungsbedingte Alterung, die die Laufzeit der Schaltung erh¨oht und mit ihr die M¨oglichkeit einer Fehlberech-nung. Hinzu kommen spezielle Abl¨aufe die das schnelle Altern des Chips bef¨ordern und somit seine zuverl¨assige Lebenszeit reduzieren. Zus¨atzlich k¨onnen strahlungsbedingte Laufzeitfehler (Soft-Errors) des Chips abnormales Verhalten kritischer Systeme verursachen. Sowohl das Ausbreiten als auch das Maskieren dieser Fehler wiederum sind abh¨angig von der Arbeit-slast des Systems. Fabrizierten Chips k¨onnen ebenfalls vors¨atzlich w¨ahrend der Produktion boshafte Schaltungen, sogenannte Hardwaretrojaner, hinzugef¨ugt werden. Dies kompromit-tiert die Sicherheit des Chips. Da diese Art der Manipulation vor ihrer Aktivierung kaum zu erfassen ist, ist der Nachweis von Trojanern auf einem Chip direkt nach der Produktion extrem schwierig.
Die Komplexit¨at dieser Verl¨asslichkeitsprobleme machen ein einfaches Modellieren der Zu-verl¨assigkeit und Gegenmaßnahmen ineffizient. Sie entsteht aufgrund verschiedener Quellen, eingeschlossen der Entwicklungsparameter (Technologie, Ger¨at, Schaltung und Architektur), der Herstellungsparameter, der Laufzeitauslastung und der Arbeitsumgebung. Dies motiviert das Erforschen von maschinellem Lernen und Laufzeitmethoden, welche potentiell mit dieser Komplexit¨at arbeiten k¨onnen.
In dieser Arbeit stellen wir L¨osungen vor, die in der Lage sind, eine verl¨assliche Ausf¨uhrung von Computerhardware mit unterschiedlichem Laufzeitverhalten und Arbeitsbedingungen zu gew¨ahrleisten. Wir entwickelten Techniken des maschinellen Lernens um verschiedene Zu-verl¨assigkeitseffekte zu modellieren, zu ¨uberwachen und auszugleichen. Verschiedene Lern-methoden werden genutzt, um g¨unstige ¨Uberwachungspunkte zur Kontrolle der Arbeitsbe-lastung zu finden. Diese werden zusammen mit Zuverl¨assigkeitsmetriken, aufbauend auf Ausfallsicherheit und generellen Sicherheitsattributen, zum Erstellen von Vorhersagemod-ellen genutzt. Des Weiteren pr¨asentieren wir eine kosten-optimierte Hardwaremonitorschal-tung, welche die ¨Uberwachungspunkte zur Laufzeit auswertet. Im Gegensatz zum aktuellen Stand der Technik, welcher mikroarchitektonische ¨Uberwachungspunkte ausnutzt, evaluieren wir das Potential von Arbeitsbelastungscharakteristiken auf der Logikebene der zugrun-deliegenden Hardware. Wir identifizieren verbesserte Features auf Logikebene um feingran-ulare Laufzeit¨uberwachung zu erm¨oglichen. Diese Logikanalyse wiederum hat verschiedene Stellschrauben um auf h¨ohere Genauigkeit und niedrigeren Overhead zu optimieren.
Wir untersuchten die Philosophie, ¨Uberwachungspunkte auf Logikebene mit Hilfe von Lern-methoden zu identifizieren und g¨unstigen Monitore zu implementieren um eine adaptive Vor-beugung gegen statisches Altern, dynamisches Altern und strahlungsinduzierte Soft-Errors zu schaffen und zus¨atzlich die Aktivierung von Hardwaretrojanern zu erkennen.
Diesbez¨uglich haben wir ein Vorhersagemodell entworfen, welches den Arbeitslasteinfluss auf alterungsbedingte Verschlechterungen des Chips mitverfolgt und dazu genutzt werden kann, dynamisch zur Laufzeit vorbeugende Techniken, wie Task-Mitigation, Spannungs- und Frequenzskalierung zu benutzen.
Dieses Vorhersagemodell wurde in Software implementiert, welche verschiedene Arbeit-slasten aufgrund ihrer Alterungswirkung einordnet. Um die Widerstandsf¨ahigkeit gegen¨uber beschleunigter Alterung sicherzustellen, stellen wir eine ¨Uberwachungshardware vor, welche einen Teil der kritischen Flip-Flops beaufsichtigt, nach beschleunigter Alterung Ausschau h¨alt und davor warnt, wenn ein zeitkritischer Pfad unter starker Alterungsbelastung steht. Wir geben die Implementierung einer Technik zum Reduzieren der durch das Ausf¨uhren spezifis-cher Subroutinen auftretenden Belastung von zeitkritischen Pfaden. Zus¨atzlich schlagen wir eine Technik zur Absch¨atzung von online Soft-Error-Schwachstellen von Speicherarrays und Logikkernen vor, welche auf der ¨Uberwachung einer kleinen Gruppe Flip-Flops des Entwurfs basiert.
Des Weiteren haben wir eine Methode basierend auf Anomalieerkennung entwickelt, um Arbeitslastsignaturen von Hardwaretrojanern w¨ahrend deren Aktivierung zur Laufzeit zu erkennen und somit eine letzte Verteidigungslinie zu bilden. Basierend auf diesen Experi-menten demonstriert diese Arbeit das Potential von fortgeschrittener Feature-Extraktion auf Logikebene und lernbasierter Vorhersage basierend auf Laufzeitdaten zur Verbesserung der Zuverl¨assigkeit von Harwareentw¨urfen.
Abstract viii
Kurzfassung x
Contents xiii
Glossary xvi
List of Figures xix
List of Tables xxi
List of own publications xxiv
1 Introduction 1
1.1 Problem statement and objective . . . 2
1.2 Contribution of this Thesis . . . 3
1.3 Outline . . . 5
2 Background 7 2.1 Dependability Challenges: Overview of Hardware Reliability and Security . . . 7
2.2 Reliability Challenges . . . 8
2.2.1 Circuit Aging . . . 8
2.2.2 Soft Error . . . 15
2.3 Security Challenges . . . 19
2.3.1 Hardware Trojans . . . 19
2.4 Machine Learning Basics . . . 22
2.4.1 Supervised Learning Techniques . . . 22
2.4.2 Unsupervised Learning Techniques . . . 25
2.4.3 Ensemble Techniques . . . 26
2.4.4 Feature Selection . . . 27
2.5 Summary . . . 27
3 Dynamic Aging Monitoring and Delay Prediction 29 3.1 Overview . . . 29
3.2 Introduction, Motivation and Contributions . . . 29
3.3 Related Work . . . 31
3.4 Proposed Methodology . . . 33
3.5 Offline Correlation Analysis and Prediction Model Generation . . . 33
3.5.1 Aging-Induced Delay Degradation and SP Extraction . . . 33
3.5.2 Predictor Training Using Support-Vector Machines . . . 35
3.5.3 Representative Flip-Flop Selection (Space Sampling) . . . 36
3.5.4 Time Complexity of Flip-Flop Selection Methods . . . 39
3.5.5 Time Sampling . . . 39
3.7 Experimental Results . . . 41
3.7.1 Experimental Setup . . . 42
3.7.2 SVM training and validation . . . 42
3.7.3 Evaluation of Prediction-Accuracy . . . 42
3.7.4 Validation of Time-Sampling Hardware Design . . . 44
3.7.5 Overheads . . . 44
3.8 Summary . . . 45
4 Static Aging Monitoring and Mitigation 47 4.1 Overview . . . 47
4.2 Introduction, motivation and contributions . . . 47
4.3 Related Work . . . 49
4.4 Proposed Methodology . . . 50
4.5 Offline Phase . . . 52
4.5.1 Offline characterization and correlation analysis . . . 52
4.5.2 Offline static aging mitigation analysis . . . 54
4.6 Online Phase . . . 59
4.6.1 Online Monitoring of Static Aging . . . 59
4.6.2 Online Mitigation of Static Aging . . . 60
4.7 Experimental Results . . . 62
4.7.1 Representative flip-flop selection . . . 64
4.7.2 Mitigation Measures . . . 65
4.7.3 Overheads . . . 65
4.7.4 Lifetime Enhancement . . . 66
4.8 Summary . . . 66
5 Soft-Error Vulnerability Prediction 67 5.1 Overview . . . 67
5.2 Introduction, motivation and contributions . . . 67
5.3 Related Work and Preliminaries . . . 69
5.4 Proposed Methodology . . . 71
5.5 Offline Correlation Analysis . . . 72
5.5.1 Vulnerability Factor Estimation . . . 73
5.5.2 Correlation-Based Flip-Flop Selection . . . 75
5.5.3 VF Predictor Training . . . 76
5.6 Run-time Vulnerability Prediction . . . 79
5.7 Experimental Results . . . 80
5.7.1 Experimental Setup . . . 80
5.7.2 Validation Experiments . . . 80
5.7.3 Classification Results . . . 81
5.7.4 Comparison with Related Work . . . 83
5.7.5 Overheads . . . 84
5.7.6 Optimization Prospects . . . 85
5.8 Summary . . . 86
6 Hardware Trojan Detection 87 6.1 Overview . . . 87
6.2 Introduction, motivation and contributions . . . 87
6.4 Proposed Methodology . . . 92
6.4.1 Offline Characterization and Construction of Anomaly-Detection Model 93 6.4.2 Online Monitoring and Incremental Prediction . . . 95
6.5 Experimental Results . . . 97
6.5.1 Experimental Setup . . . 98
6.5.2 Implementation of Different Trojans . . . 98
6.5.3 Trojan Detection Accuracy . . . 101
6.5.4 Representative Flip-flop Selection . . . 103
6.5.5 Overheads . . . 103
6.5.6 Limitations of the proposed approach . . . 104
6.6 Summary . . . 105
7 Conclusion 107 7.1 Summary and conclusion . . . 107
3PIP Thid-party Intellectual Property ACE Architecturally Correct Execution ATPG Automatic Test Pattern Generation BTI Bias Temperature Instability
CMOS Complementary Metal Oxide Semiconductor DVFS Dynamic Voltage and Frequency Scaling
FF flip flop
FIT Failure in Time
FPGA Field Programmable Gate Array GBM Gradient Boosting Machine HCI Hot Carrier Injection
ISA Instruction Set Architecture
LUT Look-Up-Tables
LVF Logic Vulnerability Factor MTTF Mean Time To Failure MVF Memory Vulnerability Factor
overfitting situation in which predictor model fits to noise in training data. RTL Register Transfer Level
SER Soft Error Rate
SoC System-on-Chip
SP Signal Probability
STA Static Timing Analysis SVM Support Vector Machines
VCD Value Change Dump
VF Vulnerability Factor
VLSI Very-Large-Scale Integration
workload Set of input patterns and states applied to a hardware design. workload observable Representative of the signal activity of a workload.
1.1 Illustration of complexity and performance increase with technology scaling
ad-vancement in microprocessors for the last four decades [1]. . . 1
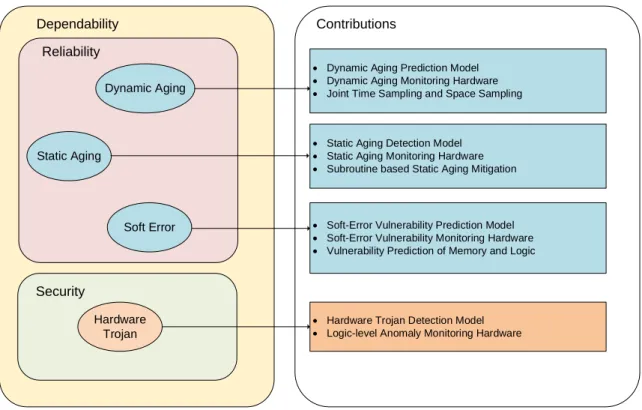
1.2 Overall contributions of this thesis in different attributes of dependability. . . 4
2.1 Illustration of the attributes of dependability in the scope of this thesis [8]. . . 7
2.2 Dependability threats and their causal relationship [8]. . . 7
2.3 NBTI Aging Models [36] . . . 8
2.4 Illustration of stress and recovery phases due to NBTI . . . 9
2.5 Comparison of ∆Vth due to D-BTI (duty cycle (α)=0.5) and S-BTI. . . 9
2.6 Illustration of an aged CMOS inverter (INV1) and the corresponding deviation in input-ouput characteristics in the form of an additional delay in the switching functionality. . . 11
2.7 Illustration of a timing violation and failure caused by an aging-induced delay increase in a timing path. . . 11
2.8 The dependence ofVth on signal probability (SP) [44] . . . 12
2.9 Razor flipflop deployed in a timing path to monitor the delay and restore the correct value in case of a timing error [22]. . . 13
2.10 Illustration of BTI monitoring by measuring the beat frequency between two ring oscillators with one of them under stress and the other used as a reference [45]. 13 2.11 Illustration of tunable replica circuits that can be tuned to match the delay of critical paths for monitoring [46]. . . 13
2.12 Representative critical reliability paths showing representation of critical paths with or without workload sampling [47]. . . 14
2.13 Illustration of the driving strength ((IDSp)) of two aging-stressed PMOS tran-sistors, one with and the other without adaptive body biasing [20]. . . 15
2.14 Illustration of the dependence of NBTI-induced threshold voltage degradation on supply voltage [19] . . . 15
2.15 Effect of alpha-particle strike on a transistor eventually leading to soft error. . 16
2.16 Illustration of logical masking or propagation of transient pulse from the input of a logic gate for different input combinations. . . 17
2.17 Illustration of electrical masking in the form of several stages of transient pulse attenuation. . . 18
2.18 Illustration of latching-window masking where the transient pulse reaches out-side the latching window of a flipflop. . . 18
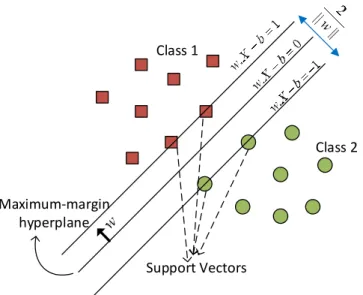
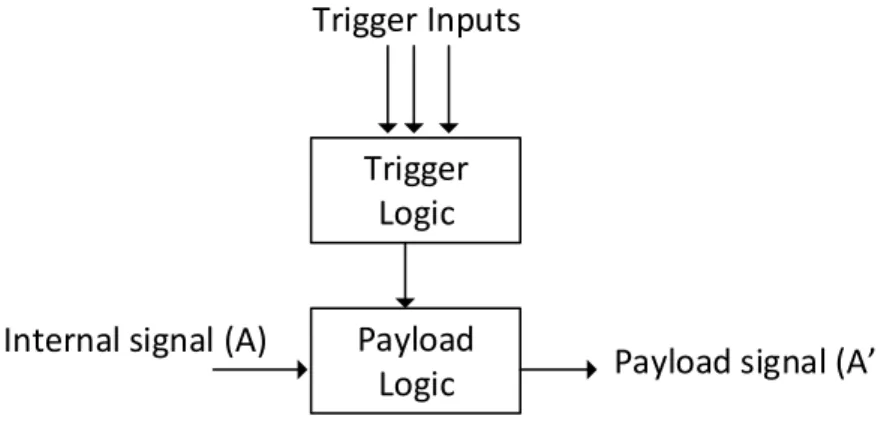
2.19 Illustration of a hardware Trojan architecture with a trigger logic and payload. 20 2.20 Hardware Trojan Taxonomy based on different characteristics of Trojans [61] . 21 2.21 Illustration of linear two-class classification with maximum-margin hyperplane in support vector machines. . . 23
2.22 Illustration of a decision tree demonstrating a two-class classification [66]. . . . 24
2.23 Illustration of information gain comparison between two attributes [66]. . . 25
2.24 Illustration of bagging technique. . . 26
3.1 The difference in ∆Dmin at different time points in the lifetime of a circuit. . . 32
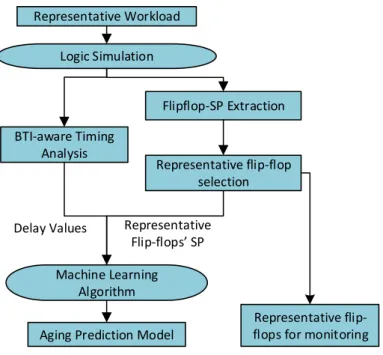
3.2 Flow-chart showing the steps involved in the offline characterization phase. . . 34
3.3 Illustration of the support-vector regression model. . . 35
3.4 Overall flow of space-sampling techniques to identify representative flip-flops. . 37
3.5 Fan-in cone characteristics of flip-flops. . . 38
3.6 Illustration of flip-flop SP monitoring methodology. . . 40
3.7 Results obtained using joint time-space sampling of flip-flops. . . 41
3.8 Timing simulation results for the time-sampling hardware. . . 44
4.1 Overview of the proposed technique. . . 51
4.2 Steps involved in the offline characterization phase. . . 52
4.3 Correlation analysis of flip-flops based on the overlap of concurrent SAPs. . . . 53
4.4 Flow chart showing the steps involved in ATPG-based subroutine generation . 55 4.5 Illustration of ATPG-based subroutine generation settings for mitigating static aging. . . 56
4.6 Flow chart showing the steps involved in functionality-based subroutine generation 58 4.7 Illustration of the online static aging monitoring hardware. . . 60
4.8 Illustration of switching event propagation from flip-flops under static aging to the logic gates under static aging in their forward fanout cone. . . 61
4.9 Illustration of static aging relaxation of the internal transistors of a master-slave flip-flop on subsequent switching events. . . 62
4.10 Results demonstrating the variation in percentage of (a) union of critical flip-flops of all workloads (UCF), and (b) representative flip-flip-flops (RFF), with the minimum duration of SAPs for Fabscalar and Leon3 processors. . . 64
5.1 The VF of the memory arrays and sequential logic blocks in Leon3 for three MiBench workloads (experimental setup described in Section 5.7). . . 70
5.2 Variation of instruction-cache MVF of Leon3 and SP of a selected flip-flop during MiBench workload execution. . . 72
5.3 Offline correlation analysis and prediction model generation. . . 73
5.4 Illustration of ACE and un-ACE intervals based on the read and write access patterns. . . 74
5.5 Flip-flop SEU due to particle strike and error propagation scenario in a timing path. . . 75
5.6 Illustration of two-class SVM classification. . . 77
5.7 Illustration of flip-flop SP monitoring methodology. . . 79
5.8 Comparison of accuracy scores (SA) of the proposed method with PCM (predic-tion based on performance counters as explained in Sec(predic-tion 5.7.4) for (a) Leon3, and (b) OR1200 memory arrays by varying number of monitored flip-flops (FF). 81 5.9 Confusion matrix showing predicted and true class labels for LVF prediction for the logic core of Leon3. The number of test samples corresponding to each VF class is overlayed on the matrix. . . 83
5.10 Variation in Weighted Accuracy Score (SW) for LVF prediction with the number of representative flip-flops selected for Leon3 and OR1200 logic cores. . . 84
5.11 Variation of prediction accuracy with workload-segment size (WS) for different hardware structures in Leon3. . . 85
5.12 Variation of overheads with workload-segment size for Leon3 processor. . . 86
6.1 Threat model showing stages of Trojan insertion and activation in SoC design flow along with the proposed detection technique. . . 89
6.2 Illustration of a Trojan attack scenario including manipulation of
architectural-level monitors to mask the attack. . . 90
6.3 Proposed flow showing offline characterization, prediction model construction and its online deployment. . . 93
6.4 Isolation properties of samples by random partitioning. . . 95
6.5 Illustration of a random decision tree for isolating samples. . . 97
6.6 Illustration of runtime monitoring hardware and anomaly detection . . . 98
6.7 Illustration of the shift in anomaly score when the NOP-insertion Trojan is activated during the execution of a susan smooth application in Leon3. . . 99
6.8 The confusion matrix showing the number of true and false predictions corre-sponding to two classes, (1) positive (Trojan activated) and negative (no Trojan activated). . . 102
6.9 Comparison of performances of different anomaly detection algorithms on Tro-jan detection. . . 103
6.10 The variation in prediction accuracy of Trojan activation in Leon3 with the number of flip-flops selected for monitoring. . . 104
3.1 Hypothetical training set with four data samples . . . 36
3.2 Step by step correlation of SPs to aging-induced circuit delay. . . 43
4.1 Functionality based flip-flop switching . . . 58
4.2 Examples for subroutine generation . . . 58
4.3 Representative flip-flop (FF) selection for different workloads for Leon3 and Fabscalar with Tsad min = 3 million cycles. . . 63
5.1 Hypothetical training set with five data samples . . . 76
6.1 Functionalities covered by selected Trojans and the corresponding Trojans im-plemented on different designs. . . 96
List of own publications included in this thesis
Transactions
[24] Vijayan, Arunkumar and Koneru, Abhishek and Kiamehr, Saman and Chakrabarty, Krishnendu and Tahoori, Mehdi B, “Fine-grained aging-induced delay prediction based on the monitoring of run-time stress,” inIEEE Transactions on Computer-Aided Design
of Integrated Circuits and Systems, 2018.
[27] Vijayan, Arunkumar and Kiamehr, Saman and Ebrahimi, Mojtaba and Chakrabarty, Krishnendu and Tahoori, Mehdi B, “Online Soft-Error Vulnerability Estimation for Memory Arrays and Logic Cores,” inIEEE Transactions on Computer-Aided Design of
Integrated Circuits and Systems, 2018.
[26] Vijayan, Arunkumar and Kiamehr, Saman and Oboril, Fabian and Chakrabarty, Krish-nendu and Tahoori, Mehdi B, “Workload-Aware Static Aging Monitoring and Mitiga-tion of Timing-Critical Flip-Flops,” in IEEE Transactions on Computer-Aided Design
of Integrated Circuits and Systems, 2018.
[29] Vijayan, Arunkumar and Tahoori, Mehdi B, and Chakrabarty, Krishnendu “Runtime Identification of Hardware Trojans by Feature Analysis on Gate-level Unstructured Data and Anomaly Detection ,”under ReviewinIEEE Transactions on Information,
Forensics and Security, 2019.
Conferences
[28] Vijayan, Arunkumar and Koneru, Abhishek and Ebrahimi, Mojtaba and Chakrabarty, Krishnendu and Tahoori, Mehdi B, “Online soft-error vulnerability estimation for mem-ory arrays,” in VLSI Test Symposium (VTS), 2016.
[25] Vijayan, Arunkumar and Kiamehr, Saman and Oboril, Fabian and Chakrabarty, Kr-ishnendu and Tahoori, Mehdi B, “Workload-aware static aging monitoring of timing-critical flip-flops.,” in Asia and South Pacific Design Automation Conference (ASP-DAC), 2017.
List of co-author publications not included in this thesis
Koneru, Abhishek, Arunkumar Vijayan, Krishnendu Chakrabarty, and Mehdi B. Tahoori. ”Fine-grained aging prediction based on the monitoring of run-time stress using DfT infrastructure.” In Proceedings of the IEEE/ACM International Conference
on Computer-Aided Design, pp. 51-58., 2015.
Tahoori, Mehdi B., Abhijit Chatterjee, Krishnendu Chakrabarty, Abhishek Koneru, Arunkumar Vijayan, and Debashis Banerjee. ”Self-awareness and self-learning for re-siliency in real-time systems.” In IEEE 21st International On-Line Testing Symposium
(IOLTS), pp. 128-131., 2015.
Firouzi, Farshad, Fangming Ye, Arunkumar Vijayan, Abhishek Koneru, Krishnendu Chakrabarty, and Mehdi B. Tahoori. ”Re-using BIST for circuit aging monitoring.” In
The past fifty years of semiconductor industry was an era of aggressive technology scaling reaching to sub-10 nm device sizes. The tremendous improvement in complexity (in terms of number of transistors) and performance (in terms of operating frequency) achieved for various microprocessor generations is illustrated in Fig. 1.1 [1]. According to Moore’s law, the number of transistors in a semiconductor chip doubles every 18 months due to technology scaling [2]. This enables chips with increasing complex functionality, higher performance and lower per-function cost for every new generation. For example, the central processor chip of IBM z14 processor contains 6.1 billion transistors [3] in contrast to less than a billion transistors in IBM z10 released a few years before z14 [4]. The average transistor cost reduced by 10×due to technology scaling from 130 nm node to 14 nm node [5]. Even the latest smartphones like iPhone XS can do 5 trillion operations per second in comparison to Cray 2, the fastest supercomputer of early 1990s, capable of only 1.9 billion operations per second [6]. As a result of the increase in performance and cost reduction in implementing complex functional-ities, semiconductor chips have revolutionized automotive, space, healthcare, multimedia and communication domains [7]. 0 1 10 100 1,000 10,000 100,000 1,000,000 10,000,000 100,000,000 1970 1980 1990 2000 2010 2020 Transistors (thousands) Frequency (MHz)
Figure 1.1: Illustration of complexity and performance increase with technology scaling advancement in microprocessors for the last four decades [1].
In the modern society, the ubiquity of semiconductor chips demands dependable operation for an expected lifetime. Dependability is defined as the ability to deliver trusted service [8].
With technology scaling advancement, many dependability challenges aggravate and hence, failure rate increases [9]. Smaller device sizes bring increasing variations between transistors during fabrication and also vulnerability to different environmental and runtime variations. The failure-free operation of a chip can be significantly affected by different reliability mech-anisms such as device aging or radiation-induced soft errors [10]. Device aging refers to a set of degradation mechanisms that affect transistor properties, eventually leading to unexpected failures in computation. Soft errors are caused by alpha particles from packaging materials or neutrons from cosmic rays that may strike a semiconductor chip, and temporarily induce a wrong value in a memory cell or a circuit node leading to system failures. In addition to these sources of unreliabilities, several security threats have emerged due to the increasing globaliza-tion of semiconductor design and fabricaglobaliza-tion stages [11]. Each step in the design of a complex system-on-chip (SoC) is vulnerable to security issues such as inclusion of stealthy malicious logic called hardware Trojans, by third-party vendors [12]. Because of the ever increasing com-plexity, the verification and test efforts fall short to ensure secure operation of chips. Hence, techniques to ensure dependability of hardware designs with reliability and security as the two most relevant attributes are attaining primary focus in today’s computing world.
The design-time solutions against reliability and security challenges in the context of de-pendable hardware design can be less efficient in the new era where chips are exposed to complex runtime variations. The rate of degradation of integrated circuits due to aging of transistors can significantly vary with the type of workload executed on them, the operat-ing temperature, and the variations in supply voltage [13]. The vulnerability of circuits to radiation-induced soft errors also varies with the workload nature, and other runtime param-eters [14]. The role of design decisions to ensure security in semiconductor chips is limited due to the threat of additional hardware inclusion at a later stage in the fabrication pro-cess [15]. Hence, in addition to design-time optimization of circuits for better reliable and secure operation, runtime monitoring is required to guide appropriate adaptation actions.
Cost-effective runtime monitoring can assist in tuning several knobs available to alleviate the impact of dependability issues. In modern-day systems, a large number of sensors and monitors are incorporated to track several runtime parameters such as power consumption and supply voltage [16]. With rising dependability requirements in various domains [17], there is a need for dependability monitors and models to make runtime decisions that can ensure dependable operation of a chip.
1.1 Problem statement and objective
Semiconductor chips, after fabrication, are utilized in different ways and are exposed to differ-ent set of runtime parameters. Hence, solutions for dependability problems cannot be static and needs to be adaptable against variations during lifetime operation of each chip. It is essential to use runtime data to make predictions on the status of various degradation and vulnerability parameters. Accurate prediction models are required in this regard which can guide adaptation actions in a proactive manner.
One of the transistor aging mechanisms known as Bias Temperature Instability (BTI) de-grades the threshold voltage of a transistor that eventually results in slower switching of logic gates made of these transistors [39]. Aging of transistors leads to degradation of circuit de-lays, eventually increasing the number of timing violations, and a decrease in the expected lifetime [18]. If the degradation rate can be tracked in a fine-grained manner, appropriate adaptation actions such as adaptive voltage scaling [19], body biasing [20] or reliability-aware task mapping [21] can be taken. In the case of radiation-induced soft errors, each phase of a workload executed on a design, such as a processor, can have a specific nature causing higher
or lower vulnerability towards soft error events measured in terms of vulnerability factor. Prediction of accurate vulnerability factor during runtime can enable cost-effective protection mechanisms. In the case of security threats, malicious hardware (hardware Trojans) can get activated during runtime, and the prediction of the Trojan activation serves as a last line of defense. With increasing complexity of systems, the runtime monitoring and prediction of these parameters meet several challenges. The generation of enormous amount of runtime data during workload execution on a hardware block necessitates careful spatial and temporal selection of probing points in the hardware block. Reuse of existing monitors cannot be always an effective solution due to the granularity of access and hence, new cost-efficient runtime mon-itors with less overheads are required. Predictions from the patterns in runtime data needs to be fast and accurate to enable proactive mitigation of dependability issues.
Modern systems incorporate a range of sensors and monitors (e.g., razor flip-flops [22], critical path monitors (CPM) [23]) to track the impact of several reliability mechanisms on the functionality and performance of a circuit. These reliability mechanisms include aging due to Bias Temperature Instability (BTI) [10] and supply voltage fluctuations. In addition, additional hardware is added in the form of redundant units or error correction units in order to tackle the impact of radiation- induced soft errors [10]. With these sensor data available online, suitable adaptation policies can be triggered on-the-fly that can help in resilient operation of a system. However, the fundamental problem of the above method lies in the fact that these sensors monitor the effect (e.g., path delay increase due to BTI) of a reliability phenomenon rather than its cause (nature of workload). Hence, the adaptation policies can only be triggered after a measurable degradation occurs on the circuit. In addition, to secure against activation of hardware Trojans, performance-monitor based detection techniques are deployed. However, these monitors can be tampered by an adversary. In short, dependability-aware selection of appropriate features to monitor runtime data and development of prediction models that can predict accurately from the selected features are the needs of the hour.
The objective of this thesis is to enable runtime predictions on different dependability mechanisms by logic-level data analysis, and by exploiting machine learning techniques for workload compaction and representation. Different learning methods are used to identify low cost workload observables, and to build prediction models that correlate the workload observables with reliability and security metrics.
1.2 Contribution of this Thesis
In this thesis, we target the improvement of overall dependability of integrated circuits by analyzing the impact of runtime variations on various reliability and security issues as illus-trated in Fig. 1.2. We devise machine learning techniques to model, monitor and mitigate various dependability effects originating from imperfections in device fabrication, design is-sues, and impact of runtime workload and environment. We target early runtime prediction of the impact of a workload phase on resilient operation of a circuit. This information about the impact of a workload phase can guide proper mitigation actions proactively such as relaxation of aging stress or tackling vulnerability of a circuit to soft errors. In this regard, these learn-ing techniques can be used to correlate workload patterns to correspondlearn-ing impact on system dependability under aging, soft errors and malicious Trojans. We propose a methodology to monitor hardware designs online, and predict dependability metric values on-the-fly based on prediction models constructed offline. Our technique involves workload analysis to extract hid-den information that describes the relationship between the workload executed on the design, and corresponding values of dependability metrics (Eg: circuit-path-delay increase).
the information content to use for reliability and security analysis. However, this increases the complexity of analysis and hence, we deploy domain-specific feature selection and feature en-gineering techniques to capture important features of a workload segment. In this regard, suitable workload observables are identified offline using correlation analysis and feature elim-ination techniques. A prediction model is built offline to correlate the workload observable with the dependability metric under consideration. Low cost hardware monitors are proposed to track the workload observables online and the monitoring information is fed to software predictors to make early predictions on the reliability and security metrics.
Dependability Reliability Security Static Aging Dynamic Aging Soft Error Hardware Trojan
Dynamic Aging Prediction Model
Dynamic Aging Monitoring Hardware
Joint Time Sampling and Space Sampling
Static Aging Detection Model
Static Aging Monitoring Hardware
Subroutine based Static Aging Mitigation
Soft-Error Vulnerability Prediction Model
Soft-Error Vulnerability Monitoring Hardware
Vulnerability Prediction of Memory and Logic
Hardware Trojan Detection Model
Logic-level Anomaly Monitoring Hardware
Contributions
Figure 1.2: Overall contributions of this thesis in different attributes of dependability. In particular, the novel contribution of this thesis are listed below.
Dynamic Aging Monitoring and Delay Prediction [24]: Dynamic aging of tran-sistors due to Bias Temperature Instability (BTI) involves aging stress and recovery phases resulting in long term degradation of circuit paths. This mechanism degrades path delay over time leading to timing failures. Direct monitoring of path delays based on actual measurements can only track a coarse-grained aging trend. We propose a fine-grained aging monitoring scheme based on estimating runtime aging stress of workloads. A prediction model generated offline based on workload stress analysis is implemented online with a low overhead monitoring hardware to make predictions on aging rates. As a result, we can achieve timely workload-stress estimations and aging rates during runtime that can be used in turn to take appropriate proactive and fine-grain mitigating actions and prevent the circuit from aging at higher rates.
Static Aging Monitoring and Mitigation [25, 26]: Circuits are exposed to accel-erated aging rates (static BTI) while the transistors are stressed for extended period of time without any recovery phase. This scenario can occur based on the nature of workload phase and it can lead to early timing failures as one year of dynamic BTI stress is similar to a few hours of static BTI stress. To address this problem, we iden-tify correlated static aging phases of timing critical flipflops in an offline correlation
analysis and deploy a runtime monitoring scheme to raise a flag when the circuit enters an accelerated aging phase. A synthetic subroutine based mitigation technique is also proposed to relax the aging stress by exercising aged gates and flip-flops. This leads to an improvement in the overall lifetime of the circuit compared to the case where only dynamic BTI is considered.
Soft-Error Vulnerability Prediction [27, 28]: The vulnerability of a system to soft errors is dynamic in nature due to various masking effects in different levels of abstraction. Hence, it is desirable to have a vulnerability prediction scheme that can turn on and off online protection mechanisms in a cost-effective manner. In this regard, we proposed a low overhead soft-error vulnerability prediction scheme by monitoring only a small number of flip-flops during runtime. Our prediction model can predict the online vulnerability of a whole system comprising of memory arrays and logic cores significantly more accurate than the state-of-the-art prediction techniques based on performance counters.
Runtime Hardware Trojan Detection [29]: During the age of globalization of chip design and fabrication, untrusted designs in the form of third-party intellectual property (3PIP) poses a threat of malicious hardware inclusion in the form of hardware Trojans. The stealthy nature of these Trojans makes them hard to be identified before in-field operation of the chip. Hence, runtime techniques serve as a last line of defense. The state-of-the-art runtime detection techniques monitors functionally defined (semanti-cally significant) signals to capture Trojan activation and these signals are vulnerable to be masked by a rogue designer. We propose an anomaly detection technique based on logic-level signals (semantically insignificant) that are hard to be masked by an adver-sary at a 3PIP level. We could achieve high classification accuracy on the identification of Trojan activation by monitoring the workload profile of a small number of flipflops in the processor core.
All aforementioned techniques involve workload characterization of open-source processor designs at logic level of abstraction. To accelerate the workload characterization, a Field-Programmable Gate Array (FPGA) implementation of open source processor core was used with cross-compiled workloads executed on the FPGA platform. We have used Leon3 [30] and OpenRISC 1200 [31] processor designs along with SPEC [32] and MiBench [33] workloads. For prediction model generation, python-based scikit-learn library [34] was used. In short, the workload execution environment was developed on a real FPGA platform in addition to a post-synthesis simulation environment that can carry out cycle-accurate workload simulations.
1.3 Outline
This chapter describes the motivation and contribution of this thesis. The rest of this thesis is organized as follows:
Chapter 2 provides a brief description of each reliability and security challenge considered in this thesis. The discussion spans from the basic physical effects governing the application-level impact of the dependability issues to the state-of-the-art runtime techniques available in the context of this thesis.
In Chapter 3, our methodology to cost-efficiently address the need for dynamic aging pre-diction is presented. Our fine-grained aging monitoring scheme to analyze and compare the aging stress of workloads during runtime is discussed. Offline prediction model construction based on machine learning is explained with examples and the overhead of online monitoring hardware is calculated. Further, space and time sampling techniques are described to reduce power and area overheads of monitoring.
Chapter 4 presents the worst-case scenario of circuit delay degradation due to static aging and analyzes the impact on different processor designs. A low overhead runtime monitoring scheme is detailed along with a mitigation scheme based on software subroutines. The lifetime improvement due to the proposed monitoring and mitigation scheme is also reported.
In Chapter 5, a low overhead runtime soft-error vulnerability prediction schemes for memory arrays and logic cores of a system is presented. The offline prediction model construction based on two machine learning algorithms is discussed in detail. The overall design of the online monitoring scheme to observe a small set of flipflops is explained with corresponding overheads.
Chapter 6 discusses a scheme for the runtime prediction of hardware Trojan activation. An anomaly detection technique based on monitoring the workload profile of selected circuit nodes is presented. The prediction accuracy achieved on a Trojan-inserted open source processor core executing several workloads is reported.
Finally, Chapter 7 concludes the thesis and a discussion on future implication of this work is given.
In this chapter, the basic challenges to dependable hardware design in the age of aggressive technology scaling and globalized chip fabrication are discussed. In the context of this thesis, a brief introduction to dependability, various reliability and security challenges, and their run-time impact are discussed. Furthermore, a brief introduction to machine learning techniques is also provided.
2.1 Dependability Challenges: Overview of Hardware Reliability
and Security
A computing system is said to be dependable if it can be trusted with its intended functionality. Dependability is the system property that integrates reliability, availability, safety, security and maintainability [8]. The emphasis on these different attributes can be different based on the underlying application. In the context of this thesis, security and reliability attributes are given a higher emphasis, and the term dependability is used as a hypernym as shown in Fig. 2.1.
Dependability Confidentiality Integrity Availability Reliability Safety Maintainability Security
Scope of this thesis
Figure 2.1: Illustration of the attributes of dependability in the scope of this thesis [8].
Fault Error Failure
Figure 2.2: Dependability threats and their causal relationship [8].
According to [8], security is defined as the concurrent existence of confidentiality, integrity and availability. Confidentiality is satisfied only if there is no unauthorized disclosure of information. Integrity demands no improper alterations to system state. Availability can be described as the readiness of correct service. Reliability is termed as a measure of the continuous delivery of correct service.
In addition to the different attributes of dependability as discussed previously, dependability threats are manifested in the form of faults, errors, and failures as illustrated in Fig. 2.2. Fault can be a physical defect on a device. An error in the functionality of a system can be caused by a fault. If an external service is affected by the propagation of this error, a failure is said to be occurred. In short, a fault produces an error, that in turn causes a failure. It can also happen that a fault remains dormant or an error may not propagate based on other characteristics of a system.
With a general overview of the different attributes and threats of dependability, we exam-ine the specific reliability and security aspects tackled in this thesis. With technology scaling advancement, a host of vulnerabilities affect reliability of VLSI designs. In a modern SoC design, billions of transistors are packed in a single chip and this increases the complexity of verification and test efforts. In addition, several transistor degradation mechanisms such as aging cause slowing down of computations over time eventually leading to failures. Transient soft errors, caused by radiations, are another reliability issue that can cause bit flips in circuit nodes that can eventually propagate to cause system failures. The runtime dependence of these reliability issues adds an additional layer of complexity that makes design-time solutions inadequate. On the other hand, the globalization of chip design and fabrication stages in-troduces serious security concerns. The possibility of malicious hardware inclusion in a chip called hardware Trojan at any stage of design flow emerges as a major security threat for government bodies and other customers of the chip. In the following sections, we present an in-depth discussion on specific reliability and security challenges.
2.2
Reliability Challenges
Reliability R(t) is defined as the probability that a computing system performs correct func-tionality for a given period of time t under specified conditions without any failure [35]. In the realm of hardware design, sources of unreliabilities include aging of transistors, radiation-induced soft errors, process variation, susceptibility to noise, and increasing complexities in different hardware abstraction levels. The severity of these reliability issues on a particular chip is largely dependent on the usage scenarios. To quantify the reliability of a system, dif-ferent metrics such as Mean Time To Failure (MTTF) are used. The M T T F of a system is the time for which the system is expected to operate without any failure.
In the context of this thesis, two reliability issues, (a) circuit aging phenomenon, and (b) radiation-induced soft error are discussed in detail.
2.2.1 Circuit Aging G D S p+ p+ H2 Nit
(a) Reaction-Diffusion Mechanism
G D S p+ Channel Carriers p+ ND (b) Trapping-Detrapping Mechanism
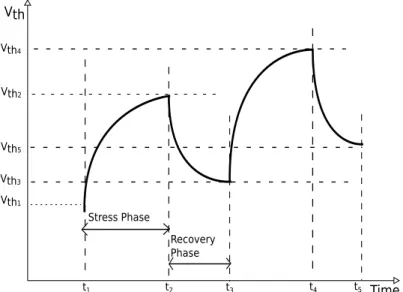
Stress Phase Recovery Phase Vth4 Time Vth1 Vth2 Vth3 Vth t3 t2 t1 t4 Vth5 t5
Figure 2.4: Illustration of stress and recovery phases due to NBTI
Circuit aging refers to the various degradation or wear-out mechanisms that make circuits less reliable over time leading to the occurrence of failures before the end of expected device lifetime. The degradation mechanisms include Bias Temperature Instability (BTI), Hot Carrier Injection (HCI), Time Dependent Dielectric Breakdown (TDDB) and electromigration (EM). BTI, HCI and TDDB degrade the transistor characteristics. BTI causes an increase in the threshold voltage of a transistor that is turned on. Both PMOS (by Negative Bias Temperature Instability (NBTI)) and NMOS (by Positive Bias Temperature Instability (PBTI)) transistors are prone to this effect in advanced technology nodes. This effect can necessitate additional timing margin compromising performance of circuits to prevent early timing failures. HCI is caused by the high lateral electric field due to drain-to-source voltage (Vds) of a transistor leading to the penetration of gate oxide by high energy carriers. This leads to a degradation in the threshold voltage of the transistor which eventually can cause timing failures. TDDB causes degradation of gate oxide characteristics leading to a leakage path through the oxide. In the worst case, it can cause a hard breakdown or permanent damage of the transistor. Electromigration causes wear out of interconnects due to high current density causing timing delays, open circuit or short circuit. In the context of this thesis, we describe BTI models and the effect of BTI on circuit delay in detail.
102 103 104 105 106 107
D-BTI stress duration (seconds)
01 2 3 4 5 6 7 8
∆
V
th(m
V)
~35 seconds ~1.5 weeksD-BTI
S-BTI
0 10
S-BTI stress duration (seconds)
20 30 40 50 60Figure 2.5: Comparison of ∆Vthdue to D-BTI (duty cycle (α)=0.5) and S-BTI.
tech-nology nodes. Although both PMOS and NMOS transistors are affected by Negative Bias Temperature Instability (NBTI) and Positive Bias Temperature Instability (PBTI) respec-tively, we limit our analysis to NBTI. NBTI can cause an increase in the threshold voltage (Vth) of transistors along with a decrease in transconductance (gm) and saturation current (IDsat) at negative gate voltages and elevated temperatures. The modeling of this phenomenon is complicated due to a recovery phase that involves a partial recovery of transistor degradation when a positive gate voltage is applied. The long-term effect of NBTI on a design is heavily dependent on the type and history of stress due to the workload under execution.
NBTI can be explained using two different mechanisms, (1) Reaction-Diffusion (RD) model [37, 38], or (2) Trapping/Detrapping (TD) Model [39, 40]. According to RD model, increase in threshold voltage occurs due to the breaking of covalent (Si-H) bonds at interface resulting in the generation of interface traps as illustrated in Fig. 2.3a. The increase in Vth is assumed to follow a power law relation with the time under stress and an exponential relation with the applied stress voltage.
The TD model proposes a fundamentally different phenomenon to explain the threshold-voltage increase, i.e., the capture and emission of charge carriers by interface traps as illustrated in Fig. 2.3b. The capture time constant determines the probability of trapping and emission time constant determines the probability of detrapping. The threshold voltage increases grad-ually with the change in number of occupied traps and hence, follows a logarithmic relation in Vth shift. TD model assumes a logarithmic relation with stress time and an exponential relation with temperature and stress voltage.
In short, both aging mechanisms assume a stress phase and a recovery phase for a transistor under NBTI as shown in Fig. 2.4 based on the type of bias applied. During a normal workload execution, the bias of a transistor alternates causing alternate stress and recovery phases. In long term, the cumulative effect of NBTI heavily depends on the type of workload executed on the design.
The Vth increase under dynamic stress estimated using a long-term NBTI model for time duration tcan be expressed as in equation 2.1 [41],
∆Vthd= n2Kv2αCt ζ2t2 ox(1−α) n , (2.1)
where tox is the oxide thickness, ζ is the diffusion coefficient, α is the stress duty cycle, n is the time exponent, typically 0.16, and Kv is a function of Vgs,Vth and temperature.
In short, since long-term NBTI effect (termed as dynamic BTI (D-BTI)) involves recovery phases after most of the stress phases (stress duty cycle < 1), the overall effect on Vth and thereby, on the circuit delay is minimal for a short duration of a few hours.
The worst-case increase inVth, and therefore the circuit delay, occurs when there are con-tinuous stress phases and no recovery phases (stress duty cycle = 1). This scenario, termed as static BTI (S-BTI), induces accelerated aging. The Vth shift under static stress (∆Vths) is given by equation 2.2 [41],
∆Vths = Kv2t
n
. (2.2)
The Fig. 2.5 compares the threshold-voltage increase due to S-BTI and D-BTI. It can be observed that the increase in Vth due to one week of D-BTI stress is equivalent to a few seconds of S-BTI stress. In other words, circuits under S-BTI experience accelerated aging stress and this scenario needs to be considered for worst-case timing analysis.
Aging-induced Timing Failures
The aging mechanism described in the previous section increases the threshold voltage of transistors in a CMOS circuit. In the circuit level, the current driving capability of transistors
time
V
o
lta
ge
Vout (before aging) Vin
Vout (after aging) Aging-induced delay d PMOS OFF NMOS ON PMOS ON NMOS OFF Vdd Vin Vout
Figure 2.6: Illustration of an aged CMOS inverter (INV1) and the corresponding deviation in input-ouput characteristics in the form of an additional delay in the switching functionality.
clock A B Out FF 2 D Q Q D Q Q INV1 Out clock A B
Aging-induced delay increase
Registered wrong value (Timing error) Latching
window
Figure 2.7: Illustration of a timing violation and failure caused by an aging-induced delay increase in a timing path.
are affected and it takes more time to charge the output capacitance of logic gates, eventually leading to an increase in propagation delay of logic gates in a circuit. This is demonstrated in Fig. 2.6 with the transfer characteristics of a CMOS inverter having an aged PMOS transistor. Due to aging, the output signal (Vout) of the inverter achieves switching with an additional delay (d). This aging-induced delay is a function of degraded threshold voltage of the transistor and this relationship can be approximated as shown in equation 2.3 [42],
d≈ C
(Vdd−Vth)σ
, (2.3)
where C and σ are technology parameters, Vdd is the supply voltage and Vth denotes the threshold voltage of the transistor.
In a standard-cell based digital design, a hardware block is designed to be executed at a specific clock frequency, which is a function of the worst-case delay of the circuit. A static timing analysis (STA) [43] of the circuit is carried out to determine the worst-case delay of a circuit and the path corresponding to the worst-case delay is termed as critical path. Due to variations in fabrication process, and also due to the runtime variations, the critical paths may change over time from pre-silicon to post-silicon and also during operational lifetime. Hence, a large number of critical paths and near-critical paths need to be considered for aging analysis during design-time. In this scenario, circuits are designed with an additional delay margin termed as guardband to compensate for the variations in circuit delay expected to be introduced by process variation and other runtime variations. This guardbanding technique ensures reliable operation of circuits by compromising the attainable performance.
As the aging mechanisms introduce additional delay in timing paths, some of the path delays could get degraded over time leading to a timing violation causing timing failures. This is illustrated in Fig. 2.7 when the aged CMOS inverter becomes part of a timing path. The switching event at signal B is registered in the flipflop at the end of the timing path only if the signal arrives before the latching window of the flipflop. When the delay increase in the inverter causes a late switching atB with respect to the clock signal, flipflop registers a wrong value causing a timing error or failure.
0.22 0.222 0.224 0.226 0.228 0.23
Increasing duty cycle
Number of cycles Vth (V) SP=1.00 SP=0.25 SP=0.50 SP=0.75 800 0 200 400 600 1000
Figure 2.8: The dependence ofVthon signal probability (SP) [44]
These delay degradations of timing paths are heavily workload dependent. The aging-induced delay of a logic gate is a function of the fraction of time the input of the logic gate remains at logic 1. The probability that a circuit node having a value of 1 is termed as the signal probability (SP) of that circuit node. The dependence of threshold voltage degradation on SP is illustrated in Fig. 2.8 [44]. For a processor design, the workload under execution determines the SPs of internal circuit nodes and hence, the aging-induced circuit delay degradation. Runtime Aging Monitors
Based on workload and runtime parameter variations such as temperature and supply voltage, aging-induced critical path delay of circuits varies. Hence, it is important to monitor the delay of a circuit over time to ensure reliable operation of the chip. Different aging monitoring mech-anisms include in-situ sensors, silicon odometers, tunable replica circuits and representative path-based monitoring.
In-situ sensors: This method tracks the circuit delay in the presence of aging based on modification of flip-flops which are located on the potential critical paths. Most of these flip-flops double-sample the data, first on the normal clock, and then on a delayed clock or by using a delay element. The sampled values are compared with a comparator to analyze whether the delay degradation encroached on the guard band. An example of an in-situ sensor called razor flipflop is shown in Fig. 2.9. Razor is employed for error detection and correction of delay path failures [22]. A shadow latch controlled by a delayed clock is employed along with a normal flipflop. A comparator compares the values in the latch and flipflop for any error. The original value is restored from the latch in case of a timing error.
Silicon odometers: The beat frequency between a stressed Ring Oscillator Surrogate circuit (ROSC) and a reference ROSC is used to capture the effect of aging in silicon odometers [45]. The whole circuit is composed of two free-running ring oscillators
Error_L Error comparator RAZOR FF clk_del Main Flip-Flop clk Shadow Latch Q1 D1 Logic Stage L1 0 1 Logic Stage L2 Error_L Error comparator RAZOR FF clk_del Main Flip-Flop clk Shadow Latch Q1 D1 Logic Stage L1 Logic Stage L1 0 1 Logic Stage L2 Logic Stage L2
Figure 2.9: Razor flipflop deployed in a timing path to monitor the delay and restore the correct value in case of a timing error [22].
Figure 2.10: Illustration of BTI monitoring by measuring the beat frequency between two ring oscillators with one of them under stress and the other used as a reference [45].
and a phase comparator as shown in Fig. 2.10. During normal operation of the chip, one of the ROSCs is stressed with a voltage VDD ST R and no stress is applied to the reference ROSC. During measurement periods, both ROSCs are brought to VDD N OM. The frequency degradation of stressed ROSC compared to the reference ROSC can be translated to aging degradation.
Figure 2.11: Illustration of tunable replica circuits that can be tuned to match the delay of critical paths for monitoring [46].
Tunable replica circuits (TRC): A TRC has a digital delay sensor and it can be tuned to match the delay of a critical path at test time. As shown in Fig. 2.11, TRCs are composed of different logic stages such as inverters, NAND, NOR, pass gates and re-peated interconnects to make the delay sensitivity similar to the critical path. TRCs are inserted adjacent to each pipeline stage in a design to track the local critical-path delays [46]. These are completely separated from the pipeline stages and hence, do not cause performance reduction.
Representative critical path based monitors: Monitoring based on representative critical reliability paths (RCRPs) keeps a stand-alone circuit that is synthesized by identifying shared delay segments between different critical paths. Workload of these selected
Figure 2.12: Representative critical reliability paths showing representation of critical paths with or without workload sampling [47].
delay segments can also be sampled to more accurately represent the critical reliability paths [47]. As illustrated in Fig. 2.12, without workload sampling, the delay segments can be connected together and the transitions can get propagated to induce aging in RCRP. In the case of workload sampling, multiplexers and buffers are inserted to sample workload impact such that the stand-alone RCRPs experience similar aging stress as functional circuit.
Runtime Aging Mitigation Techniques
Since aging phenomenon is heavily workload dependent, several runtime techniques are used to achieve aging mitigation or balanced aging of different hardware components. Advanced task mapping can be employed on multi-core systems in order to balance aging of different cores by mapping tasks based on their aging stress [48].
Along with task mapping, dynamic voltage and frequency scaling (DVFS) schemes can be tuned for joint optimization of reliability and performance [49]. Aging-induced degradation can also be recovered or frozen by allocation of idle intervals among cores. Hence, aging-aware adaptive runtime task allocation can be used to target a lifetime requirement by setting a proper idle/activity ratio. Dynamic cooling mechanisms can be used to reduce temperature such that aging gets slowed down [50].
Adaptive voltage scaling and adaptive body biasing techniques can also be used to control aging of circuits [51]. The current driving capabilities of two NBTI-stressed PMOS transistors with and without adaptive body biasing are compared in Fig. 2.13 [20]. This illustrates that the decrease in drive strength caused by NBTI can be compensated by tuning the body voltage of transistors. Supply voltage is another parameter that can be tuned to reduce the NBTI-induced aging rate. As shown in Fig. 2.14, the Vth degradation is higher for a higher supply voltage (VDD).
|ΔVthp|(V) I DSp (A) with ABB without ABB 0.05 0.1 0 4 4.5 5 x 10⁻⁵ 5.5
Figure 2.13: Illustration of the driving strength ((IDSp)) of two aging-stressed PMOS transistors, one
with and the other without adaptive body biasing [20].
0 0.5 1 1.5 2 2.5 3 x 10⁸ 0 0.01 0.02 0.03 0.04 0.05 0.06 0.07 0.08 0.09 Time (s) Δ Vth (V)
ΔVthwith different voltages
t1
t2
VDD=1V VDD=1.2V
Figure 2.14: Illustration of the dependence of NBTI-induced threshold voltage degradation on supply voltage [19]
2.2.2 Soft Error
Soft error is defined as a transient error occurring in a computing system due to faults caused by particle strikes. This can be caused typically by alpha particles from the packaging material or neutrons from cosmic radiation. As shown in Fig. 2.15, a particle strike can generate large number of electron-hole pairs in the substrate of a transistor. Based on the amount of charge generated and a defined-parameter called critical charge for a circuit, an error might or might not occur in a circuit. The critical charge (Qcrit) is defined as the minimum charge necessary to cause a malfunction in a circuit [52]. If the charge induced by the particle strike reaches aboveQcrit, a bit flip can occur in the circuit and this wrong value can propagate to the output of a system causing a malfunction or failure. Soft error rate is usually expressed in terms of Failure-in-Time (FIT), i.e., number of failures in one billion hours (109).
With technology scaling, transistors become smaller, hold less charge, and hence, more vulnerable to particle strike. On the other hand, shrinking sizes make it harder to get struck by particles. The soft error rate of a particular device depends on how these opposite effects interplay.
G D S p+ p+ + -+ -+ -- -- - --+ -+ + + + ++ + + + + + α
Figure 2.15: Effect of alpha-particle strike on a transistor eventually leading to soft error.
Soft-Error-Vulnerability Estimation
A particle strike can cause a malfunction in a transistor’s operation that can result in a change in the output of a logic gate or a bit flip in a latch or memory cell. During the execution of a program, these bit flips can get masked and may not result in a user-visible error. To calculate the probability that an internal fault results in an externally visible error, the intrinsic FIT rate of a transistor needs to be derated by a number of vulnerability factors.
Architectural Vulnerability Factor (AVF) is defined as the probability that a bit-flip will propagate to a user-visible output [53]. A higher value of AVF of a bit indicates its higher vulnerability to cause a soft error. The circuit structures that need protection can be identified by their AVF values. A bit flip in a branch predictor does not cause a user-visible error in a program execution unlike a bit flip in a program counter. Hence, AVF of a branch predictor is 0% and AVF of a program counter is 100%. For other blocks such as instruction queue, AVF can vary between 0% and 100% based on the workload under execution. The overall soft-error rate (SER) of a chip can be defined as equation 2.4.
Overall SER = circuit-level SER×AVF (2.4)
A soft error can cause either a silent data corruption (SDC) in a circuit or a detectable unrecoverable error (DUE). The former affects the data integrity of the system while the later affects availability of the system. A silent data corruption (SDC) can be understood as an error in the data output that the user cares about. In contrast, detectable unrecoverable error (DUE) is defined as a detectable error that can cause a potential crash, however without any data corruption that user cares about.
There are several methods to calculate AVF of a hardware block. Statistical fault injection (SFI) is one of these methods that involves insertion of a large number of random faults in a system and subsequent checking of the percentage of these faults propagated to the output as an error [52]. To reach a statistical significance, the number of simulations required for SFI is quite large.
In the context of this thesis, we describe two soft-error vulnerability estimation techniques,
Architecturally Correct Execution (ACE) analysis for addressable structures such as memory blocks
Error Probability Propagation (EPP) Analysis for logic blocks such as pipeline stages.
Architecturally Correct Execution (ACE) analysis estimates vulnerability of a bit based on the fraction of clock cycles that bit needs to be correct for error-free program execution [54]. For a program execution of 1 million cycles, let us assume that a bit needs to be correct for only 0.3 million of cycles for the error-free execution of a program. During the remaining 0.7 million cycles, if an erroneous value of the bit does not affect the program output, then the
AVF of the bit is 0.3. The bit is termed as ACE bit for the 0.3 million cycles where a correct value is required and as an unACE bit for the remaining 0.7 million cycles. In short, a bit is ACE for a specific clock cycle if the bit can potentially propagate to the output and result in an error. The AVF of any hardware structure can be calculated based on ACE analysis. The AVF of a memory cell is the fraction of time the cell contains an ACE bit. The AVF of a memory block is the average AVF of all the bits in the memory block. For a hardware structure with N bits, AVF is defined as in equation 2.5 [52].
AV Fstructure = N
X
j=0
ACE clock cyclesj
N×Total clock cycles (2.5)
To estimate the soft error vulnerability of sequential logic blocks, a method based on error propagation probability is used [55]. A faulty value needs to propagate through combinational logic gates and needs to get latched by a flip-flop in order to be considered as an error. Hence, two levels of masking factors need to be considered in this scenario, (1) logic derating and (2) timing derating. Logic derating accounts for the probability that a glitch passes through the combinational logic gates and reaches at the input of a flipflop. Timing derating represents the overlap of the erroneous transient with the latching window of the flipflop such that a wrong value gets latched. The soft error rate of a node where the glitch originates can be determined as in equation 2.6
SERnode= Nominal FIT×Logic Derating×Timing Derating (2.6) , where Nominal FIT represents the technology-dependent raw soft-error rate.
The vulnerability factor or derating factor for a sequential logic block can be estimated as the product of probability of propagation from the node of origin to a flip-flop and the latching probability.
Impact of Runtime Masking Effects and Workload Execution
The particle strikes cause a bit flip or a wrong logic gate output and this erroneous value might not propagate to a user-visible output due to several masking effects. These masking effects can act at different levels of abstraction such as logic, architecture or application.
The masking mechanisms at different levels of abstraction is discussed below.
1 0 0 1 0 1
Figure 2.16: Illustration of logical masking or propagation of transient pulse from the input of a logic gate for different input combinations.
Gate-level Masking: The gate-level masking mechanisms include logical, electrical and latching-window masking. Logical masking occurs if the erroneous value reaches to the input of a logic gate that do not have a role in determining the output (e.g. 0 as input to
an OR gate). Logical masking depends on the circuit topology and input since different logic paths are activated for different set of inputs [56]. The masking of transient pulse by different logic gates is illustrated in Fig. 2.16. For an AND gate, a transient pulse at one of the input gets masked if the other input is logic 0. For an OR gate, a transient pulse at one of the input gets masked if the other input is logic 1.
D Q Q D Q Q attenuated masked
Figure 2.17: Illustration of electrical masking in the form of several stages of transient pulse attenuation. Electrical masking occurs if the transient pulse gets atten
![Figure 1.1: Illustration of complexity and performance increase with technology scaling advancement in microprocessors for the last four decades [1].](https://thumb-us.123doks.com/thumbv2/123dok_us/29928.3004750/25.892.139.739.551.991/figure-illustration-complexity-performance-increase-technology-advancement-microprocessors.webp)
![Figure 2.1: Illustration of the attributes of dependability in the scope of this thesis [8].](https://thumb-us.123doks.com/thumbv2/123dok_us/29928.3004750/31.892.188.691.554.830/figure-illustration-attributes-dependability-scope-thesis.webp)

![Figure 2.12: Representative critical reliability paths showing representation of critical paths with or without workload sampling [47].](https://thumb-us.123doks.com/thumbv2/123dok_us/29928.3004750/38.892.221.695.92.458/figure-representative-critical-reliability-representation-critical-workload-sampling.webp)
![Figure 2.20: Hardware Trojan Taxonomy based on different characteristics of Trojans [61]](https://thumb-us.123doks.com/thumbv2/123dok_us/29928.3004750/45.892.106.770.98.350/figure-hardware-trojan-taxonomy-based-different-characteristics-trojans.webp)