A STUDY ON THE GENERATION RATE OF FOOD
WASTE AND ITS TREATMENT USING
AUTOCLAVE
NURAZIM BINTI IBRAHIM
UNIVERSITI SAINS MALAYSIA
2012
A STUDY ON THE GENERATION RATE OF FOOD WASTE AND
ITS TREATMENT USING AUTOCLAVE
by
NURAZIM BINTI IBRAHIM
Thesis submitted in fulfillment of the requirements
for the degree of
Master of Science
ACKNOWLEDGEMENTS
In the name of Allah (SWT) who has given me life, good health and strength which make it possible for me to finish this research. , I am very thankful.
First and foremost, I would like to express a special gratitude to my supervisor Dr. Mohd Suffian bin Yusoff and co-supervisor Prof. Dr. Hamidi Abd Aziz (Dean of Civil Engineering School) for their valuable guidance, inspiring ideas, comment and support whenever necessary in completing this research.
Very special thanks to the Environmental Laboratory technicians, Mrs. Shamsiah, Mr. Nizam, Mr Zaini and Mr. Nabil who are helping and supporting me in laboratory works. I also like to thank Mrs. Mazura from School of Technology Industry for her cooperation and help. Their assistance was important in completing this research.
My gratitude also goes to the Institute of Postgraduate Studies (IPS) for providing fellowship during my studies and Universiti Sains Malaysia (USM) for financially support this research through Research University Grant. Sincere thanks to my friends; Norrimi Rosaida, Siti Hidayah, Nurul Syakira and Noor Ainee who are always with me whenever I need them. Their support was always encouraging me in finishing this research.
Finally, my deep gratitude is extended to my parents, Ibrahim Ayob and Noraini Daud, and my siblings who are giving me courage and keeps supporting me throughout my studies. Their love and understanding has helped me to move forward.
TABLE OF CONTENTS
Page
ACKNOWLEDGEMENTS ii
TABLE OF CONTENTS iii
LIST OF TABLES vii
LIST OF FIGURES ix
LIST OF PLATES xi
LIST OF ABBREAVIATIONS xii
LIST OF APPENDICES xiv
ABSTRAK xv
ABSTRACT xvii
CHAPTER 1: INTRODUCTION
1.0 Background 1
1.1 Food Waste 2
1.2 Hazards from Food Waste 3
1.3 Mechanical Heat Process 4
1.4 Problems Statement 6
1.5 Objectives 8
1.6 Scope of Study 9
1.7 Thesis Organization 9
CHAPTER 2: LITERATURE REVIEW
2.0 Introduction 11
2.1 Municipal Solid Waste (MSW) 14
2.1.1 Types of MSW 15
2.1.2 MSW Generation 15
2.1.3 Factor Affecting the Acceleration of MSW Generation Rate
18
2.1.3(a)Urbanization and Economic Development 18 2.1.3(b) Lifestyle (Rise in Community Standard 20
2.1.3(c) Increasing of Population 22
2.1.4 Composition of MSW 22
2.1.5 Waste Management 25
2.2 Food Waste 28
2.2.1 Characteristics of Food Waste 28
2.2.1(a) Physical characteristics 29 2.2.1(b) Chemical Characteristics 32
2.2.2 Food Waste Problems 37
2.2.3 Material Recovery Option 40
2.2.3(a) Recycling 40
2.2.3(b) Composting 42
2.2.3(c) Incineration 44
2.2.3(d) Landfill 44
2.2.4 Aim of Sustainability Management 46
2.2.5 Autoclaving 46
2.2.5(a) Autoclaving Process 48
2.2.5(b) Autoclaving Procedure 49 2.2.5(c) Autoclaving in term of waste management 51 2.2.6 Characteristics and Potential of Autoclave Product as
Fertilizer
51
2.2.7 Fertilizer 53
2.2.8 Market Potential 54
CHAPTER 3: MATERIALS AND METHODS
3.1 Introduction 59
3.2 Materials and Chemicals 59
3.3 Food Waste Generation Study 59
3.3.1 Location of Study 62
3.3.2 Period Study of Food Waste Generation 64 3.3.3 Estimation of Daily Food Waste Generation 64 3.3.4 Sampling and Characterization Study 65
3.4 Characteristics Study of Food Waste 67
3.4.1 Sample Processing 67
3.4.2 Moisture Content 68
3.4.3 pH 69
3.4.4 Total Organic Carbon (TOC) 69
3.4.5 Total Kjeldahl Nitrogen (TKN) 70
3.4.6 Total Phosphorus (TP) 72
3.4.7 Determination of Heavy Metal and Potassium 72
3.4.7(a) Acid digestion 72
3.3.7(b) Analysis of Total Potassium (TK) 74 3.3.7(c) Analysis of Heavy Metal 74 3.4.8 Determination of Oil, Fat and Grease 75
3.5 Autoclaving Treatment 77
3.5.1 Sample of Food Waste for Autoclaving Treatment 78
3.5.2 Operating Condition 78
3.5.3 Characteristics Study of Treated Food Waste 80
CHAPTER 4: RESULTS AND DISCUSSIONS
4.0 Introduction 82
4.1 Study of Food Waste Generation and Composition 82 4.1.1 Food Waste Management System in USM Engineering
Campus
83
4.1.2 Daily Food Waste Generation Rate During 30 days of Collection Time
86
4.1.3 Mean of Daily Generation Rate 89
4.1.4 Percentage of Food Waste Generated from Week 1 to Week 4
90
4.1.5 Food Waste Generation Rate 96
4.2 Composition of Food Waste 99
4.3 Physical Characteristics 106
4.3.1 Physical Characteristics of Food Waste 106 4.3.1(a) Food Waste Bulk Density 107
4.3.1(b) Food Waste Moisture Content 107 4.3.2 Physical Characteristics of Treated Food Waste 108 4.3.2(a) Treated Food Waste Moisture Content 109
4.4 Chemical Characteristics 111
4.4.1 Chemical Characteristics of Food Waste 112 4.4.2 Chemical Characteristics of Treated Food Waste 113 4.4.2(a) Treated Food Waste pH 114 4.4.2(b) Carbon to Nitrogen Ratio (C/ N) 116
4.4.2(c) Total Phosphorus, P 121
4.4.2(d) Total Potassium, K 122
4.4.4 Heavy Metal Content 123
4.4.5 Oil, Fat, and Grease Content 130
4.5 Potential of Autoclaved Food Waste as Agriculture Products 132 4.5.1 Experience from using autoclaving treatment 134
CHAPTER 5: CONCLUSION AND RECOMMENDATIONS
5.1 Conclusions 136
5.2 Recommendations 141
REFERENCES 144
LIST OF TABLES
Page
Table 2.1 Number and types of Landfill in Malaysia 14 Table 2.2 Sources and Types of Solid Wastes 16 Table 2.3 Waste Generation in Peninsular Malaysia (tons/year) 17 Table 2.4 Prediction of Total MSW Generation in Kuala Lumpur 18 Table 2.5 Urban Municipal Solid Waste Generation 19 Table 2.6 Global Perspective on Urban Solid Waste
Characteristics
21
Table 2.7 Average Percentage of Components in MSW Generated by Various Sources in Kuala Lumpur
21
Table 2.8 Waste Composition (Percentage wet weight) in Malaysia from 1975 to 2005.
23
Table 2.9 MSW composition by Percent –Regional Defaults 24 Table 2.10 Method of Waste Disposal in Malaysia 27
Table 2.11 Food Waste Characteristics 29
Table 2.12 Information on GDP, Waste Quantity and Composition for Some Asian countries
31
Table 2.13 Guidelines on Heavy Metals for Food Safety Set by Different Countries
37
Table 2.14 Permissible Limit of Heavy Metal for Compost Material and Soil
38
Table 2.15 Summaries of 12 Factors that Influencing Recycling in Developing Countries
41
Table 2.16 Typical outputs from Autoclaving 50 Table 2.17 Macronutrients and micronutrients function and
deficiency symptoms for plant
55,56
Table 2.18 Parameters that maybe used to define the Quality of Compost Product
58
Table 3.2 General Calibration Setting for ICP-OES 75
Table 3.3 ICP-OES Calibration Parameter 75
Table 3.4 Food Waste Composition Used in Autoclaving Treatment
78
Table 4.1 Food Waste Generation Rate 98
Table 4.2 Food Waste Fraction and Percentage Generated at USM Main Campus Cafeteria
101
Table 4.3 Bulk Density for each Cafeteria (30days) 107 Table 4.4 Weight of Food Waste before and after Autoclaving
Treatment
111
Table 4.5 Chemical Characteristics of food waste before Autoclaving
113
Table 4.6 C/ N Ratio in Treated Food Waste 119
Table 4.7 Heavy Metal Concentration 124
Table 4.8 Heavy Metal Content in Treated Sample From Different Sources of Sample
130
Table 4.9 Compost Quality Standard 130
Table 4.10 Food Waste and Treated Food Waste Characteristics 134 Table 4.11 Advantages and Disadvantages of Autoclaving for
Waste Management
LIST OF FIGURES
Page
Figure 1.1 MHT Schematic Diagrams 5
Figure 3.1 Flow chart of Research Methodology 60
Figure 3.2 Acid digestion processes 73
Figure 3.3 Soxhlet Extraction Apparatus 76
Figure 4.1 Solid Waste Management System in Kuala Lumpur 84 Figure 4.2 Solid Waste Management System in Nibong Tebal 84 Figure 4.3 Food Waste Management in USM Engineering
Campus
85
Figure 4.4 Alternative Management System Proposed for Food Waste
87
Figure 4.5 Daily Food Waste Generation Rate 88 Figure 4.6 Trend of Food Waste Generated from Week 1 to
Week 4
90
Figure 4.7 Daily and weekly variation of food waste generation during study period (20 December 2010 to 08 January 2011)
91
Figure 4.8 Percentage of food waste generation for 7 days against total food waste generation.
92
Figure 4.9 Summary of Food Waste Generated in Eight USM Engineering Campus Cafeterias.
93
Figure 4.10 (a) Food Waste Composition at Cafe 1 for One Week 102 Figure 4.10 (b) Food Waste Composition at Cafe 2 for One Week 102 Figure 4.11 (a) Kitchen Waste Generation at Cafe 1 for One Week 103 Figure 4.11 (b) Kitchen Waste Generation at Cafe 2 for One Week 104 Figure 4.12 (a) Leftover Food Generation at Cafe 1 for One Week 105 Figure 4.12 (b) Leftover Food Generation at Cafe 2 for One Week 105 Figure 4.13 Treated Food Waste Moisture Content 109
Figure 4.14 Food Waste and Treated Food Waste Moisture Content
110
Figure 4.15 Comparison of pH Before and After Treatment 115 Figure 4.16 Effect of Treatment Time to pH 116 Figure 4.17 TOC Content in Treated Food Waste 118 Figure 4.18 TKN Content in Autoclaved Food Waste 119 Figure 4.19 C/N Ratio before and after Autoclave Treatment 120 Figure 4.20 Phosphorus (P) Level in Food Waste and Treated
Food Waste
121
Figure 4.21 Potassium (K) level in Treated Food Waste 122 Figure 4.22 Potassium (K) Level Before and After Autoclaved
Treatment
123
Figure 4.23 Heavy Metal Concentration Detected in Treated Sample
127
LIST OF PLATES
Page
Plate 3.1 Location of Cafe 1, Cafe 2, and Cafe 3 USM Engineering Campus
63
Plate 3.2 Location of Cafe 4, Cafe 5, Cafe 6, Cafe 7, and Cafe 8 USM Engineering Campus
63
LIST OF ABBREVIATIONS
ATP Adenosine Triphosphate
GHG Green House Gases
MHT Mechanical Heat Treatment MSW Municipal Solid Waste
MHLG Ministry of housing and Local Government DOE Department of Environment
MOH Ministry of Health USM Universiti Sains Malaysia TOC Total Organic Carbon TKN Total Kjeldahl Nitrogen
P Phosphorus
K Potassium
TP Total Phosphorus
TK Total Potassium
ICP-OES Inductively Coupled Plasma Optical Emission Spectrometry
DM Dry matter
H2SO4 Sulphuric acid
HNO3 Nitric acid
HCl Hydrochloric acid H2O2 Hydrogen peroxide
H3PO Ortho-phosphoric acid
K2SO4 Potassium sulphate
HgO Red mercuric oxide
NaOH Sodium hydroxide
Cd Cadmium Cr Chromium Cu Copper Fe Ferum/ Iron Pb Plumbum/ Lead Ni Nickel Mg Magnesium
Mn Manganese
LIST OF APPENDICES
Page
Appendix A Map of Universiti Sains Malaysia Engineering Campus 155 Appendix B Data Sheet for Daily Generation Rate 156
Appendix C Data Sheet for Volume (Density) 157
Appendix D Data Sheet for Number of Customer Eating 157
Appendix E Food Waste Fraction 158
Appendix F WALKLEY-BLACK METHOD 159
Appendix G Apparatus for Analytical Analysis 160 Appendix H Total Phosphorus (TP) Analysis according to HACH
Method
162
Appendix I Total Potassium (TK) Analysis according to HACH Method
168
Appendix J Autoclaving Equipments and Procedure 173 Appendix K Food waste Daily Generation Rate 176
Appendix L Food waste Volume (Density) 177
Appendix M Total Generation of Food Waste 179
Appendix N Food Waste Generation from Week 1 to Week 4 180 Appendix O Number of Customer Eating at Café 1 and Café 2 181
Appendix P Fraction of Food Waste 183
Appendix Q Physical Characteristics of Food Waste and Autoclaved Food Waste
186
Appendix R Chemical Characteristics for Food Waste and Autoclaved Food Waste
KAJIAN KADAR PENJANAAN SISA MAKANAN DAN OLAHANNYA MENGGUNAKAN AUTOKLAF
ABSTRAK
Aliran sisa pepejal perbandaran di Malaysia adalah terdiri daripada 50 sehingga 60% sisa makanan. Sifat semula jadi atau ciri sisa makanan itu sendiri menyebabkan ia sukar untuk diuruskan dan pada masa yang sama banyak masalah alam sekitar telah timbul disebabkan oleh sisa makanan. Pembuangan sisa makanan ke tapak pelupusan sampah memakan ruang yang besar dan menyebabkan jangka hayat tapak pelupusan sampah berkurangan. Sehingga Mac 2012, jumlah keseluruhan tapak pelupusan sampah di Malaysia adalah 296. Namun begitu, tapak pelupusan sampah yang masih aktif beroperasi hanyalah 166, manakala 130 tapak pelupusan lagi telah ditutup. .Kajian penjanaan sisa makanan telah dijalankan di kampus kejuruteraan Universiti Sains Malaysia (USM) bagi menganggarkan kadar penjanaan dan komposisi sisa makanan, mengenal pasti faktor-faktor yang mempengaruhi penjanaan sisa makanan, menentukan ciri-ciri sisa makanan sebelum dan selepas rawatan autoklaf dan mengenal pasti sama ada rawatan autoklaf sesuai sebagai rawatan alternatif bagi menguruskan sisa makanan. Kajian mengenai kadar penjanaan sisa makanan dijalankan dengan menimbang berat sisa makanan yang dijana oleh lapan cafeteria dalam jangka masa 30 hari. Hasil kajian menunjukkan bahawa 3402.2kg sisa makanan telah dijana dalam masa 30 hari di mana bersamaan dengan 113.4kg/sehari dan penjanaan bagi perseorangan adalah di antara 0.15kg hingga 0.17 kg sehari. Kajian komposisi makanan menunjukkan bahawa nasi adalah pecahan yang tertinggi dalam sisa makanan diikuti oleh sayur-sayuran dan lain-lain pecahan seperti tulang, sisa ayam, plastik, kertas, sisa ikan dan lain-lain-lain-lain. Selain-lain daripada nasi dan sayur-sayuran, peratusan bagi pecahan sisa makanan yang lain adalah
berbeza-beza mengikut makanan yang disediakan oleh kafeteria. Faktor-faktor yang menentukan kadar penjanaan dan komposisi sisa makanan adalah dipengaruhi oleh jumlah penduduk, sosio-ekonomi, jenis makan yang disediakan, dan tingkah laku penduduk. Sisa makanan yang dikumpul daripada kafeteria-kafeteria mempunyai kadar lembapan yang tinggi dengan purata peratusan 73 dan sedikit berasid dengan nilai pH antara 4.80 -5.53. Namun begitu, kadar lembapan menunjukkan penurunan kepada 63% selepas menjalani rawatan autoklaf manakala nilai pH menurun berkadaran dengan peningkatan masa rawatan. Berpandukan kepada data yang diperoleh sisa makan mengandungi zat-zat penting (N, P, K, Mg, Mn, Zn, Fe, dan Cu) yang diperlukan bagi pertumbuhan tanaman dan kandungan logam berat yang rendah. Masa yang paling sesuai untuk rawatan autoklaf berdasarkan keadaan yang telah ditetapkan (suhu 121-127oC dan tekanan 17-21Psi) dalam kajian ini adalah 60 minit di mana ciri-ciri yang dikaji memenuhi piawaian bagi produk kompos. Ini menunjukkan bahawa rawatan autoklaf mempunyai potensi sebagai salah satu alternatif untuk sistem pengurusan sisa makanan.
A STUDY ON THE GENERATION RATE OF FOOD WASTE AND ITS TREATMENT USING AUTOCLAVE
ABSTRACT
Malaysian municipal solid waste (MSW) stream consist of 50 to 60 % of food waste. Nature or characteristics of food waste causes it hard to be managed and whilst cause many environmental problems. Dumping food wastes to the landfill take up a large space area and reducing the lifespan of landfill. Until March 2012, the total number of landfill recorded was 296 sites but the number of sites that are still actively in operation was only 166, while 130 sites were closed. Food waste generation study was carried out in Universiti Sains Malaysia (USM) engineering campus to estimate the generation rate and food waste fractions, addressing factors that influence food waste generation, and determine characteristics of food waste before and after autoclaving treatment to identify suitability of wet heating treatment as alternative management system. Generation rate study was done by weighting food waste generated at eight cafeterias for 30 days. The results show that 3402.2kg of food waste was generated for 30 days which is equal to 113.4kg/day and per capita generation was ranging between 0.15kg to 0.17kg per day. The composition study on food waste indicated that boiled rice was the higher fraction in food waste collected followed by vegetables and other fraction such as bones, chicken waste, plastics, paper, fish waste and others. Besides boiled rice and vegetables, other fraction percentage was varied according to the types of food prepared by cafeterias. Factors that determine the generation rate and fractions of food waste were mainly influence by population number, socioeconomic, types of food prepared and behavior of the population. Food wastes collected from cafeterias have high moisture content with the average of 73% and were slightly acidic with value ranging from 4.80 to 5.53. The moisture content was decreased to 63% after autoclaving
while pH values keep decreasing as the time for treatment increases. According to the results obtained food waste contained important nutrients such as N, P, K, Mg, Mn, Zn, Fe, and Cu required for healthy plant growth and are low in heavy metals content. The most suitable time for treatment in the operating condition given (temperature of 121-127oC and pressure of 17-21psi) in this study was 90 minute where determined characteristics were meeting the standard requirement for compost product. These indicate that autoclaving treatment has a potential as alternative management system for food waste.
CHAPTER 1
INTRODUCTION
1.0 Background
The increasing amount of solid waste is one of the major issues that have been discussed around the world nowadays. Every day, the amount of solid waste generated is increasing at geometric rate. The generation and composition of solid waste vary from country to country depending on the economic situation, industrial structure, waste management regulations, and population life style (IPCC Guidelines, 2006).
The management and treatment of municipal solid waste (MSW) is a worldwide concern especially in highly urbanized cities. Malaysia is one of the countries in the world facing the problem of MSW management. The continuous growth of economic and population in Malaysia increase the generation of MSW. It brings a new challenge to the local government in order to find a suitable method for managing the solid waste.
The generation of solid waste in Malaysia (inclusive of households and commercial waste) is estimated to increase from 9.0 million tonnes per year in 2005 to 10.9 million tonnes per year in 2010, to about 12.8 million tonnes per year in 2015 and is expected to reach 15.6 million tonnes per year in 2020 (Agamuthu and Victor, 2011). The challenge in managing MSW is due to the complexity of the waste composition (Periathamby et. al., 2009). The composition of solid waste consists of organic waste, plastic, paper, metal, glass, and others. Therefore, most of the solid waste is made up
2
from organic wastes including the food waste (Hasan et al., 2001; Kathirvale et al., 2004; Hui et al., 2006). Approximately 43% to 64% of solid wastes in Malaysia consist of organic waste (Periathamby 2009; Agamuthu and Victor, 2011).
Until March 2012, the total number of landfill recorded was 296 sites but the number of sites that are still actively in operationwas only 166, while 130 sites was closed (NSWMD, 2012). At the same time, Malaysia is facing a problem to find a new and suitable land to be used as landfill. This situation has pushed Malaysia’s Government to find a new method to treat the MSW and reduce the volume of solid waste which will be disposed off at the landfill. Since more food waste is generated from any other type of solid waste, a good management and suitable treatment will significantly help in reducing the community waste stream. It will also reduce the use of landfill and extend the lifespan of the landfill.
Food waste is an organic waste which can be processed into a high quality compost material if it is collected separately and undergo treatment. Some researchers have found ways to convert the food waste into valuable organic fertilizer which can be used in farms or organic plants. This method may reduce the uses of landfill and extend the lifespan of it.
1.1 Food Waste
Food waste can be defined as any food that is not consumed by humans and can be generated at any level within the food chain including any by-product or waste product (Okazaki et al., 2008). In other words, the food waste is the unwanted raw or
cooked food being discarded during or after food preparation that is no longer fit for consumption or desirable. The examples of food waste are the uneaten portion of meal, and the preparation activities of trimming from food in the kitchen, restaurants and cafeteria (Zhang et al., 2007).
A few options are available for managing the food waste such as composting, incinerating and disposal to land (landfilling). Therefore, landfilling is the most preferred method in Malaysia in order to dispose off the food waste and other solid waste. However, this method is not enough to support the increasing amount of solid waste nowadays. Besides, serious environmental problems may occur if food waste were dumped into landfill which is not properly engineered and managed. The negative impacts of food waste to the environment will be discussed in Section 1.2.
1.2 Hazards from Food Waste
Food waste is easily biodegradable and produce odour detrimental to the environmental quality (Tsai et al., 2007). The disposal of organic waste such as food waste without properly engineered and managed will cause serious environmental problems such as production of leachate and the emission of greenhouse gasses (e.g., methane and carbon dioxide). Leachate from disposal site contains high toxicity and may cause contamination of underground water if infiltrations happen. The contamination of water sources and bad odour produced from the degradation of food waste is also harmful to human health. Meanwhile, the methane gas and carbon dioxide can causeglobal warming and it is 21 times more potent than carbon dioxide (Bavani and Phon, 2009). The treatment of food waste can give benefits in reducing the
4
environmental problems and whilst reducing the volume of solid waste that goes to landfill.
1.3 Mechanical Heat Process
As already known, food waste has brought significant impact not only to the natural environment (soil, water, air, biodiversity) but also to human health, and climatic factor. The dangerous condition may occur in the future if this problem is not taken seriously. So, more attention needs to be paid to ways of dealing with the material (Shuman et al., 2010).
Recently, mechanical heat process or also known as Mechanical Heat Treatment (MHT) has started to get an attention as another option in waste management. MHT is a relatively new term used to describe the combination of a series of mechanical separation and thermal processwhich is using steam based technology (DEFRA, 2007; SEPA, 2009). The main target of this process is to separate a mixed waste stream into its fraction for further option such as recycling, recovery and biological treatment (DEFRA, 2007; Friends of the Earth, 2008). MHT process starts with the mechanical separation to remove large items (large metal objects, rubber or bulky item such as carpet) from the waste stream which is not suitable for the next stage. After that, waste is loaded into the vessel for heat treatment (Papadimitriou et al., 2009). During the treatment, the physical characteristic of waste is transformed. Then, once again the mechanical separation is taking place in order to separate the processed waste into organic and inorganic fractions. Floc is separated from the recyclable materials, residue
glass, metals and plastic by using the separation technique. The MHT schematic is shown in Figure 1.1.
Figure 1.1 MHT Schematic Diagrams (Sources: DEFRA, (2007)
Basically, there are two types of MHT that are usually used, i.e. autoclaving and non-pressurized treatment process. However, autoclaving is the most common system being promoted for the MSW (DEFRA, 2007). Autoclaving is also known as steam disinfection and has been used for a decade to sterilize the reusable of medical instruments and waste treatment. Autoclave utilizes the steam that is injected into a
MSW Mechanical Preparation & Heat Treatment Mechanical Separation Floc/ Fiber Reject to Landfill Refuse Derive Fuel (RDF) Recycling application Recyclables; metals, Plastics, glass Biological Treatment Compost like output
6
sealed metal chamber under high pressure which ‘cooks’ or ‘clean’ the residual waste. In this study, the autoclaving process is used to treat only one part of MSW stream that is food waste.
1.4 Problems Statement
MSW streams occurred due to the rapid growth of urban areas which is caused by the increasing number of population, changing consumption patterns, economic development, changing income, urbanization and industrialization (Ngoc et al., 2009). Urbanization and modernization cause the migration of population to the cities. The growth of population in this area demands for larger or more disposal sites. Recently, landfills in Malaysia were facing problems of overfilling and leachate pollution to underground water. Besides that, uncontrolled dust and methane emissions adversely affect the local environment (Sharifah et al., 2008).
Food waste has a negative effect on economic value and produces several environmental impacts such as increasing of BOD (biological oxygen demand) and COD (chemical oxygen demand) if it is discharged into waste water treatment plant. However, it could be one of the best renewable sources such as organic fertilizer if it is well-collected and processed.
The environmental problems facing in landfill today mostly come from a large portion (about 50-60%) of food waste which was disposed together with other solid waste in landfill (Saheri et. al. 2009). Besides landfill, Jalil(2010) has reported that, 20% of the organic waste including food waste is burned or dumped into rivers or illegal
sites, while 5% of it is being recycled. So, an alternative technology is explored and proposed for diverting the organic waste from landfill such as incineration and composting. In certain places such as PulauLangkawi, PulauPangkor, PulauTioman and Cameron Highland, incinerators become an alternative management for MSW including food waste (NSWMD, 2012). However, this method is inefficient due to the typically high moisture content of Malaysia’s waste (Kathirvale et. al, 2003).
Composting is also proposed as alternative treatment for solid waste but there are many challenges in building and operating the composting facilities especially in highly urbanized area. If this method is going to be use, the food waste needs to be mixed to a bulking agent to reduce its moisture content, increase pH and facilitate composting. Example of bulking agents use for composting purpose is chopped hay, straw, wood shavings, rice husk and cardboard (Adhikari et al., 2008; Chang and Chen, 2010). But, this bulking agent may not be readily available. These materials needed to be prepared before it was added with food waste in the right ratio to optimize the composting process. The ratio of bulking agent to waste has to be adjusted depending on the compost material and its characteristics (Adhikari et al., 2008).
Meanwhile, the cooperation and involvement from communities are vital to operate the urban composting facilities successfully. Since food waste is an organic material, it will certainly produce odour and leachate which require high attention. Furthermore, the limitation of demand for compost products and uncertainty to its safety in term of contaminant such as heavy metals and bacterial pose a dilemma. This matter has pushed Malaysia government to find alternatives method for solid waste management for this country. An effective waste management system and treatment is
8
required to achieve a better quality of life in Malaysia. Thus, this research will explore a new idea on food waste treatment by using mechanical heat treatment (MHT).
Autoclaving is another MHT process that is introduced recently for solid waste treatment. However, the suitability and capability of this method in treating solid waste is still in question. Thus, this method is not yet commercially used in Malaysia. Advantageously, autoclaving is able to produce floc like material from organic waste which might be suitable to be used as organic fertilizer. A characterization study on food waste and autoclaving it will provide some useful information that can be used in deciding the suitability of this process as an alternative method for food waste treatment in Malaysia. This will meet with the current government campaign to convert food waste into fertilizer in order to minimize food waste stream.
1.5 Objectives
The objectives of this research are listed as follows:
i. To study food waste generation rate and composition at USM engineering campus.
ii. To study the physical and chemical characteristics of food waste from the cafeterias in USM engineering campus.
iii. To determine the effect of autoclaving on the physical and chemical characteristics of food waste.
iv. To determine the quality of autoclaved food waste as soil amendments or organic fertilizer in term of nutrient availability and potential toxic element content.
1.6 Scope of Study
This research is focusing on the study of food waste generation, autoclaving treatment and determination of food waste characteristic before and after autoclaving treatment. The selected area for the study of food waste generation was USM Engineering Campus. This study covered eight cafeterias where three of them were situated at the centre of staffs’ and students’ buildings and another five of them were situated near the hostel buildings. The research involved the determination of physical and chemical characteristics of food waste. The study of physical characteristics comprised of generation rate, composition, bulk density, moisture content and pH of the food waste. Meanwhile, the study of chemical characteristic covered on the nutrient contents of food waste such as total organic carbon (TOC), total kjeldahl nitrogen (TKN), C/N ratio, potassium, and phosphorus. Besides that, the presence of heavy metals content (Cd, Cr, Cu, Fe, Pb, Ni, Mg, Mn, and Zn) in food waste was also determined. The data obtained was used as references in determining the potential of autoclaving as food waste treatment.
1.7 Thesis Organization
This thesis is arranged into five chapters. Chapter 1 briefly explains the issue of MSW management and its composition, description of food waste and the impacts to the environment, and an overview of autoclaving process. In this chapter, problems statement is used to set the scene and provide some rational and necessity view for this study. The objectives of this study are also included in this chapter. Lastly, the thesis organization is presented.
10
Chapter 2 provides related information from the previous studies carried out by other researchers which are related to this study such as composition of waste, characteristics of waste and innovative use of autoclaving in the MSW treatment. Some information regarding on food waste hazards and management system are also included in this chapter.
Chapter 3 shows the flow chart of this research and elaborates the steps of laboratory works in details. All experimental setup including sample preparation and autoclaving processes are described in this chapter.
Chapter 4 presents the results obtained from this study. The main topic discussed in this chapter are the study of generation and composition of food waste in cafeterias across USM Engineering Campus, characteristics of food waste, autoclaving treatment, and characteristics of autoclaving products.
Chapter 5 summarizes the results reported throughout this study and provides recommendations for future studies in the same field.
CHAPTER 2
LITERATURE REVIEW
2.0 Introduction
Geographically, Malaysia lies at a latitude of 2o and 7o of the equator. The tropical climate has caused Malaysia to have warm and humid climate throughout the year with temperatures range of 21oC to 32oC. Meanwhile, the relative humidity is ranging from 80% to 90% (aManaf. et al., 2009). Malaysia is made up of Peninsular Malaysia at the west and Sabah and Sarawak at the east. It has a total landmass of 329, 847 km2 characterized by mostly mountains terrain. Kuala Lumpur is the capital city of Malaysia and Putrajaya is the seat of the federal government. The total population estimated in 2008 was approximately 27.5 million with annual growth rate of 2%.
Malaysia is a developing country which continues to grow in many sectors in order to achieve the vision of 2020. The manufacturing, tourism, primary commodities sectors such as petroleum, palm oil, natural rubber and timber are major contributors for Malaysia’s economy. The continuous economic growth and developments cause changes in standard of living which lead to an increase of waste generation per capita. Changes in economy enhance the development in rural areas. There are many rural areas that have been transformed into industrial areas and provide job opportunities to the rural communities. Besides local citizens, the job opportunities have attracted citizens from neighboring countries and cause considerable migration. The increasing of population and migration contributes to the increasing of average daily of solid waste
12
generation especially in urban areas. This issue certainly attracts attention from Malaysia government. The amount of MSW generated that keep increasing each year makes the management of MSW becomes crucial.
The average amount of solid waste generated in Malaysia was 0.5-0.8 kg/person/day (Khathirvale et al. 2003). Therefore, this amount is predicted to increase in the future. The quantity of solid waste generated in 2001 was 16, 200 tons/day and increased to 19,100 tons/day in 2005. It is expected to reach 30, 000 tons / day in 2020. Meanwhile, large city like Kuala Lumpur has bigger average of solid waste generated. The generation of solid waste in Kuala Lumpur is estimated to reach 7, 713.6 tons/day in 2020 based on current waste generation trends (Saeed et al., 2009).
The previous studies of characterization of municipal solid waste (MSW) showed that the composition of solid waste in Malaysia comprised of food or organic substances, paper, plastic, glass, metals, textile, wood and others. The major components consisted in Malaysia’s MSW were found to be organic food waste followed by mix paper and plastics (Kathirvale et al. 2003; Manaf et al. 2009a; Saeed et al 2009). The generation of food waste was ranging between 50 to 70 percent from year 1975 to 2000. In 2008, Kuala Lumpur also showed that food waste was the major component with percentage of 56.8 from the total of solid waste generated. Food waste is considered as one of the recyclable component of waste. Therefore, it is not receiving a much attention from the authorities to tackle this issue.
In Malaysia, solid waste management is under the responsibility of three different governments department which are the Ministry of Housing and Local
Government (MHLG), Department of Environment (DOE) and Ministry of Health (MOH). These departments are handling three different types of solid waste which are MSW, hazardous waste and clinical waste. Based on Section 72 in the Local Government Act 1976, the local authorities hold the responsibility to provide a clean environment to the public by disposing the waste in sanitary way.
Since, landfilling is the main option for MSW disposal in Malaysia. About 90% of wastes are disposed off in landfills. Meanwhile, 2% is recycled and another 5% is dumped illegally. There are 296 landfills sites in Malaysia with only 165 sites that are still operating including 8 sanitary landfills (NSWMD, 2012) as listed in Table 2.1. The other sites are open and control dumpsites and not equipped with proper facilities such as leachate treatment. This problem has created serious environmental problems like groundwater pollution, greenhouse gases (GHG) emission, odorous smell and serious diseases. At the moment, constructing a new landfill site is nearly impossible due to the scarcity of landand the increases in the price of land as the consequences from the high demand of land by individual or organization especially in urban area (Manaf et al. 2009a). Meanwhile, another method of MSW disposal such as incineration produces toxic air which pollutes the air and its ash contained heavy metals which have to be properly disposed off.
In order to achieve sustainable development, Malaysia is desperate to find the suitable method for sustaining the waste management. Recycling, reuse and recovery– essentials become the approach of solid waste management. However, recycling is still at an infant stage in Malaysia (Manaf et al., 2009a). By considering that the recycling method still needs more time to reach the target, Malaysia government has taken an
14
initiative to start recovering the waste into essential materials such as conversion of food waste into organic fertilizer.
Table 2.1: Number and types of Landfill in Malaysia States
Number of Landfill
Still Operated Closed Sanitary Non-Sanitary
Johor 14 23 2 12 Kedah 8 7 - 8 Kelantan 13 6 - 13 Melaka 2 5 - 2 N. Sembilan 7 11 - 7 Pahang 16 16 - 16 Perak 17 12 - 17 Perlis 1 1 - 1 Pulau Pinang 2 1 - 2 Sabah 19 2 - 19 Sarawak 49 14 3 46 Selangor 8 14 3 5 Terengganu 8 12 - 8 W. Persekutuan 1 7 - 1 Total 165 131 8 157 Final Total 296 296 Sources: NSWMD, (2012)
MSW in Malaysia is comprised up mostly from food waste. Food waste that goes to landfill will degrade and produce greenhouse gasses and leachate which is the main causes of global warming and groundwater pollution. However, food waste has the potential to be converted as fertilizer and soil amendments.By diverting of food waste from the main waste stream, it can reduce the volume of solid waste to landfill and thus reduce the pollution to theenvironment.
2.1 Municipal Solid Waste (MSW)
Waste can be defined as any unwanted material intentionally thrown away for disposal including materials which is useful once they are removed from the waste
streams (World Bank, 1999). Generally, waste is classified into different groups such as physical state (solid, liquid and gaseous), materials (food waste, glass, paper, etc.), origin (industry, household, commercial, etc.) or safety level (hazardous and non-hazardous). Typically, municipal solid waste (MSW) is a combination of all group of solid waste and generally defined as discarded materials from households, commercial, institutional, and industrials (Farrel and Jones, 2009).
2.1.1 Types of MSW
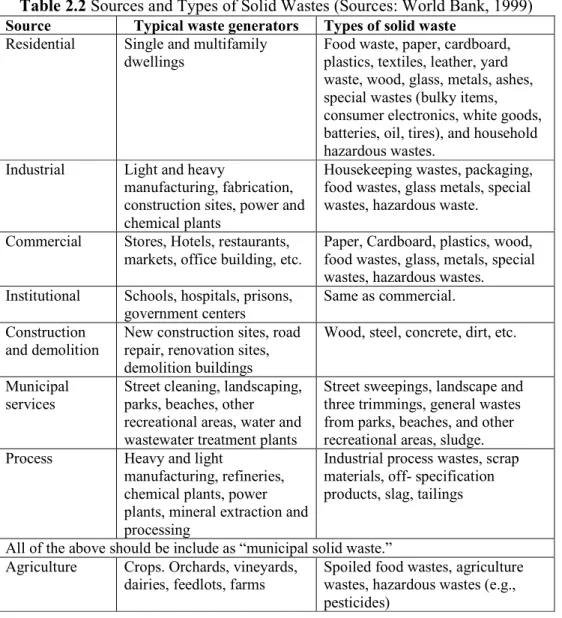
Knowledge regarding the sources and types of waste generated is important in order to design an appropriate solid waste management system. There are eight major classifications of solid waste generators which are residential, industrial, commercial, institutional, construction and demolition, municipal services, processed and agricultural (World Bank, 1999). Table 2.2 shows the sources and types of solid waste generated. MSW is really hard to manage because it consists of a diverse range of materials and have been mixed together.
2.1.2 MSW Generation
The economic and population growth experienced by Asian countries follow similar consumption trends as those found in the United State and other industrialize countries over the past century (World Bank, 1999). The quantities of waste increasing as the economy and population expand by year. The generation of waste is referring to the amount of material that enters the waste stream before recovery, composting, or combustion (Demirbas, 2011).
16
Table 2.2 Sources and Types of Solid Wastes (Sources: World Bank, 1999)
Source Typical waste generators Types of solid waste
Residential Single and multifamily dwellings
Food waste, paper, cardboard, plastics, textiles, leather, yard waste, wood, glass, metals, ashes, special wastes (bulky items, consumer electronics, white goods, batteries, oil, tires), and household hazardous wastes.
Industrial Light and heavy
manufacturing, fabrication, construction sites, power and chemical plants
Housekeeping wastes, packaging, food wastes, glass metals, special wastes, hazardous waste.
Commercial Stores, Hotels, restaurants, markets, office building, etc.
Paper, Cardboard, plastics, wood, food wastes, glass, metals, special wastes, hazardous wastes. Institutional Schools, hospitals, prisons,
government centers
Same as commercial. Construction
and demolition
New construction sites, road repair, renovation sites, demolition buildings
Wood, steel, concrete, dirt, etc.
Municipal services
Street cleaning, landscaping, parks, beaches, other recreational areas, water and wastewater treatment plants
Street sweepings, landscape and three trimmings, general wastes from parks, beaches, and other recreational areas, sludge.
Process Heavy and light
manufacturing, refineries, chemical plants, power plants, mineral extraction and processing
Industrial process wastes, scrap materials, off- specification products, slag, tailings
All of the above should be include as “municipal solid waste.” Agriculture Crops. Orchards, vineyards,
dairies, feedlots, farms
Spoiled food wastes, agriculture wastes, hazardous wastes (e.g., pesticides)
Malaysia is facing rapid economic growth since it achieves independence in 1957. Over the time, MSW generated does not only increases in volume, but the composition of waste also changes. The economic stability enhances the development especially in high populated areas and changes the population life style.
The population of Malaysia in 2008 was over 27 million with annual growth rate of 2 percent compared to the population in 2006 which was over 24 million people. The highest density of population is in Peninsular Malaysia with the population of 20
million. Meanwhile, the remaining 7 million lives in Sabah and Sarawak in Borneo Island.
Approximately, 7.34 million tonnes of solid waste were generated by Malaysians in 2005. Peninsular Malaysia alone generated 19, 100 tonnes of waste per day. The national averages for the amount of waste generated per capita vary from 0.5 to 0.8 kg per day. Meanwhile, in city areas, the generation of waste per capita per day escalated to 1.7 kg/cap/day. States in Malaysia with higher population density will generate more waste compared to the states with lower population density. Table 2.3 shows the relationship between the population growth and generation of solid waste in Peninsular Malaysia while, Table 2.4 shows a prediction of total generation of MSW in Kuala Lumpur in accordance to its population. Both data indicate that the generation of MSW increases as the number of population increases.
Table 2.3 Waste Generation in Peninsular Malaysia (tones/year)
2000 2001 2002 States Population Waste Generated Population Waste Generated Population Waste Generated Johor 2,252,882 1915 2,309,204 2002 2,366,934 2093 Kedah 1,557,259 1324 1,596,190 1384 1,636,095 1447 Kelantan 1,216,769 1034 1,247,188 1081 1,278,368 1131 Melaka 605,361 515 620,495 538 636,007 562 N. Sembilan 890,597 757 912,862 791 935,683 827 Pahang 1,126,000 957 1,154,150 1001 1,183,004 1046 Perak 1,126,000 1527 1,841,489 1579 1,887,527 1669 Perlis 230,000 196 235,750 204 241,644 214 Penang 1,279,470 1088 1,311,457 1137 1,344,243 1189 Selangor 3,325,261 2826 3,408,393 2955 3,493,602 3090 Terengganu 1,038,436 883 1,064,397 923 1,091,007 965 K. Lumpur 1,400,000 2520 1,435,000 2635 1,470,875 2755
Sources: Ministry of Housing and Local Government (MHLG), (online: 26th October 2011)
18
Table 2.4 Prediction of Total MSW Generation in Kuala Lumpur
Year Population of MSW MSW MSW
KL city (millions) kg/ca/day tonnes/day tonnes/year
2008 2.34 1.62 3798.88 1383642.0 2010 2.53 1.69 4274.86 1560323.9 2012 2.74 1.76 4810.49 1755828.9 2014 2.96 1.83 5413.23 1975828.9 2016 3.2 1.9 6091.49 2223393.9 2018 3.46 1.98 6854.73 2501976.5 2020 3.75 2.06 7713.61 2815467.7 2022 4.05 2.14 8680.09 3168232.9 2024 4.38 2.23 9767.68 3565203.2
Sources; Saeed et al. (2009)
2.1.3 Factor Affecting the Acceleration of Generation Rate of MSW
A fast growing population and economic in developing countries has encouraged an increased of solid waste generation especially in city area such as Kuala Lumpur (Budhiarta et. al. 2012). The three main factors that influenced MSW generation are:
(a) Urbanization and Economic Development (b) Lifestyle (Increase in Community Standard) (c) Increasing of Population
These factors are accelerating the MSW generation. The relationship between these factors and increased of MSW are review as follow:
(a) Urbanization and Economic Development
Urbanization and economic development are always linked with the increase of MSW. The World Bank (1999) pointed that the Asian countries are experiencing the
urban growth rates approximately 4% per year and this rate is expected to continue for several decades. Table 2.5 shows the relation between the estimated gross national products (GNP) in US dollar and MSW generated in Asian countries.
Table 2.5 Urban Municipal Solid waste Generation.
Country 1995 2025 GNP Per Capita (1995 US $) Urban Population (% of Total) Urban MSW Generation (kg/capita /day) GNP Per Capita (1995 US $) Urban Population (% of Total) Urban MSW Generation (kg/capita /day) Low Income 490 27.8 0.64 1, 050 48.8 0.6-1.0 Nepal 200 13.7 0.50 360 34.3 0.6 Bangladesh 240 18.3 0.49 440 40.0 0.6 Myanmar 240 26.2 0.45 580 47.3 0.6 Vietnam 240 20.8 0.55 580 39.0 0.7 Mongolia 310 60.9 0.60 560 76.5 0.9 India 340 26.8 0.46 620 45.2 0.7 Lao PDR 350 21.7 0.69 850 44.5 0.8 China 620 30.3 0.79 1, 500 54.5 0.9 Sri Lanka 700 22.4 0.89 1, 300 42.6 1.0 Middle Income 1, 410 37.6 0.73 3, 390 61.1 0.8-1.5 Indonesia 980 35.4 0.76 2, 400 60.7 1.0 Philippines 1, 050 54.2 0.52 2, 500 74.3 0.8 Thailand 2, 740 20.0 1.10 6, 650 39.1 1.5 Malaysia 3, 890 53.7 0.81 9, 400 72.7 1.4 High Income 30, 990 79.5 1.64 41, 140 88.2 1.1-4.5 Korea, Republic 9, 700 81.3 1.59 17, 600 93.7 1.4 Hong Kong 22, 990 95.0 5.07 31, 000 97.3 4.5 Singapore 26, 730 100 1.10 36, 000 100.0 1.1 Japan 36, 640 77.6 1.47 53, 500 84.9 1.3
Sources: World Bank, (1999)
Asian countries are divided into three categories, i.e. low income country, middle income country and high income country. Generally, the greater the economic activities of the country, the greater the amount of solid waste generated (World Bank, 1999). The generation of MSW in 2025 is predicted to have a range between 0.6 to 1.0 kg/capita/day in low income countries. Meanwhile, the generation of MSW in middle
20
income countries is ranging from 0.8 to 1.5 kg/capita/day. High income countries have higher prediction of the generation of MSW which is accounted to 1.1 to 4.5 kg/capita/day. Malaysia is one of the middle income countries with GNP of 3,890 US dollar per capita in 1995 and it is estimated to increase to 9,400 US dollar of GNP per capita in 2025. The average waste generated in 1995 was 0.81 kg/capita/day and is predicted to reach 1.4 kg/capita/day in 2025.
(b)Lifestyle (Increase in Community Standard)
The economic growth changes the lifestyle of the population. The increasing in waste generation depends on the economic status and lifestyle of the population of a country. These social changes influence the characteristic of given households, including family size, social status and wealth, residential location and community status (Monavari et. al. 2012). The income level of the population influences the way they spend the money (Parfitt et al., 2001). The consumption habit of a population also changes depending on the per-capital income (Jalil, 2010). The demands for better goods and service are increasing which enhance the increase of solid waste generated per capita (Minghua et al., 2009). The attitude towards shopping and high standard of living contributes to the rising up of solid waste produced every year (Saeed et al., 2009; Farrell and Jones, 2009).
Most households dispose of essentially similar types of wastes. Therefore, the transformation of lifestyle and living standard change the composition of waste produce (Yousuf and Rahman, 2007). The variation in waste generated at household is
depending on the socio-economic groups and habits. Table 2.6 and Table 2.7 showed composition of waste generated based on country and residential level income.
Table 2.6 Global Perspective on Urban Solid Waste Characteristics
Composition of Raw Waste
Low income Country (% wet weight) Middle income Country (% wet weight) High Income Country (% wet weight) Vegetable/ Putrescible 40 to 85 20 to 65 7 to 55
Paper and Carton 1 to 10 15 to 40 15 to 55
Plastics 1 to 11 2 to 13 2 to 20
Metal 1 to 5 1 to 5 3 to 20
Glass 1 to 10 1 to 10 4 to 10
Rubber, Misc 1 to 3 1 to 5 2 to 12
Fines (Sand, ash, broken glass)
15 to 50 15 to 40 5 to 20
Sources: World Bank, (2005).
Table 2.7 Average Percentage of Components in MSW Generated by Various Sources in Kuala Lumpur (Sources: Kathirvale et al., 2003)
Waste Composition Sources Residential High Income (%) Residential Medium Income (%) Residential Low Income (%) Commercial (%) Institutional (%) Food / Organic 30.84 38.42 54.04 41.48 22.36 Mix Paper 9.75 7.22 6.37 8.92 11.27 News Print 6.05 7.76 3.72 7.13 4.31
High Grade Paper - 1.02 - 0.35 -
Corrugated Paper 1.37 1.75 1.53 2.19 1.12 Plastic (Rigid) 3.85 3.57 1.90 3.56 3.56 Plastic (Film) 21.62 14.75 8.91 12.79 11.82 Plastic (Foam) 0.74 1.72 0.85 0.83 4.12 Pampers 6.49 7.58 5.83 3.80 1.69 Textiles 1.43 3.55 5.47 1.91 4.65 Rubber / Leather 0.48 1.78 1.46 0.80 2.07 Wood 5.83 1.39 0.86 0.96 9.84 Yard 6.12 1.12 2.03 5.75 0.87 Glass (Clear) 1.58 2.07 1.21 2.90 0.28 Glass (colored) 1.17 2.02 0.09 1.82 0.24 Ferrous 1.93 3.05 2.25 2.47 3.75 Non-Ferrous 0.17 0.00 0.18 0.55 1.55 Aluminum 0.34 0.08 0.39 0.25 0.04 Batteries/Hazards 0.22 0.00 - 0.29 0.06 Fine - 0.71 2.66 0.00 0.39 Other Organic 0.02 0.00 - 1.26 1.00 Other Inorganic - 0.27 0.25 - 8.05 Others - - - - 6.97 Total 100.00 100.00 100.00 100.00 100.00
22
(c) Increasing of Population
Cities in the developing countries are experiencing unprecedented population growth because they provide on average, greater economic and social benefits than rural areas (World Resources Institutes, 1996).
The increase of population is directly proportional to the cities growth. As a result, the solid wastes generated from human activities will continue to rise with the city development. Waste generated from the residential and commercial area is increasing corresponds to the increase of the total population (Hassan et al., 2001). The relationship between population and waste generation can be seen in Table 2.3 and Table 2.4.
2.1.4 Composition of MSW
The composition of waste is one of the main factors influencing the emission of gaseous from solid waste treatment, as different types of waste contain different amount of degradable organic carbon (DOC) and fossil carbon (IPCC, 2006). There are external factors such as geographical location, standard of living of population, energy source and weather that influence the composition of MSW generated (World Bank, 1999).
Heterogeneous characteristic of MSW causes a difficulty in determining the composition. Farrell and Jones, (2009) defined the composition of MSW as the everyday items such as product packaging, grass clippings, furniture, clothing, bottles, food scraps, newspaper, appliances and batteries.
The MSW stream in Malaysia is dominated by food waste/organic waste which comprises more than 40 percent of total waste generated (Karthivale et al., 2004; Periathamby et al., 2009). Table 2.8 showed data of waste composition generated in Malaysia from 1975 to 2005. Karthivale et al., (2004) reported that most of food waste was generated from residential premises compared to other sources such as institutional and commercial sectors and suggested that the income level of residents influences their lifestyle by observing the eating behavior of the residents. Low-income residents prefer to cook and eat in their house, while high income residents prefer to eat outside rather than cooking their own food.
Table 2.8 Waste Composition (Percentage wet weight) in Malaysia from 1975 to 2005.
Waste composition 1975 1980 1985 1990 1995 2000 2005 Organic 63.7 54.4 48.3 48.4 45.7 43.2 44.8 Paper 7.0 8.0 23.6 8.9 9.0 23.7 16.0 Plastic 2.5 0.4 9.4 3.0 3.9 11.2 15.0 Glass 2.5 0.4 4.0 3.0 3.9 3.2 3.0 Metal 6.4 2.2 5.9 4.6 5.1 4.2 3.3 Textiles 1.3 2.2 NA NA 2.1 1.5 2.8 Wood 6.5 1.8 NA NA NA 0.7 6.7 Others 0.9 0.3 8.8 32.1 4.3 12.3 8.4
Sources: Periathamby et al.(2009), NA, Not available.
Generally, the waste streams of middle income country like Malaysia mostly made up of organic waste. Therefore, the largest component or fraction of the composition may vary in different countries. The portion of MSW streams is different between regions (Asia, Africa, Europe, Oceania, and America) as shown in Table 2.9. Paper waste is higher than food waste in certain region such as Southern Africa, Northern Europe and Western Europe. However, food waste is the highest waste generated in most regions.
24
Table 2.9 MSW composition by Percent –Regional Defaults
Region Food Waste Paper/Cardboard Wood Textiles Rubber/Leather Plastics Metal Glass Others
Asia
Eastern Asia 26.2 18.8 3.5 3.5 1.0 14.3 2.7 3.1 7.4
South-Central Asia 40.3 11.3 7.9 2.5 0.8 6.4 3.8 3.5 21.9
South-Eastern Asia 43.5 12.9 9.9 2.7 0.9 7.2 3.3 4.0 16.3
Western Asia & Middle East 41.1 18.0 9.8 2.9 0.6 6.3 1.3 2.2 5.4
Africa Eastern Africa 53.9 7.7 7.0 1.7 1.1 5.5 1.8 2.3 11.6 Middle Africa 43.4 16.8 6.5 2.5 4.5 3.5 2.0 1.5 Northern Africa 51.1 16.5 2.0 2.5 4.5 3.5 2.0 1.5 Southern Africa 23 25.0 15.0 Western Africa 40.4 9.8 4.4 1.0 3.0 1.0 Europe Eastern Europe 30.1 21.8 7.5 4.7 1.4 6.2 3.6 10.0 14.6 Northern Europe 23.8 30.6 10.0 2.0 13.0 7.0 8.0 Southern Europe 36.9 17.0 10.6 Western Europe 24.2 27.5 11.0 Oceania
Australia and New Zealand 36.0 30.0 24.0
Rest of Oceana 67.5 6.0 2.5 America North America 33.9 23.2 6.2 3.9 1.4 8.5 4.6 6.5 9.8 Central America 43.8 13.7 13.5 2.6 1.8 6.7 2.6 3.7 12.3 South America 44.9 17.1 4.7 2.6 0.7 10.8 2.9 3.3 13.0 Caribbean 46.9 17.0 2.4 5.1 1.9 9.9 5.0 5.7 3.5 Sources: IPCC, (2006) 2 4