scoring your customers:
how often is often enough?
New FICO research shows how consumers’
scores are changing and what it means for
refreshing scores
One consequence of the current rise in credit delinquencies is that a growing percentage of borrowers’ risk profiles are changing quickly. As a result, if lenders aren’t getting updated account management scores frequently enough, they run the risk of making decisions with stale information on a significant portion of their borrowers’ accounts.
Lenders are asking: How often should I refresh the FICO® scores of my existing customers? How many of my customers will have a significant change in their score in the short term? How much will their scores change, and over what period of time?
FICO set out to find the answers. We examined recent “score migration” trends to determine what percentage of consumers’ scores change and the rate of change over different periods of time. Number 8 — October 2008
FICO examined the movement of FICO® scores
over time to determine how often lenders
should refresh their existing customers’ scores.
This paper highlights the key findings of the
study and offers guidance for best practices.
FICO looked at the extent of score migration in a matched sample of more than 100,000 active accounts in a prime bankcard portfolio over three-month, six-month and nine-month time periods. We performed the same study twice over two years and the results were consistent. Here’s what we found:
A significant percentage of scores migrated up or down more than 20 points over one, •
two or three quarters—from 25% in the first quarter to as much as 42% by the end of the third. Even though the majority of individuals’ scores remain relatively constant, a significant percent-age of the population will have score changes that are large enough to be problematic and warrant account management attention. (And results may be even greater on a non-prime portfolio.) A large change on even a minority of accounts in a portfolio may have a dramatic impact on portfolio risk and profitability.
The overall pattern of score migration remains highly consistent.
• At any given point in time,
approximately 25% of the population will have had a shift in their score of more than 20 points over the prior three months.
Higher scores tend to remain more stable over time.
• Scores in the lower range are more likely
to fluctuate, the majority moving downward. (A change in a low score does not necessarily mean that account is destined to continually decline.)
The most current score for a given account is the most predictive.
• Tracking the trend in that
account’s scores over time is less useful as a predictive tool.
We also examined a separate sample to evaluate how much scores change from month to month, and found:
A significant percentage of scores migrated up or down more than 20 points from month •
to month. Multiple one-month snapshots reinforced the findings of the quarterly study, with approximately 17% of scores migrating up or down more than 20 points each month. The findings suggest that refreshing FICO® scores of existing accounts on a quarterly basis at a minimum, and preferably monthly, would help lenders make more informed decisions on account treatment. Leveraging fresher, more accurate scores, lenders can not only target potential problems, but also identify candidates for more positive treatment and up-selling.
Key findings
insights
»
insights
»
How much do scores change over time?
To assess score volatility, our study examined how scores migrated over one, two and three quarters. We took two separate “snapshots,” first looking at scores in March 2007 and examining how they’d changed since July 2006, then looking at scores in March 2008 and examining how they’d changed since June of 2007. Because the results were similar, we will focus in this paper primarily on the second, more recent snapshot. The study only included accounts that were open at the beginning and still remained open at the end of each score migration evaluation period.
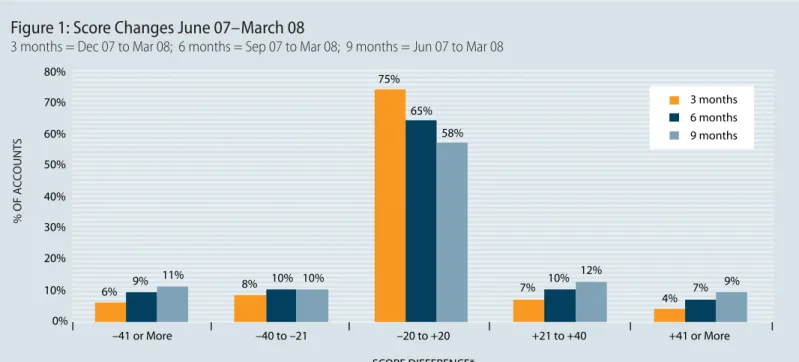
For the majority of accounts, scores did not change more than 20 points upward or downward in the prior quarter. However, 25%–27% of scores did change by more than 20 points over the preced-ing quarter, 35%–37% changed over the prior two quarters, and up to 44% changed by more than 20 points over the preceding three quarters. We further found that the longer the time period since score updates or refreshes, the more likely migration was to have occurred.
% OF A CC OUNT S SCORE DIFFERENCE* 0% 10% 20% 30% 40% 50% 60% 70% 80% 6% 8% 75% 7% 4% 9% 10% 65% 10% 7% 11% 10% 58% 12% 9% –41 or More –40 to –21 –20 to +20 +21 to +40 +41 or More 3 months 6 months 9 months
Figure 1: Score Changes June 07–March 08
3 months = Dec 07 to Mar 08; 6 months = Sep 07 to Mar 08; 9 months = Jun 07 to Mar 08
Most accounts’ FICO® scores stayed relatively stable over one, two and three quarters. However, 25% changed by more than 20 points in one quarter and up to 42% over three—significant enough to alter the balance of risk. The findings are consistent from one year to the next.
Which accounts’ scores are more likely to migrate?
FICO examined score ranges to see whether certain subpopulations are more prone to migration than others.
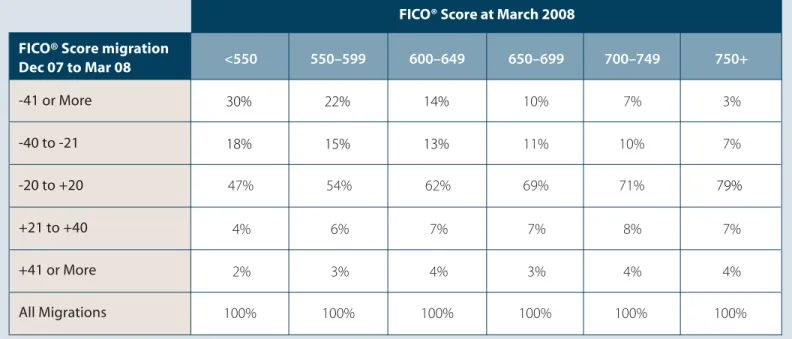
In Figure 2, we see that higher scores are more likely to remain stable. For example, 71% of records with a score of 700–749 had scored within 20 points of their score three months prior. Higher scores (750+) are even more likely to remain stable in a three-month period, with 79% of these records staying within 20 points of their three-month-old score.
Lower scores, on the other hand, are more likely to fluctuate. In the under-550 segment, 47% of the scores—less than half—had migrated less than 20 points in the prior quarter. Of accounts with scores under 650 that had migrated more than 20 points in the prior three-month period, the majority tended to move downward.
Higher-scoring accounts will likely include the majority of a lender’s best customers. Receiving frequent score updates and knowing when high-scoring accounts remain stable will guide lenders in taking appropriate action to retain their best customers. Conversely, lenders will want to know when their high-scoring accounts have seen a significant drop in score, even if this is only a small percentage of total accounts.
Higher scores remain more stable. Lower scores exhibit more fluctuation, with most of those that change by more than 20 points moving downward. this table demonstrates the score
movement over a quarter, by the final score at the end of the quarter. the figures shown are column percentages. For example, of the consumers who scored between 700 and 749 in March 2008, 8% of them scored 21 to 40 points lower one quarter earlier, and their score increased by 21 to 40 points between December 2007 and March 2008.
Figure 2: Three-Month Migration by Score Range
<550
550–599
600–649
650–699
700–749
750+
30%
22%
14%
10%
7%
3%
18%
15%
13%
11%
10%
7%
47%
54%
62%
69%
71%
79%
4%
6%
7%
7%
8%
7%
2%
3%
4%
3%
4%
4%
100%
100%
100%
100%
100%
100%
FICO® Score migration
Dec 07 to Mar 08
-41 or More
-40 to -21
-20 to +20
+21 to +40
+41 or More
All Migrations
insights
»
Does score migration signal a trend?
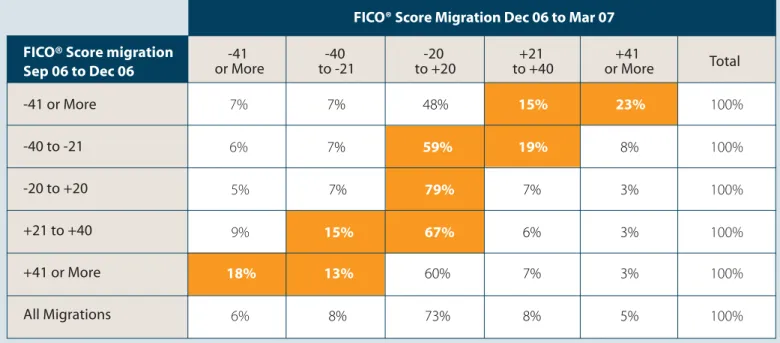
Does the movement of a score up or down make continued movement in that same direction, at roughly the same rate, more likely? While many lenders might intuitively think so, this is often not the case.
Figure 3 compares score migration in one three-month period (left column) with that in a second three-month period (top row). Of the borrowers whose scores dropped by more than 40 points in the first quarter, only 7% dropped at the same rate in the second quarter. However, 48% did not continue in a precipitous fall, and a significant percentage, 23%, bounced back with a 40+ point increase. Further analysis of this pattern reveals that the tendency to “bounce back” is exhibited more by high-scoring borrowers than those who score lower.
Therefore, score migration often doesn’t signal a trend. Lenders cannot know whether their customers’ scores will rise, fall or remain the same. This is why it is critical that a lender is always receiving refreshed scores at least quarterly.
Score migration in one quarter does not suggest that the migration will continue in the same direction, at the same rate, in subsequent quarters. As indicated by the shaded area, scores that fluctuate by more than 20 points have a greater tendency to “return to the mean” (either rebounding from a drop or falling back from an increase) than they do of continuing with the current trend. This pattern is stronger with higher-scoring accounts than it is with lower-scoring ones.
Figure 3: Score Migrations in Two Consecutive Quarters
-41
or More
to -21
-40
to +20
-20
to +40
+21
or More
+41
Total
7%
7%
48%
15%
23%
100%
6%
7%
59%
19%
8%
100%
5%
7%
79%
7%
3%
100%
9%
15%
67%
6%
3%
100%
18%
13%
60%
7%
3%
100%
6%
8%
73%
8%
5%
100%
FICO® Score migration
Sep 06 to Dec 06
-41 or More
-40 to -21
-20 to +20
+21 to +40
+41 or More
All Migrations
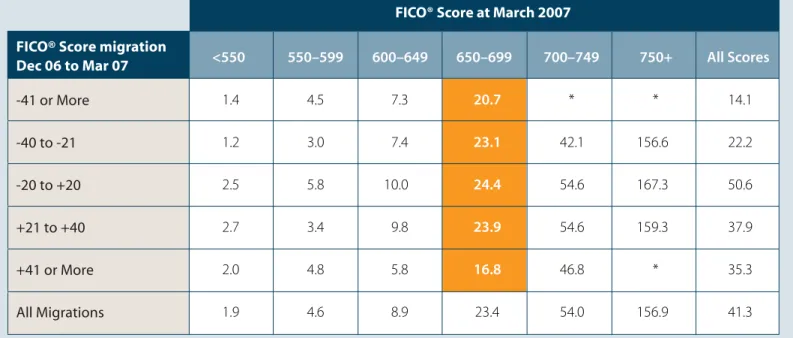
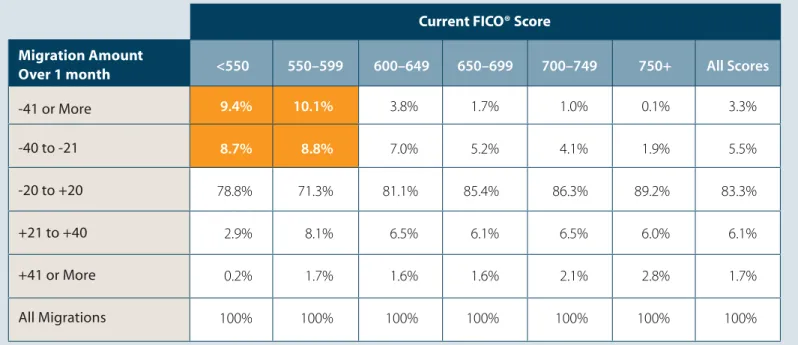
Is the change from a recent score, or the trend of scores over time, predictive above and beyond the current score? Does a record with a score that fell from 700 to 650 last quarter present a higher risk than one that increased from 600 to 650 over the last quarter? To find out, we tracked account performance over a 14-month period to see whether score migration in the three months leading up to that period was predictive of “good” or “bad” performance.
Figure 4 shows the good/bad odds by score interval (columns), against the three-month migra-tion amount (rows). If score migramigra-tion were predictive, then we would expect the good/bad odds depicted in the current observation score columns to vary widely between downward and upward migration. While there is some variation, the odds of good or bad performance tend to stay within a relatively narrow range.
Looking at the shaded column of 650 to 699, for example, we see that the odds are fairly close (20.7 to 1—16.8 to 1) when the three-month migration is greater than plus or minus 40 points.
Score migration and
»
account performance
The direction of score migration is not a good risk predictor, as the odds are fairly consistent regardless of the direction of score migration. That means that tracking FICO® score migration yields little risk separation, and therefore isn’t predictive above and beyond the current score.
* = low bad counts
Figure 4: Good-Bad Performance Odds by Score and Migration Amount
<550
550–599
600–649
650–699
700–749
750+
All Scores
FICO® Score migration
Dec 06 to Mar 07
-41 or More
-40 to -21
-20 to +20
+21 to +40
+41 or More
All Migrations
FICO® Score at March 2007
1.4
4.5
7.3
20.7
*
*
14.1
1.2
3.0
7.4
23.1
42.1
156.6
22.2
2.5
5.8
10.0
24.4
54.6
167.3
50.6
2.7
3.4
9.8
23.9
54.6
159.3
37.9
2.0
4.8
5.8
16.8
46.8
*
35.3
1.9
4.6
8.9
23.4
54.0
156.9
41.3
insights
»
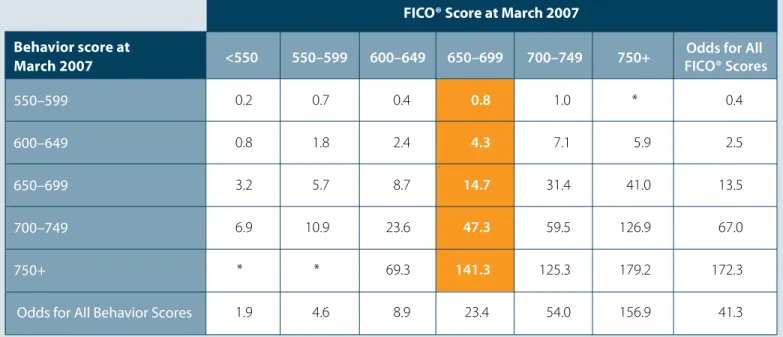
A more useful analysis is to correlate an account’s current FICO® score with the lending institu-tion’s own behavior score, which reflects patterns in account behavior (e.g., late payment fees, cash advances).
Here we see much wider variation in the good/bad odds—for example, in the 650–699 range, from 0.8 to 1 among those with lower behavior scores to 141.3 to 1 where behavior scores are higher. Factoring in a behavior score makes it easier for the lender to identify “swap sets” and determine account treatment accordingly.
(“Swap sets” refer to accounts that might be treated one way when using just the FICO score for decisioning, but merit different treatment when a second tool is incorporated into the decision-ing process. For example, a lender usdecision-ing just the FICO score might decide to withhold positive treatment from customers who score below 650. However, if both the FICO score and behavior score are used, the lender might extend positive treatment to customers with a FICO score below 650 but a behavior score greater than 750, as these customers have fairly high performance odds of 69.3 to 1).
Combining a current FICO® score with a behavior score yields better risk separation. The behavior score is much stronger at rank-ordering risk than is score migration (as shown in Figure 4).
* = low bad counts
Figure 5: Performance Odds by FICO® Score and Behavior Score
<550
550–599
600–649
650–699
700–749
750+
FICO® Scores
Odds for All
Behavior score at
March 2007
550–599
600–649
650–699
700–749
750+
Odds for All Behavior Scores
FICO® Score at March 2007
0.2
0.7
0.4
0.8
1.0
*
0.4
0.8
1.8
2.4
4.3
7.1
5.9
2.5
3.2
5.7
8.7
14.7
31.4
41.0
13.5
6.9
10.9
23.6
47.3
59.5
126.9
67.0
*
*
69.3
141.3
125.3
179.2
172.3
1.9
4.6
8.9
23.4
54.0
156.9
41.3
How much more predictive is a fresher score?
Using the 14-month good/bad odds performance calculations, we conducted a score cutoff sensitivity analysis to see to what extent a current score outperforms an older one as a predictor of risk. The results, as shown in Figure 6 for the first snapshot of accounts studied, illustrate the value of the fresher score.
The first column in the chart shows sample score cutoffs. The next two columns show the percentage of accounts falling above and below each cutoff. For example, at a cutoff of 670, 86.3% of the accounts would pass and 13.7% would not.
The next two columns show the percentages of accounts that migrated above or below the cutoff three months after the initial observation date. At the same 670 cutoff, 1.3% of the accounts migrat-ed from below to above the cutoff, and 1.4% migratmigrat-ed from above to below. (In order to focus on substantial shifts in score and odds, we applied a 10-point buffer, restricting the analysis to accounts that moved 10 points or more.)
The last two columns illustrate the odds on the “swap-in” (migrated above) and “swap-out” (migrated below) groups. At a cutoff of 670, the odds-to-score relationship for those whose scores migrated above the cutoff was 29.1 to 1, versus 10.1 to 1 for those records that dropped below 670.
The fact that the “migrated below” records have much worse odds than the “migrated above” records means that the change in score reflected a real change in the risk level of the consumers involved. The group that migrated above in the three-month interval did indeed perform better over the subsequent 14-month period than those whose scores declined.
This demonstrates that the most current score is more predictive, enabling lenders to make more informed decisions.
Figure 6: Migration Around Cutoff Score
Dec 06
Cutoff
Score
670
690
700
March 07
Beginning of Migration
End of Migration
Swap Set Odds
% Above
Cutoff
% Below
Cutoff
Migrated
Above
Migrated
Below
Migrated Above
(swap-in)
Migrated Below
(swap-out)
86.3%
13.7%
1.3%
1.4%
29.1
10.1
81.4%
18.6%
1.5%
1.8%
46.7
14.9
insights
»
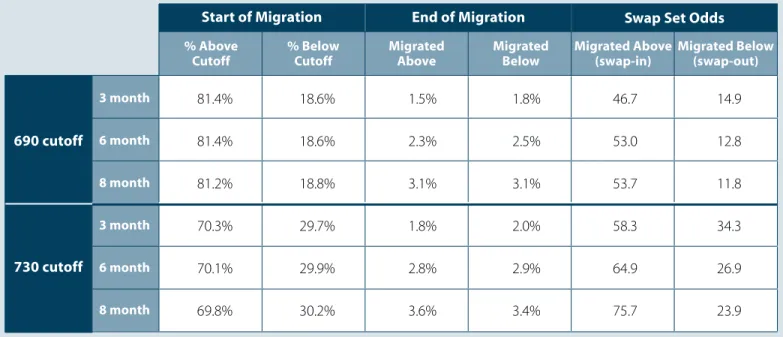
Furthermore, as shown below, the more time that elapses between score updates, the greater the discrepancy between the “migrated above” and “migrated below” odds.
Figure 7 compares odds for two cutoff examples of 690 and 730, where the time between score updates is increased from three to eight months. The older scores exhibit larger swap sets—for example, at the 690 cutoff, 3.1% migrated above at eight months compared to 1.5% at three months. They also show greater differences between the actual risk of the swap sets. For example, after eight months at the 730 cutoff, the odds for the “migrated above” set are 75.7 to 1 versus 23.9 to 1 for the “migrated below” segment, compared with 58.3 to 1 versus 34.3 to 1 after three months. The older scores clearly provide a less accurate assessment of risk. Lenders using the older scores are at greater risk of making suboptimal decisions on consumers whose scores have changed.
The more time between score updates, the greater the discrepancy between the “migrated above” and “migrated below” odds. When the scores are 6-8 months old, the swap-in (migrate above) odds are between three and four times the swap-out (migrate below) odds.
Figure 7: Migration Around Score Cutoff Over Longer Periods
690 cutoff
730 cutoff
Start of Migration
End of Migration
Swap Set Odds
3 month 6 month 8 month 3 month 6 month 8 month % Above
Cutoff % Below Cutoff MigratedAbove MigratedBelow Migrated Above (swap-in) Migrated Below (swap-out)
81.4%
18.6%
1.5%
1.8%
46.7
14.9
81.4%
18.6%
2.3%
2.5%
53.0
12.8
81.2%
18.8%
3.1%
3.1%
53.7
11.8
70.3%
29.7%
1.8%
2.0%
58.3
34.3
70.1%
29.9%
2.8%
2.9%
64.9
26.9
69.8%
30.2%
3.6%
3.4%
75.7
23.9
Are monthly score updates needed?
We have observed that refreshing scores at least quarterly will help lenders make better customer treatment decisions. Would more frequent updates, then, be even more effective in helping lenders manage risk?
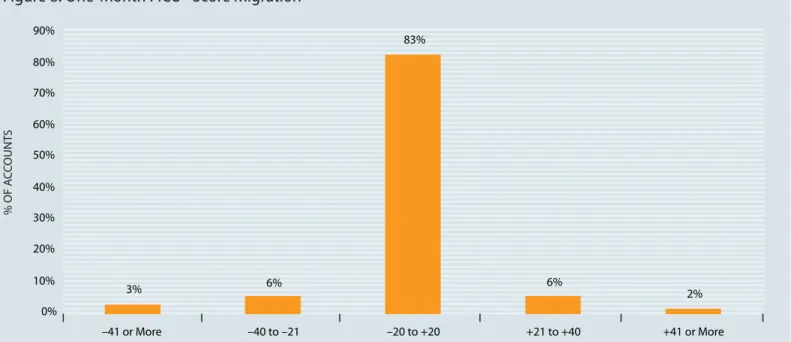
To answer this, we used a separate bankcard dataset to examine score migration at one-month intervals. Figure 8 shows that, as in the three-month findings, most of these scores do not change more than 20 points in one month. However, approximately 17% of accounts on average change more than 20 points, with a slight trend towards decreasing scores.
While Figure 8 shows only the results of one monthly snapshot, the percentages are consistent with the other months we studied.
0% 10% 20% 30% 40% 50% 60% % OF AC COUNT S 70% 80% 90% 2% 6% 83% 6% 3% –41 or More –40 to –21 –20 to +20 +21 to +40 +41 or More
Figure 8: One-Month FICO® Score Migration
The Insights white paper series
insights
»
As noted earlier, higher scores tend to stay more stable. Figure 9 illustrates that the accounts that experienced the most one-month decline were those in the under-600 range.
FICO considers the best practice to be monthly score refreshes. We see more lenders moving from quarterly to monthly refreshes, and lenders also employ trigger mechanisms for pulling fresh scores on particular accounts in certain situations: “push” triggers, instructing credit bureaus to
supply a fresh score when something significant, such as a new delinquency, happens on a consumer’s credit file; and “pull” triggers that tell the lender to obtain a fresh score, for example, when the customer is seeking a line increase.
Smart lenders want to be sure they are not caught unaware of borrowing activity that may turn yesterday’s “good” customer into a future write-off.
Putting fresh scores to work
In today’s credit environment, there is less margin for errors. That is why the industry’s largest lend-ers are not making decisions based on scores more than three months old. Rigorous analysis of score migration, combined with experience from leading lenders, affirms that frequent FICO® score Higher scores tend to stay stable from month to month. Lower scores fluctuate more. As shown in the upper left shaded boxes, most migration among accounts in the under-600 range is downward.