Factors affecting social interaction on Social Network Sites: The Facebook Case
Purpose -Our paper focuses on understanding which factors affect the social interaction in the
case of Facebook. Many authors point out the great potential of these networks for social interaction and as conduits of information. However, studies show that the topology of the network is disconnected, consisting of small sub-networks that make Facebook unsuitable for disseminating information. This situation has created the need to introduce exogenous factors, aimed at boosting and providing cohesion to the network structure. In this context, we test the following question: how exogenous and endogenous factors contribute to encouraging social interaction on Facebook.
Design/methodology/approach - For the analysis of social interaction on Facebook, a population
consisting of all the followers of the walls of 10 corporate social networks was used. From the total 269,424 users analysed, a stratified sample of 132 followers was obtained and networks were built for each of them. We then proceeded to search for each follower's friends and friends of friends to build the social network up to the fourth level, obtaining a total of 132 subnets with 1,628,074 links between them. To determine the impact of both exogenous and endogenous factors in the interaction of the network we performed a causal analysis.
Findings - The results obtained from this study provide empirical evidence on the adequacy of
companies’ dynamization measures used and how exogenous and endogenous factors influence the social interaction on Facebook. Thus, our results show that exogenous factors, such as the activity of the community manager and the digital marketing investment in the network, do not have a significant effect on the interaction. On the other hand, endogenous factors, such as network density and clustering, have a positive effect on the trigger of social interaction between the followers. Therefore, companies must consider the importance of the structural factors that characterize network followers, such as density or clustering coefficient, to be able to interpret and optimize them to obtain higher levels of social interaction.
Originality/value - This is one of a few papers that examine interactions in social network sites,
particularly in corporate network sites in Facebook. The results expose the importance for organizations to have reliable information on the patterns of interaction to properly manage the resources allocated for this purpose in SNS.
1. Introduction
In recent years, Social Network Sites (SNS) have become a popular way of spreading and sharing information. In fact, one of the main features of social networks is their ability to spread information through social interactions (Savolainen, 2001; Boyd and Ellison, 2008; Ferguson, 2008; Kuo-Hsiang, et al., 2012; Shu and Chuang, 2011; Aral and Walker, 2012; Chen et al., 2014; Wang and Vaughan, 2014). Cha et al. (2009), and Bernoff and Li (2008) point out the importance of SNS in the economy, and report how companies devote billions of dollars (Euros) to advertisement in social networks worldwide. Similarly, marketers are particularly interested in understanding how viral marketing campaigns work in comparison to traditional forms of communication (Kozinets, 2002; Nail, 2005; Leskovec et al., 2006; Trusov et al., 2009; Kalampokis et al., 2013). In this sense, Adar and Adamic (2005), Gruhl et al. (2004), and Alburquerque et al. (2012) indicate that the
classical information dissemination models explaining how information spreads in networks have been replaced with studies aimed at understanding the word-of-mouth effect (WOM). There is a large literature developed on this research line, mainly focused on the understanding of the impact of SNS on firms’ performance (Scullin et al., 2004; Yang et al., 2012; Luo et al., 2013) as well as consumers’ behaviour (Rishika et al., 2013; Goh et al., 2013). However, there are few studies that characterize which factors affect social interaction on SNS (Adar and Adamic, 2005; Cha et al., 2009; Trusov et al., 2009; Godes and Magzlin, 2009; Hsiu-Fen Lin, 2013; Schoen et al., 2013; Goh et al., 2013; Miller and Tucker, 2013; Lucia-Palacios et al., 2014).
In order to understand this question, our paper focuses on understanding which factors affect social interaction for the case of Facebook. According to Cha et al. (2009) and Trusov et al. (2009), the first factor that affects social interaction is the topology and structure of the network itself. In terms of network topology, the situation is paradoxical. On one hand, Adar and Adamic (2005), and Mayzlin and Godes (2004) explain the great potential of these networks for social interaction and as conduits of information. This is reflected on the exponential expansion of Facebook; for example, on July 2009 it reached 250 million users, on September 15th of that year it exceeded 300 million users, and it currently has more than 800 million users, providing large size networks and the ability to disseminate information. On the other hand, studies also show that the topology of the network is disconnected, consisting of small sub-networks with a low value of clustering (Cha et al., 2009) that make Facebook unsuitable for disseminating information.
This situation has created the need to introduce exogenous factors, aimed at boosting and providing cohesion to the network structure. Thus, companies have introduced a series of dynamization measures such as corporate web pages (walls), community managers, incentives and prizes, with the aim of promoting social interaction in the network (Godes and Mayzlin, 2004; Liu, 2006; Rosen, 2000). According to Trusov et al. (2009), and Ansari et al. (2008), the question that arises is whether these measures are actually efficient in stimulating interactions on social networks. In this context, a new line of research is focusing on understanding the dynamics of interaction through viral marketing (Leskovec et al., 2007; Adar and Adamic, 2005; Gruhl et al., 2004; Dodds et al., 2003; Lueg and Fischer; 2003; Boyd and Ellison, 2008; Dholakia et al., 2004; Kozinets, 2002).
Our paper addresses the effect of these two factors (endogenous and exogenous) on social interaction in Social Network Sites (SNS). In particular, we test the following question: How exogenous and endogenous factors contribute to encouraging social interaction on Facebook. For this purpose, we use survey data collected from a representative sample of Facebook, comprising
10 corporate social networks. Moreover, for practitioners, the results of this analysis are important because multimillion-dollar investments to disseminate products and achieve brand relevance are being reallocated from traditional campaigns to interaction with consumers through social networking. Our study adds to the extant research on SNS by specifying the influence of endogenous and exogenous factors on Facebook’s social interaction, and by providing new empirical evidence for understanding the process of information dissemination in social network sites. In the next section, we present the conceptual framework and hypotheses. The following section describes our research methodology, including data collection and construct of measurement. Afterwards, our data analysis and results are provided. Finally, we present the discussion and managerial implications of the findings, and conclude with limitations and suggestions for future research.
2. Conceptual Framework and Hypotheses
A network is composed by a set of points called nodes, with connections between them, called links or ties (Borgatti and Halgin, 2011). In the context of Social Network Sites (SNS), each agent or follower is considered a node of the network, while the word of mouth (WOM) interactions among agents are the links between them.
The first element to be considered is the social interaction of network sites. In this regard, Ferguson (2008) and Godes (2004) point out that a social network is a place which aims to provide users with the ability to relate, communicate, share content and create communities. Other researchers define it as a mechanism for democratization of information, which turns people into both receivers and producers of content (Hawkins et al., 2007). For Boyd and Ellison (2008), Zhang and Jastram (2006), and Jiang (2014) social networks a medium that enables users to submit a public or semi-public profile within a bounded system, to have a list of other users with whom they connect to see and explore their connections, and to observe what others do within the system.
The social interaction feature generated in social networks is derived from their global dimension, which implies the interconnection of individuals without the constrained of physical boundaries. We follow Schutz (1967) and in this paper we consider social interaction as 'social reality' or 'Mitwelt perspective' (Schutz, 1967; Ritzer, 2007) in which individuals relate to the world by socially interacting with others. This perspective corresponds to the type of interaction that is generated within corporate social networks, where long distances tend to make face to face interaction impossible.
particularly the dynamics of information dissemination through viral marketing (Cha et al., 2009; Gruhl et al., 2004; Leskovec et al., 2007; Kai-Shuan, 2013; Lucia-Palacios et al., 2014). In this context, there are two main lines of research: the first deals with the study of the dynamics of the network, and analyses the introduction of certain mechanisms, network exogenous factors, which can stimulate social interaction in social network sites (Trusov et al., 2009; Godes and Mayzlin, 2004; Liu, 2006; Rosen, 2000). The second line deals with the analysis of the network structure, nodes and links, and how structural properties affect its dynamics (Cha et al., 2009; Boyd and Ellison, 2008; Villanueva et al., 2008; Abbasi et al., 2012; Martínez-Torres et al., 2011).
2.1. Exogenous Factors
Regarding the efficiency of exogenous mechanisms and the impact of its dynamics on SNS, Trusov et al. (2009) consider that the performance of these mechanisms has a positive impact on social interaction, both from the point of view of the increase in communication between agents, and from the point of view of its retention and permanence in the network. There are several mechanisms to boost people’s participation in the networks: the introduction of the community manager (Perguson, 2008; Mayzlin and Godes, 2004); the creation of corporate web pages (walls), where information activities are developed by the companies themselves (Clifford-Marsh, 2009; Mayzlin and Godes, 2004); a fan page that implements marketing actions, such as creating lists of friends or investing in gifts, etc. These mechanisms provide a measurement system, which gives immediate feedback, allowing companies to evaluate the efficiency of the publicity by, for example, measuring the number of users who click on the "I like" button.
Our study focuses on two types of exogenous factors: the activity of the Community Manager and the firms' digital marketing investment. Bernoff and Li (2008) point out that a Community Manager is the professional in charge of building and managing the online community surrounding an Internet brand, creating and maintaining stable and long-lasting relationships with its followers. Cha et al. (2009) consider that the main function of this professional is the creation of attractive and quality material (messages, videos, and blogs, for example), analyzing the reaction of the users with the objective of retaining the followers and making the firm's information more visible. Gruhl et al. (2004), Cha et al. (2009), Ji and Wayne Fu (2013) found that the Community Manager increases the visibility of the firm's website, depending on the frequency of his participation on the social network, as well as the quality and variety of the contents displayed. Leskovec et al. (2006) and Liu (2006) point out that the Community Manager creates an effective communication among the followers, fostering the interaction among them. These Authors also indicate that the success of the Community Manager stems from becoming friends with the user to transform him into a
client through the loyalty of the followers. Therefore, we can anticipate that the influence of Community Manager Activities will be positive on the interaction in social networks. Accordingly, we propose:
H1a: There is a positive and significant relation between the activities carried out by the Community Manager and the social interaction on SNS.
Recently, firms that are investing in Marketing with the aim to promote its brand are progressively migrating from the traditional Marketing tools to Digital Marketing. This investment is reflected on the creation of web sites, blogs, prizes, etc. Goh et al. (2013) analyse the content of a firm’s Facebook page, and find that it has a strong effect on follower’s behaviour. Rishika et al. (2013) show that followers increase the website visits, frequency, and profitability regarding social media participation and transactions. These Authors conclude that the main goal of the digital marketing investment is to generate loyalty within the followers to transform them into clients. In general, it has been found that an active investment in active digital marketing is effective in managing firms’ social presence among the followers of SNS and in the promotion of interaction between users in the social network (Godes and Mayzlin 2009). Those findings suggest that active digital marketing investment is a strategic benefit to firms which decide to actively participate in social media, considering greater visibility of its brand (Goh et al., 2013), greater interaction with its website (Gruhl et al., 2004), and greater retention of fans (Godes and Mayzlin 2009). Therefore, we can anticipate that the influence of digital marketing investment will be positive on the interaction in social networks. Accordingly, we propose:
H1b: There is a positive and significant relation between the firm's digital marketing investment and social interaction on SNS.
2.2. Endogenous factors: Structure of SNS
The study of endogenous factors is aimed at understanding the dynamics of social interaction in SNS through the analysis of network’s structure properties. As Monge and Contractor (2003) have indicated, the ability to respond quickly to stimuli, or the diffusion rate are all affected by the patterns of connections among users. For example, networks in which most users have connections at short distances to others are likely to display a rapid diffusion rate. Rosen (2000), and Gruhl et al. (2004) noted that greater cohesion in the network has a positive impact on social interaction, increasing contacts between agents or followers.
The cohesion of a network may be measured by density (Knoke and Kuklinski, 1982), which is a ratio between the links present in the network and the total of all possible links between partners. Thus, depending on this variable, networks may be defined as sparse, if they have low contacts,
and as dense, if they have high number of links. Therefore, we can anticipate that network density will positively influence the interaction on social networks. Accordingly, we propose:
H2a: There is a positive and significant relation between network's density and the social interaction on SNS.
Borgatti and Halgin (2011) also showed that there is a heterogeneous distribution of connections’ characteristic within social networks as a result of the affinity and privileged relations between the agents, which means that there will be different degrees of cohesion in the networks and therefore different levels of social interaction. Heterogeneity may occur because partners, who share similar characteristics, interact more among themselves than with partners that are dissimilar. Affinity results in denser areas where the network's levels of interconnection between partners (clustering) are highest. Clustering allows quick exchanges and the integration of a wide range of sources leading to greater interaction (Schilling and Phelps, 2007), and better transmission of information. Therefore, we can anticipate that the influence of clustering on the interaction in social networks will be positive. Accordingly, we propose:
H2b: There is a positive and significant relation between the network's clustering and the social interaction in SNS.
---Insert Figure 1 about here---
3. Methodology and Empirical Study
For the analysis of social interaction in Facebook, a population consisting of all the followers of the walls of 10 corporate social networks was used (Adidas Football, Cinesa, El Corte Ingles, Guia Repsol, Mango, Pepsi Spain, Privalia Spain, Telepizza, Vodafone Spain and Vueling). The selection of these 10 corporate social networks has been primarily based on criteria of sector diversity; we have included sectors such as shopping, sports, leisure, drinks, food, phone companies, and travel. We have searched for the most popular social networks in Spain, that is, those with the greatest number of followers, ensuring a significant sample. Interaction data was obtained during a 14 months period ranging from June 2010 to July 2011. "I like" and / or comments made on the walls of each corporate network were collected from 738,813 clicks made by 269,424 users. Following Dholakia et al. (2004), and Enders et al. (2008) and in order to determine the dynamics of the network, we have segmented the frequency of participation on each corporate fan page into five groups: those who took part only once, those who participated between 2 and 6 times, between 7 and 14 times, 15 and 42 times, and more than 43 times.
endogenous factors, from the total 269,424 users analysed, a stratified sample of 132 followers was obtained. Networks were built for these 132 followers, and then we searched for each follower's friends, friends of friends, up to the fourth level, obtaining a total of 132 subnets with 1,628,074 links between them. Moreover, the contacts among the followers were classified according to their interaction frequency: low intensity (once) and high intensity (over 43 times).
---Insert Figure 2 about here---
3.1 Measures Dependent Variable
For the dependent variable we use social interaction in the corporate network. Following Enders et al. (2008), Kozinets (2002), and Baltar and Brunet (2012) we have measured social interaction through the number of ‘clicks’ and ‘comments' on a corporate wall per month. The underlying assumption is that if the number of 'clicks' and 'comments' is high, the interaction of the social network is greater than if they are low. The reliability between the two items was significant (Cronbach alpha=0.81).
Independent Variables (Exogenous Factors)
As was indicated above, two measures were considered. The first measure was the activity of Community Manager. To examine the Community Manager activities, we identify two dimensions: intensity and richness. The first dimension captures the quantity of the effort, while the second represents the quality of the effort. Following Dholakia et al. (204), Godes and Mayzlin (2004), and Miller and Tucker (2013) intensity of the Community Manager’s activities was measured as the number of activities performed per unit of month. Thus, a higher intensity of activities means a greater volume of messages and contents uploaded to the network. Our second dimension, richness of the Community Manager’s activities, represents the diversity of the messages posted. Following Daft and Lengel (1986), we conceptualize this diversity as the total number of media used average among the diverse type of media used with respect the total number of media considered (for example videos, messages, and blog). Thus, the higher diversity, the greater number of media used by the Community Manager. The reliability between the two items was significant (Cronbach alpha=0.73).
The second measure was the digital marketing investment in the corporate network. Following Kleis et al. (2012) and Kozinets (2002), the investment made by companies was measured as a ratio between the amount in Euros of investment on digital marketing and the number of users.
The degree of cohesion of a social network is captured by Density and Clustering. Following Freeman (1977), we measured the density of the network as the ratio between the number of existing relationships and potential relations, and we expressed it as a percentage. On a monthly basis we counted who was related to whom, and divided it by the total possible number of relationships.
The second measure is Clustering. Following Watts and Strogatz (1998), clustering measures the probability that 'the friend of my friend is also my friend', and provides insight into what is referred to as the neighbourhood structure of the network. We calculate the clustering coefficient as the ratio of triples that form a triangle to the total possible number of triples in the network. We counted monthly number of triangles in the network, taking into account the total number of relationships that had or may have (Newman, 2003).
Control variables
In addition to the main variables, following Adar and Adamic (2005), Cha et al. (2009), Trusov et al. (2009), Miller and Tucker (2013), and Lucia-Palacios et al. (2014) set of control variables was included. To control for the possibility that larger networks have more social interaction, we considered the size of the network, measured through the number of nodes of each corporate social network.
Number of friends. We consider that the existence of a greater or lesser number of friends produces a higher affinity in the network, and results in increased social interaction therein.
We consider seniority as a factor that affects social interaction in a network and thus believe that greater seniority means greater social interaction. We measure seniority or age as the amount of time spent per month by an agent or follower of the social network.
4. Analysis and Results
4.1 Descriptive Analysis
Table 1 describes the interactions of the 10 corporate networks. It shows that social interaction in corporate social networking via Facebook is mostly done by clicking on "I like", except for Vueling, where the while the percentage of followers interacting by commenting is higher.
---Insert Table 1 about here---
Table 2 shows on more detailed the number of comments and clicks on “I like” of each corporate social network, segmented according to frequency of interaction.
Table 2 reveals similar trends for the 10 networks; 95 % of followers interact fewer than six times and 61 % of people who access a corporate social network do so only once. When analysing the time of active presence or interaction from the first entry of unique users during the 14 months that the study lasted, as set out in Figure 3 we found that the 74.84% remains active for a month, after which only 15.21% of users remain active for two months, with this rate decreasing as time passes by. As shown in Figure 4 the distribution curve ranges temporary active presence is long tail (Anderson, 2005; Enders et al., 2008), as the temporal range extends asymptotically reducing the residence time of unique users. The ‘Long Tail’ concept establishes an inverse relationship between the frequency of followers' interaction on social networks and the number of contacts they possess, concluding that nodes which interact most in social networks have fewer friends than those who seldom interact.
---Insert Figure 3 about here--- ---Insert Figure 4 about here---
Figure 5 shows more on detail the evolution of interactions in each corporate page on a monthly basis and the flows of interaction observed in each one. The trends for the evolution of the social interaction vary from firm to firm with each of them following a different trajectory.
---Insert Figure 5 about here---
Adidas Football’s corporate social network shows a monthly downward trend observed in both the clicks on "I Like" and comments made by followers. Several peaks of activity can be seen in July 2010 during the World Cup; in January 2011, as a result of the Christmas season and; during March and April, corresponding to the Spanish Soccer League and the King’s Cup, both competitions focused on Real Madrid and Barcelona. For its part, Cinesa’s corporate social network displays a decreasing trend with a faster decline in the second half of the first period. Two clearly marked peaks can be seen, the first in July 2010, where the promotional effect of the "double" has its maximum impact, and the second in December 2010, when the four-day "double" is released and can be used for a long weekend earlier that month. El Corte Ingles shows higher levels of activity in the spring of 2011 with the campaign "It's finally spring". The social network for Guia Repsol clearly shows a decreasing trend for most of the period studied with a peak in July 2010. Mango shows a very homogeneous and stable trend in both curves of interaction. Nevertheless, two peaks stand out: (1) the month of October 2010, coinciding with the MANGO FASHION AWARDS, with the presence of Jean-Paul Gaultier and Scarlett Johansson together with other personalities from the worlds of fashion, film and politics; (2) April 2011, coinciding with night-time events held in stores in Milan, Barcelona, Lisbon, Stockholm, New York, Berlin and Kuala Lumpur. Overall, it is the most
consistent corporate social network with 96% of clicks on "I Like" and with the highest ratio of clicks / users of those observed in this study, showing the highest level of loyalty among its followers. Pepsi Spain shows an overall increasing trend with the social interaction via comments remaining stable. It is noteworthy that during the first four months of observation, there is greater interaction from comments than from "I Like" clicks, while in the remaining ten months of the observation the trend is reversed. Two peaks of interaction correspond to November and December 2010, when a drawing for various video game consoles and an intense debate about the Spanish Football League took place, as well as the December’s campaign with Christmas greetings from Fernando Torres. In June and July 2011, Pepsi’s DJ competition attracts a large number of interactions. The next corporate social network, Privalia Spain has an increasing trend on "I Like" clicks while a decreasing trend on comments. From the evolution it stands out June 2010, where the maximum level of social interaction is achieved through feedback on various spring competitions, handbags and jewellery plus the launch of a new blog and, May 2011 with the Munich shoe design competition. On the other hand in May and June of 2011 higher levels of clicks on " I Like " are achieved with a battery of competitions, where five iPads, fifty 100€ checks, other prices are offered. Telepizza displays on "I Like" clicking. On June 2010, there were various competitions based on the World Cup and Formula 1. On March 2011 the launch of an app to place orders had a high leverage effect on the interactions achieved. Vodafone Spain shows a growing trend in both forms of interaction, with clicks on "I Like" displaying a much faster growth trend, particularly on the months of March, May and July 2011 mainly where exclusive mobile deals and football were the theme. Finally, Vueling corporate social page, has an increasing trend but with a low growth rate. The month of March 2011 stands out as truly successful thanks to Vueling Day in which 100 airline tickets were given away in a drawing.
4.2 Causal analysis
As discussed above, the 132 individuals who interact in the 132 social networks under consideration were chosen at a nodal level. This level of analysis is also consistent with the analysis of the influence of endogenous factors.
Table 3 shows the correlation between the exogenous variables, and Table 4 represents the interaction and causal analysis of endogenous and exogenous factors.
---Insert Tables 3 about here--- ---Insert Table 4 about here---
specifications. Model 1 contains the dependent variable as a function of the three control variables. Model 2 captures the dependent variable as a function of density and clustering, and the control variables. Model 3 captures the dependent variable as a function of Community Manager and investment, and the control variables. Model fits are acceptable with significant chi-square values (p < 0.01) and R2 values ranging from 0.246 to 0.340 for all specifications.
5. Discussion
First, the descriptive analysis of the precious section shows that in the majority of the cases, the social interaction behaviour is erratic. We find examples where social interaction grows, e.g. El Corte Ingles or Vodafone, and others where the opposite happens, Adidas Football, Cinesa or Guia Repsol. These differences impede us to determine a clear tendency in the evolution of social interaction of the 10 corporate social networks. Moreover, our results may be misleading, as pointed out by Nijs et al. (2001), who demonstrate that the influence of the seasonality factor of certain events can cause increases in the social interaction of the network. In the period analysed we found seasonal effects; e.g., the football world championship held in July and August 2010, during which half of the cases studied were influenced in a relevant way.
---Insert Table 5 about here---
Second, upon analysing the quality of social interaction and considering that one of the objectives of corporate social networks is to generate a conversation with a follower (Boyd and Ellison, 2008). We find that in 90 % of the cases studied, 70% of the social interaction is produced exclusively through clicking once or twice on "I Like", while only 30 % of interactions generate a greater number of clicks or comments among the followers, which could be considered as a conversation. This gives an idea of the shallowness of the interaction that is achieved, since the exposure time and attention necessary to follow a conversation is not comparable to simply clicking on "I Like".
In contrast, it should be noted that a comparison between the data collected by the follower counters (see Table 5) and the number of users identified in the field work (see Table 1) reveals that the size of the corporate social networks studied actually represents a third of the data that Facebook numbers generate (assuming that the average interaction obtained is 2.67 clicks). Therefore, the actual size of corporate social communities is given by the number of unique users and not by the number of times they interact, thus confirming the low level of efficiency of these types of measures in promoting social interaction.
period of analysis (see Figure 3). Thus, it is observed that the nodes which interacted most have, on average, fewer friends than those who participate less, as shown in Figure 3. The results are in line with Granovetter’s theory of weak ties, (Granovetter, 1973; Enders et al., 2008) as well as the 'Long Tail' concept (Anderson, 2005). Besides, our results show that 90% of unique users are active for no more than two months and 74.84 % are only active during the first month.
From the results of the regression analysis (see Table 4) we cannot conclude that the activity of the community manager and the digital marketing investment have a significant impact in social interaction (Hypotheses 1a and 1b). These results are contradictory with (1) the normal practice of companies, which invest a considerable amount of resources in the development of digital marketing and; (2) with the existing literature, which emphasizes the importance of exogenous mechanisms aimed at encouraging social networks’ interaction (Trusov et al., 2009; Godes et al., 2013). However, Waltherl et al. (2008), and Ross et al. (2009) point out that marketing managers cannot control the content and frequency of such interactions. One reason sometimes given in the literature is based on the structure of interactions among the followers. This point of view reflected on the ‘Long Tail effect’ (Anderson, 2005), and Granovetter’s weak tie theory (Granovetter, 1973) assumes that friendship relations are strong ties due to the bi-directionality of the links and the more-frequent interaction that tend to occur between friendship. In contrast, information’ sources are weaker relationships than friends. Waltherl et al. (2008) and Ross et al. (2009) note that the strong interactions between friends are beyond the control of digital marketing, leaving only weak ties to its inspection. Moreover, from an operational point of view, the revitalization of the network requires simply too much effort to update permanently all contact data, since contacts do not regularly inform the individual about changes in their contact data. Hence, contact data is not always up-to-date and the individual might lose track of these people, whose relation will disappear over time due to a lack of interaction (Granovetter, 1985). From a dynamic point of view, exogenous factors (community manager and digital marketing investment) have an impact on the dependent variable, which is in line with the descriptive results of Figure 5, where in most corporate networks, a digital marketing campaign has a positive effect on the increase in clicks ('I like') as well as comments. However, we can also see that the causal effect has different fate. A first observation shows that the effect of exogenous factors results in a rapid decrease of social interaction, and concluding in a punctual effect or spurious effect (rapid growth and decrease). This first explanation can be supported by the effect 'Long Tail Effect' (Anderson, 2006; Enders et al., 2008). So, after an investment in digital marketing in which fan reaction occurs, it does not have continuity in time. In other cases, we observe a certain delay in the reaction, and, in other cases
the impact of it on the followers is undetermined. Therefore, we can say that one of the problems of digital marketing is to determine the reaction of the fans in both time and intensity.
The variable size (ß= 0.418, p < 0.01) has a positive and significant influence on the generation of social interaction our sample. Therefore, the number of users of a corporate social network favourably impacts social interaction. This result reinforces the idea that follower counters via "I Like" are not very useful as measurements of social interaction on Facebook.
The analysis of endogenous factors reveals that the variable clustering (ß= 0.482, p < 0.01), and density (ß= 0.494, p < 0.01) of the corporate social network have a positive and significant effect on the generation of social interaction; these results support Hypotheses 2a and 2b.
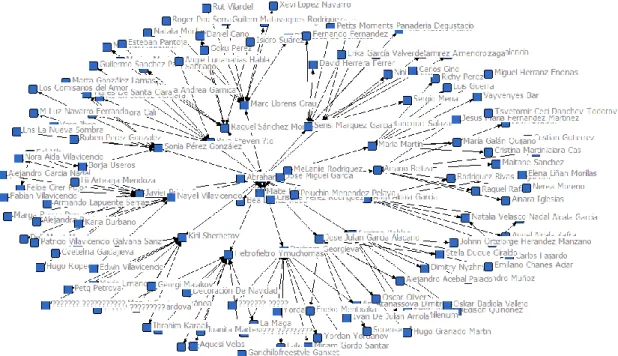
In terms of network topology, our results show a star-shape, i.e., they are ego-centered social networks distributed around the company that launches the social network, see Figure 4. According to Borgatti and Halgin (2011) the main feature of star networks is their low cohesion, as indicated by low density coefficient, degrees of centrality and the average distance between nodes.
---Insert Figure 6 about here---
6. Conclusion
6.1. Theoretical Contribution
The paper contributes to the literature on social interaction in SNS by testing how (endogenous and exogenous) factors affect social interaction. In this way, we stress the importance of network topology as a catalyst for social interaction. Our paper provides empirical evidence of the Long Tail effect model, as well as support for Granovetter’s theory of weak ties. Moreover, our study deepens the understanding of the interactions in the network, both from a static and dynamic point of view, establishing the difference between weak and strong ties, where the latter is not easily accessible and easily influenciable.
6.2. Practical Contribution
From a practitioner’s point of view our findings provide empirical evidence on the adequacy of the measures of interaction used in Facebook and how exogenous and endogenous factors influence the social interaction obtained. This point is of great relevance to business managers because companies need to optimise their actions through the digital marketing. Our paper draws attention on how important is for any organization to have reliable information on the patterns of interaction in corporate network sites and on the proper management of resources allocated for this purpose. Likewise, companies should consider the importance of the structural factors of followers’ network, such as the clustering coefficient, so as to know, interpret and optimize them in
order to obtain a higher level of social interaction. We also note that the actions of the companies through exogenous factors have a limited capacity to act both on intensity and time. The paper shows the limited capacity of firms to influence social networks because their actions only affect weak ties and they have a limited validity in time. We have also shown that is difficult to determine the outcome of the exogenous factors in the social interaction of the corporate network sites. Thus, companies should consider how to design the actions of digital marketing, taking into account the key role played by the maintenance and retention of customers (or potential customers) over the life of companies. Therefore, firms should develop new strategies and methodologies to determine which mechanisms of interaction of digital marketing to implement. In this way, we suggest (1) the active intervention of users in the management of the relationships; and (2) the search for a friendly relationship with followers based on an interesting, honest and informal communication in SNS that allows its continuity in time.
6.3. Limitations
The limitations of this study must be borne in mind when explaining the results, while at the same time, opening new avenues for future research. The most relevant, are presented below.
To begin with, the first limitation comes from the gathering of data, which was quite rudimentary and the use of traditional methods, copying and pasting, cleaning and removing anything not relevant to the study in order to get the comments and clicks on "I Like", was repetitive work which posed a real challenge to the patience of the investigator. The data extraction was intended to find out who said what and when in the comments, to identify who clicked "I Like" and when, to obtain the comments of the followers and any activity that revolved around the community manager and to quantify their frequency of participation, prize initiatives etc. Any Facebook user looking at a wall of followers will see a mosaic of information that when copied and pasted gives large volumes of irrelevant information for a study of this kind.
After obtaining the information previously described, the construction of the 132 social networks based on the followers comprising the sample to search for friends and friends of these was another arduous chore. It must not be forgotten that Facebook is a closed system and that different levels of privacy selected by each user impedes access to information of the followers of corporate social networks. Therefore another important limitation is the fact that the randomness in the choice of users in the sample was conditioned by the followers who had low or no privacy levels on their individual profiles. This aspect is crucial to identify the follower's friends and friends of friends, the friends involved in the corporate social networks analysed, as well as the links that sample’s nodes have to other corporate social networks. An unlimited access to the data Facebook
possesses on its own followers, corporate social networks, etc. would have greatly enhanced the breadth and depth of this study, providing much more enriching results.
The second limitation comes from the fact that Facebook differentiates unique users by their email, but in this study we had access only to the alias with which the user logs into the network as user e-mail addresses are not accessible due to Facebook personal data protection systems. This could in some cases result in the same alias being attributed to more than one follower.
The third limitation refers to the fourteen-month period of analysis; although the aim was to have a large enough sample with the best possible quality; it may be the case that a larger sample period would have provided better results. There were important changes in trends of the ten social networks after the interval of time of the sample.
The limitations listed above open up new research lines of research that can contribute to improving this work significantly. Firstly, the difference between the results of real interaction in corporate social networks and the findings of this study require the adoption of different criteria to assess social interaction on Facebook, such as the concept of unique users who truly interact in the aforementioned social network. Secondly, the definition of a proper model for each social network management is needed, depending on the sector and business activity. As of today, there is a relatively uniform corporate social networking activity that revolves around prizes and the community manager model. One way that remains unexplored is to promote creativity and teamwork for followers of social networking websites that would allow the creation of stronger links in which the follower has a more active role, and where queries are sorted by relevant topics for any possible initiative or question that can be made to the user. From the perspective of rewards, the possibility of donating prizes or benefits from a given initiative can also work as a differentiator.
References
Abbasi, A., Chung, K., and Hossain, L. (2012), "Egocentric analysis of co-authorship network
structure, position and performance", Information Processing & Management, Vol. 48 No. 4, pp. 671–679.
Adar, E., and Adamic, L.A. (2005), "Tracking information epidemics in Blogspace", Web Intelligence Proceedings. The 2005 IEEE/WIC/ACM International Conference, Compiegne, France.
Anderson, C. (2005), The Long Tail, Hyperion, New York.
Networks", Working Paper, Columbia Business School, Columbia University.
Aral S, W. D. (2011), "Creating social contagion through viral product design: A randomized trial of peer influence in networks", Management Science, Vol. 57 No 9, pp. 1623-1639.
Baltar, F., and Brunet, I (2012), "Social research 2.0: virtual snowball sampling method using Facebook", Internet Research Vol. 22 No 1, pp. 57 – 74.
Barnes, N., Cass, J., Getgood, S., Gillin, P., and Gossieaux, F. (2008), "Exploring the link between customer care and brand reputation in the age of social media research study", Retrieved from http://www.lulu.com/items/volume_64/ 5371000/5371409/1 /print/Nuance_Final.pdf
Bernoff, J., and Li, C. (2008), "Harnessing the power of the oh-so-social web", MIT Sloan Management Review, Vol. 49 No 3, pp. 36-42.
Borgatti, S.P. and & Halgin, D.S. (2011), "On Network Theory", Organization Science, Vol. 22 No 5, pp. 1168-1181.
Boyd, D.M., and Ellison, N. B. (2008), "Social Network Sites: Definition, History and Scholarship", Journal of Computer-Mediated Communication, Vol. 13, pp. 210-230.
Cha, M., Mislove, A., and Gummaldi, K.P. (2009), "A Measurement-driven Analysis of Information Propagation in the Flickr Social Network", International World Wide Web Conference, Madrid, Spain.
Chen, H. , Papazafeiropoulou, A. , Chen T., Duan ,Y. and Liu, H. (2014). Exploring the commercial value of social networks : Enhancing consumers’ brand experience through Facebook pages. Journal of Enterprise Information Management Vol 27, No 5 , pp. 576-598
Clifford-Marsh, E. (2009), " Viral marketing", Revolution, March, pp. 50-52.
Daft, R.L. and Lengel, R.H. (1986), "Organizational information requirements, media richness and structural design", Management Science, Vol. 32 No 5, pp.554-571.
Datta, P., Chowdhury, D., and Chakraborty, B. (2005), "Viral marketing: New form of word of mouth through internet", The Business Review, Cambridge, Vol. 3 No 2, pp. 69-75.
Dholakia, U.M., Bagozzi, R.P., and Pearo, L.K. (2004), "A social influence model of consumer participation in network and small group-based virtual communities", International Journal of Research in Marketing, Vol. 21 No 3, pp. 241-263.
Enders, A., Hungenberg, H., Denker, H.P., and Mauch, S. (2008), "The Long Tail of Social
Networking: Revenue Models of Social Networking Sites", European Management Journal, Vol. 26 No 3, pp. 199–211.
Ferguson, R. (2008), "Word of mouth and viral marketing: Taking the temperature of the hottest trends in marketing", Journal of Consumer Marketing, Vol. 25 No 3, pp. 179-182.
Freeman, L.C. (1977), "A set of measures of centrality based on betweenness", Sociometry, Vol. 40, pp. 35-41.
Godes, D., and Mayzlin D. (2004), "Using Online Conversations to Study Word of Mouth Communication", Marketing Science, Vol. 23 No 4, pp. 545-560.
Goh, K. Y., Heng, C. S., and Lin, Z. (2013), " Social media brand community and consumer behavior: Quantifying the relative impact of user- and marketer-generated content", Information Systems Research, Vol. 24 No 1, pp. 88-107.
Granovetter, M. (1973), "The Strength of Weak Ties", American Journal of Sociology, Vol. 78, pp. 1360–80.
Granovetter, M. (1985), "Economic Action and Social Structure: The Problem of Embeddedness", American Journal of Sociology, Vol. 91 No 3, pp. 481–510.
Gruhl, D., Guha, R., Liben-Nowell, D., and Tomkins, A. (2004), "Information diffusion through Blogspace", WWW2004 Proceedings Papers.
http://www.www2004.org/proceedings/docs/1p491.pdf.
Hawkins, D., Mothersbaugh, D., and Best, R. (2007), Consumer behaviour: Building marketing strategy, McGraw-Hill, New York, NY.
Hsiu-Fen, L. (2013), "The effects of knowledge management capabilities and partnership attributes on the stage-based e-business diffusion", Internet Research, Vol. 23 No 4, pp. 439 - 464.
Ji, P. and Wayne Fu, W. (2013), "Love Internet, love online content: Predicting Internet affinity with information gratification and social gratifications", Internet Research, Vol. 23 No 4, pp. 396 – 413.
Jiang, Q. (2014), "Internet addiction among young people in China: Internet connectedness, online gaming, and academic performance decrement", Internet Research Vol. 24 No 1, pp. 2 – 20. Kai-Shuan, S. (2013), "Measuring the sociocultural appeal of SNS games in Taiwan", Internet
Research, Vol. 23 No 3, pp. 372 – 392.
Kalampokis, E., Tambouris, E. and Tarabanis, K. (2013), "Understanding the predictive power of social media", Internet Research, Vol 23 No 5, pp. 544 – 559.
Kleis, L., Chwelos, P., Ramirez, R.V., and Cockburn, I. (2012), " Information technology and
intangible output: The impact of IT investment on innovation productivity", Information Systems Research, Vol. 23 No 1, pp. 42-59.
Knoke, D. and Kuklinski, J.H.. (1982), "Network Analysis", (Series: Quantitative Applications in the Social Sciences), Sage University Paper 28, Newbury Park, California.
Online Communities", Journal of Marketing Research, Vol. 39, pp. 61–72.
Kuo-Hsiang, Ch., Kai-Shuan, S., and Min-Yuan M. (2012), "The functional and usable appeal of Facebook SNS games", Internet Research, Vol. 22 No 4, pp. 467 – 481.
Leskovec, J., Adamic ,L.A., and Huberman, B.A. (2006), "The dynamics of viral marketing", ACM conference on Electronic Commerce Proceedings, pp. 228–237.
Liu, Y. (2006), "Word of Mouth for Movies: Its Dynamics and Impact on Box Office Receipts", Journal of Marketing, Vol.70, pp. 74-89.
Lucia-Palacios, L., Bordonaba-Juste, V., Polo-Redondo, Y., and Grünhagen, M. (2014), "E-business implementation and performance: analysis of mediating factors", Internet Research, Vol. 24 No 2, pp. 223 – 245.
Lueg, C., and Fisher. D. (2003), From Usenet to CoWebs: Interacting with Virtual Communities and Information Spaces, Springer-Verlag, Amsterdam, NL.
Luo, X. and Zhang, J. (2013), "How do consumer buzz and traffic in social media marketing predict the value of the firm?", Journal of Management Information Systems, Vol. 30 No 2, pp. 213-238. Martínez-Torres, M., Toral, S., Palacios, B., and Barrero, F. (2011), "Web site structure mining using
social network analysis", Internet Research Vol. 21 No 2, pp. 104 – 123.
Mayzlin, D., and Godes, D. (2004), "Using Online Conversations to Study Word-of-Mouth Communication", Marketing Science, Vol. 23 No 4, pp. 545–60.
Miller, A.R., Tucker, C. (2013), " Active social media management: The case of health care", Information Systems Research, Vol. 24 No 1, pp. 52-70.
Monge, P. R., and Contractor, N. S. (2003), Theories of communication networks, Oxford University Press, New York.
Nail, J. (2005), "What’s the Buzz on Word-of-Mouth Marketing? Social Computing and Consumer Control Put Momentum into Viral Marketing",
http://www.forrester.com/rb/Research/whats_buzz_on_word-of-mouth_marketing/q/id/36916/t/2].
Newman, M. E. (2003). The structure and function of complex networks. SIAM review, 45(2), 167- 256.
Nielsen//NetRatings, (2005), "A Community Uprising", February. www.nielsennetratings.com. Nijs, V., Marnik G., Dekimpe, J-B., Steenkamp, E. M., Dominique M., and Hanssens. (2001), "The
category demand effects of price promotions", Marketing Science, Vol. 21 No 1, pp. 1–22. O’Reilly,T. (2006), "Levels of the Game:The Hierarchy of Web 2.0 Applications", O’Reilly
http://radar.oreilly.com/archives/2006/07/levels_of_the_game.html
Radder, L., (2002), "The brand capability value of integrated marketing communications", Proceedings of the Academy of Marketing Studies, Vol. 7 No 1, pp. 45- 51.
Rishika, R., Kumar, A. , Janakiraman, R., and Bezawada, R. (2013), "The Effect of Customers' Social Media Participation on Customer Visit Frequency and Profitability: An Empirical Investigation", Information Systems Research, Vol. 24 No 1, pp. 108-127.
Ritzer, G. (2007), Contemporary Sociological Theory and Its Classical Roots: The Basics, McGraw-Hill, Boston.
Rosen, E., (2000), The anatomy of buzz: how to create word-of-mouth marketing, Doubleday/Currency, New York.
Ross, C., Orr, E., Sisic, M., Arseneault, J. Simmering, M. and Robert, R. (2009). Personality and motivations associated with Facebook use, Computers in Human Behavior Vol. 25, pp. 578–586. Savolainen, R. (2001), "The role of the internet in information seeking. Putting the networked
services in context", Information Processing & Management, Vol. 37 No 5, 661–675.
Schilling, M.A. and Phelps C.C. (2007), "Interfirm collaboration networks: the impact of large-scale network structure on firm innovation", Management Science, Vol. 53 No 7, pp. 1113–1126. Schoen, H., Gayo-Avello, D., Takis Metaxas, P., Mustafaraj, E., Strohmaier, M., and Gloor, P. (2013),
"The power of prediction with social media", Internet Research, Vol. 23 No 5, pp.528 - 543. Schutz, A., (1967), The phenomenology of the social world, Northwestern University Press,
Evanston.
Scullin, S., Fjermestad, J. and Romano N. (2004). E‐relationship marketing: changes in traditional marketing as an outcome of electronic customer relationship management. Journal of Enterprise Information Management, Vol. 17, No 6, pp.410 - 415
Shu, W., and Chuang, Y. (2011), "The perceived benefits of six-degree-separation social networks", Internet Research Vol 21 No 1, pp. 26 – 45.
Tedesco, T., (2009), "Demystifying payback of social media and other marketing efforts", August, http://www.graphicartsonline.com/blog/1410000741/post/1780047378.htm
Trusov, M., Bucklin, R., and Pauwels, K. (2009), "Effects of Word-of-Mouth Versus Traditional Marketing: Findings From an Internet Social Networking Site", Journal of Marketing, Vol. 73 No 5, pp. 90–102.
Turner, T., Smith, M., Fisher F., and Welser H,T. (2005), "Picturing Usenet: mapping computer-mediated collective action", Journal of Computer- Mediated Communication, Vol. 10 No 4, pp. 00.
Villanueva, J., Yoo, S., and Hanssens, D. M. (2008), "The Impact of Marketing-Induced vs. Word-of-Mouth Customer Acquisition on Customer Equity Growth", Journal of Marketing Research, Vol. 45, pp. 48-59.
Wang, F., and Vaughan, L. (2014), "Firm web visibility and its business value", Internet Research, Vol. 24 No 3, pp.292 - 312.
Waltherl, J., Heide, B., Kim, S., Westerman, D., and Tong, T. (2008). The Role of Friends’ Appearance and Behavior on Evaluations of Individuals on Facebook: Are We Known by the Company We Keep? Human Communication Research Vol. 34, pp. 28–49.
Watts, D.J., and Strogatz, S.H. (1998), "Collaborative dynamics of “small-world” networks", Nature, Vol. 393, pp. 440-442.
Yang, S.B., Lim, J.H., Oh, W., Animesh, A. and Pinsonneault, A. (2012), "Using real options to investigate the market value of virtual world businesses", Information Systems Research, Vol. 23 No 3, pp. 1011-1029.
Zhang, J., and Jastram, I. (2006), "A study of the metadata creation behavior of different user groups on the Internet", Information Processing & Management, Vol. 42 No 4, pp. 1099–1122.
Figure 1. Conceptual Model ‘Social Interactions’
Exogenous Factors
Corporate social networks
Endogenous Factors
Table 1. Social interaction in corporate social networks
Table 2. Social interaction by intervals and by corporate social network.
5 9 ,9 8 % 6 0 ,2 7 % 5 8 ,3 5 % 5 6 ,5 5 % 6 1 ,0 3 % 6 9 ,5 5 % 6 3 ,6 7 % 6 5 ,9 3 % 6 1 ,4 0 % 5 3 ,7 3 % 3 3 ,9 2 % 3 4 ,3 9 % 3 4 ,6 0 % 3 5 ,7 7 % 3 1 ,1 9 % 2 7 ,0 0 % 3 0 ,5 6 % 2 9 ,9 8 % 3 2 ,0 0 % 3 9 ,9 1 % 1,47% 1,24% 1,88% 1,92% 2,25% 0,81% 1,55% 0,97% 1,78% 1,22% 0% 10% 20% 30% 40% 50% 60% 70% 80% 90% 100% Adidas Football Cinesa El Corte Inglés Guia Repsol Mango Pepsi Spain Privalia Spain Telepizza Spain Vodafone Spain Vueling People! 43 15-42 7-14 2-6 1
Comments I like Total % Comments % I like Unique
User Click per User
ADIDAS FOOTBALL 21.668 62.803 84.474 25,65% 74,35% 33.257 2,54 CINESA 8.727 26.078 34.805 25,07% 74,93% 14.622 2,38 EL CORTE INGLES 3.595 19.448 23.043 15,60% 84,40% 7.914 2,91 GUIA REPSOL 7.738 17.304 25.042 30,90% 69,10% 8.963 2,79 MANGO 17.531 272.646 290.184 6,04% 93,96% 96.032 3,02 PEPSI ESPAÑA 15.933 21.728 37.661 42,31% 57,69% 17.755 2,12 PRIVALIA ESPAÑA 32.694 59.366 92.060 35,51% 64,49% 32.741 2,81 TELEPIZZA 8.794 43.040 46.624 18,86% 92,31% 20.737 2,25 VODAFONE ESPAÑA 8.958 24.015 32.973 27,17% 72,83% 10.880 3,03 VUELING 53.761 18.186 71.947 74,72% 25,28% 25.334 2,84 1 2-6 7-14 15-42 43 Adidas Football 59,98% 33,92% 4,35% 1,47% 0,27% Cinesa 60,27% 34,39% 3,92% 1,24% 0,18% El Corte Inglés 58,35% 34,60% 4,69% 1,88% 0,48% Guia Repsol 56,55% 35,77% 5,55% 1,92% 0,21% Mango 61,03% 31,19% 4,89% 2,25% 0,63% Pepsi España 69,55% 27,00% 2,48% 0,81% 0,16% Privalia España 63,67% 30,56% 3,68% 1,55% 0,55% Telepizza España 65,93% 29,98% 2,90% 0,97% 0,22% Vodafone España 61,40% 32,00% 4,23% 1,78% 0,59% Vueling People 53,73% 39,91% 4,97% 1,22% 0,17% Total 61,05% 32,93% 4,16% 1,51% 0,35%
Figure 3. Table and graph of corporate social network monthly duration.
Figure 4. Long Tail interaction
In te ra c tio n fr e c u e n c y Number of friends Average once Average 105 times Average 387 friends Average 576 friends FAT TAIL LONG TAIL In te ra c tio n fr e c u e n c y Number of friends Average once Average 105 times Average 387 friends Average 576 friends FAT TAIL LONG TAIL
Figure 5. Monthly Social interaction in all corporate social network
3.634 5.743 974 1.701 988 1.415 1.048 1.687 589 1.092 1.308 689 282 518 4.000 11.512 3.140 3.652 4.506 4.440 4.801 6.124 3.079 5.651 5.394 1.108 3.258 2.138 0 2.000 4.000 6.000 8.000 10.000 12.000 14.000
jun-10 jul-10 ago-10 sep-10 oct-10 nov-10 dic-10 ene-11 feb-11 mar-11 abr-11 may-11 jun-11 jul-11
Coments I Li ke Li nea l (Coments ) Li nea l (I Li ke) 781 1.747 725 868 875 418 581 259 314 384 594 417 343 421 1.953 3.715 1.144 2.223 1.805 2.004 3.342 1.408 1.441 1.323 1.696 1.342 1.109 1.573 0 500 1.000 1.500 2.000 2.500 3.000 3.500 4.000
jun-10 jul-10 ago-10 sep-10 oct-10 nov-10 dic-10 ene-11 feb-11 mar-11 abr-11 may-11 jun-11 jul-11
Coments I Li ke Li nea l (Coments ) Li nea l (I Li ke) Networks 1 2 3 4 5 6 7 8 9 10 11 12 13 14 Adidas Football 75,01% 15,14% 5,18% 2,36% 1,09% 0,51% 0,31% 0,19% 0,08% 0,04% 0,02% 0,04% 0,02% 0,01% Cinesa 69,62% 16,76% 6,51% 2,95% 1,66% 0,91% 0,59% 0,37% 0,24% 0,14% 0,10% 0,08% 0,03% 0,02% El Corte Inglés 69,90% 16,87% 6,78% 3,05% 1,28% 0,72% 0,53% 0,36% 0,25% 0,16% 0,06% 0,01% 0,00% 0,01% Guia Repsol 74,33% 17,22% 4,55% 1,90% 0,74% 0,54% 0,22% 0,18% 0,12% 0,04% 0,08% 0,04% 0,02% 0,02% Mango 70,22% 15,37% 5,80% 2,82% 1,62% 0,96% 0,59% 0,39% 0,26% 0,14% 0,12% 0,07% 0,05% 0,04% Pepsi Spain 84,46% 11,60% 2,53% 0,80% 0,36% 0,15% 0,05% 0,02% 0,02% 0,00% 0,00% 0,00% 0,00% 0,01% Privalia Spain 75,09% 15,15% 5,14% 2,13% 1,07% 0,55% 0,32% 0,17% 0,15% 0,11% 0,05% 0,04% 0,02% 0,02% Telepizza 76,78% 14,91% 4,85% 1,80% 0,83% 0,38% 0,17% 0,12% 0,06% 0,04% 0,02% 0,02% 0,01% 0,00% Vodafone Spain 72,08% 15,74% 6,05% 2,65% 1,51% 0,68% 0,39% 0,35% 0,19% 0,17% 0,11% 0,01% 0,05% 0,03% Vueling 80,94% 13,31% 3,58% 1,18% 0,54% 0,22% 0,09% 0,07% 0,04% 0,02% 0,01% 0,00% 0,00% 0,00% Total Average 74,84% 15,21% 5,10% 2,16% 1,07% 0,56% 0,33% 0,22% 0,14% 0,09% 0,06% 0,03% 0,02% 0,02% 74,84% 15,21% 5,10% 2,16% 1,07% 0,56% 0,33% 0,22% 0,14% 0,09% 0,06% 0,03% 0,02% 0,02% 0,00% 20,00% 40,00% 60,00% 80,00% 1 2 3 4 5 6 7 8 9 10 11 12 13 14
122 45 44 74 239 269 226 301 350 277 622 404 304 318 217 143 80 388 1.212 1.337 1.348 1.465 1.465 1.769 2.847 3.012 2.080 2.085 0 500 1.000 1.500 2.000 2.500 3.000 3.500
jun-10 jul-10 ago-10 sep-10 oct-10 nov-10 dic-10 ene-11 feb-11 mar-11 abr-11 may-11 jun-11 jul-11
Coments I Li ke Li nea l (Coments ) Li nea l (I Li ke) 1.414 2.047 905 327 194 174 91 72 77 291 570 471 369 736 3.523 6.299 986 558 457 565 392 364 379 420 719 961 756 925 0 1.000 2.000 3.000 4.000 5.000 6.000 7.000
jun-10 jul-10 ago-10 sep-10 oct-10 nov-10 dic-10 ene-11 feb-11 mar-11 abr-11 may-11 jun-11 jul-11
Coments I Li ke Li nea l (Coments ) Li nea l (I Li ke) 1.319 1.450 1.274 1.851 1.170 908 1.452 1.335 286 244 1.047 1.957 1.748 1.490 14.744 16.135 15.100 19.488 30.549 26.428 19.265 16.186 17.330 21.671 25.138 22.463 15.307 12.842 0 5.000 10.000 15.000 20.000 25.000 30.000 35.000
jun-10 jul-10 ago-10 sep-10 oct-10 nov-10 dic-10 ene-11 feb-11 mar-11 abr-11 may-11 jun-11 jul-11
Coments I Li ke Li nea l (Coments ) Li nea l (I Li ke) 122 130 123 96 1.642 4.614 4.940 1.002 437 452 547 432 705 687 21 115 188 92 163 2.090 5.046 1.928 1.014 1.511 1.468 2.004 3.158 2.930 0 1.000 2.000 3.000 4.000 5.000 6.000
jun-10 jul-10 ago-10 sep-10 oct-10 nov-10 dic-10 ene-11 feb-11 mar-11 abr-11 may-11 jun-11 jul-11
Coments I Li ke Li nea l (Coments ) Li nea l (I Li ke) 9.537 1.962 2.030 2.490 844 1.260 685 963 918 1.803 1.441 7.424 1.337 1.341 3.032 2.793 3.118 2.882 2.723 4.206 2.534 2.240 2.960 5.639 5.500 6.509 8.217 7.009 0 2.000 4.000 6.000 8.000 10.000 12.000
jun-10 jul-10 ago-10 sep-10 oct-10 nov-10 dic-10 ene-11 feb-11 mar-11 abr-11 may-11 jun-11 jul-11
Coments I Li ke Li nea l (Coments ) Li nea l (I Li ke) 489 1.105 592 260 269 340 483 486 43 1.019 1.243 815 906 744 6.895 965 452 361 1.169 791 1.011 1.772 1.516 6.468 5.986 5.313 5.210 5.131 0 1.000 2.000 3.000 4.000 5.000 6.000 7.000 8.000
jun-10 jul-10 ago-10 sep-10 oct-10 nov-10 dic-10 ene-11 feb-11 mar-11 abr-11 may-11 jun-11 jul-11
Coments I Li ke Li nea l (Coments ) Li nea l (I Li ke) 485 551 498 377 298 413 352 319 760 1.344 865 939 812 945 483 749 341 450 547 807 1.321 705 1.600 2.934 2.353 3.693 3.782 4.250 0 1.000 2.000 3.000 4.000 5.000
jun-10 jul-10 ago-10 sep-10 oct-10 nov-10 dic-10 ene-11 feb-11 mar-11 abr-11 may-11 jun-11 jul-11
Coments I Li ke Li nea l (Coments ) Li nea l (I Li ke)
97 141 107 245 201 382 363 2.300 1.083 30.177 3.376 5.641 6.622 3.026 15 141 112 125 209 261 352 588 904 6.659 1.586 3.440 2.600 1.194 0 5.000 10.000 15.000 20.000 25.000 30.000 35.000
jun-10 jul-10 ago-10 sep-10 oct-10 nov-10 dic-10 ene-11 feb-11 mar-11 abr-11 may-11 jun-11 jul-11
Coments I Li ke Li nea l (Coments ) Li nea l (I Li ke)
Table 3. Descriptive statistics and correlation
Mean S.D. 1 2 3 4 5 6 7 8 1. Density 0.41 0.23 1.000 2. Clustering 0,36 0.49 0.125* 1.000 3. Community Manager 0.36 0.51 0.094 0.014 1.000 4. Investment 0.00085 0.000040 -0.039 -0.041 0.076 1.000 5. Size 154 67 -0.027 -0.038 -0.062 0.058 1.000 6. Number of friends 89 36 0.007 0.092 0.026 0.019 0.092 1.000 7. Age 2 0.6 0.023 0.050 0.033 0.085 0.024 0.058 1.000 8. Interaction 0.0045 0.00071 0.192* 0.230** 0.051 0.102* 0.047 0.075 0.013 1.000 *p < 0.10; **p < 0.05; ***p < 0.01
Table 4. Causal analysis of endogenous and exogenous factors
Variables ENDOGENOUS/EXOGENOUS M1 M2 M3 Density 0.494*** Clustering 0.482*** Community Manager 0.032 Investment 0.092 Size 0.369* 0.377** 0.418*** Number of friends -0.070 -0.067 -0.058 Age -0,003 -0.095 -0.015 ℝ2 0.246 0.340 0.310 *p < 0.10; **p < 0.05; ***p < 0.01
Table 5. Facebook fans evolution figures
Followers June 2010 Followers June 2011 Followers Julie 2012 % Growth 2011 vs 2010 % Growth 2012 vs 2011 ADIDAS FOOTBALL 1,120,347 5,244,536 7,785,460 368% 48% CINESA 52,752 107,657 188,869 104% 75% EL CORTE INGLES 37,456 315,006 691,171 741% 119% GUIA REPSOL 58,112 72,109 73,519 24% 2% MANGO 1,768,016 2,796,443 3,955,471 58% 41% PEPSI ESPAÑA 1,150 355,709 525,481 30831% 48% PRIVALIA ESPAÑA 300,091 553,362 676,526 84% 22% TELEPIZZA 31,218 267,889 352,537 758% 32% VODAFONE ESPAÑA 93,375 166,923 207,901 79% 25% VUELING 3,500 166,186 261,773 4648% 58%