Proc. NIPR Symp. Upper Atmos. Phys., 5, 10-20, 1992
SCANDINAVIAN IMS MAGNETOMETER ARRAY DATA AND THEIR USE FOR STUDIES OF GEOMAGNETIC
RAPID V ARIA TIO NS
Tohru ARAKI1, Hironori SHIMAZU1, Toyohisa KAMEi� and Hiroshi HANADo:i
1 Department of Geophysics, Faculty of Science, Kyoto University, Kyoto 606
2 Data Analysis Center fur Geomagnetism and Spaccmagnetism, Faculty of Science,
Kyoto University, Kyoto 606
3 Kashima Space Communication Center, Communications Rcsf!arch Laboratory,
Kashima-clzo, lbaraki 314
Abstract: A data set which was newly open to the public from the World Data Center C2 for Geomagnetism is introduced. It was obtained from geo magnetic observations at 36 stations in Scandinavia during the International Magnetospheric Study (1977-1979). A few examples of analysis using the data are shown.
1. Introduction
For the operation during the IMS ( International Magnetospheric Study) period (1977-1979) a two-dimensional magnetometer array consisting of 36 magnetometers was installed in Scandinavia. Some of them began operation in 197 4 earlier than the IMS period. The original data have been used by a research group of the Institute of Geophysics, University of Mtinster and a set of back-up film data had been stored in the Geophysical Institute, University of Gottingen.
The World Data Center C2 for Geomagnetism, Kyoto University, negotiated for release of the data to the public, and the back-up film was kindly transferred to the Center in 1989. The original back-up data which were accommodated in 42 large film reels were copied and classified by the stations and observation period into 567 small reels so as to be read by ordinary film reader-printers. A Grant-in Aid for Scientific Research from the Ministry of Education, Science and Culture was used to make copies of the data. The data have been open to the public since January 1991.
The data seem to be useful for studying fine structures of geomagnetic rapid variations. Dependence of the rapid variations upon longitude or local time will also be effectively studied by combining the data with the North American IMS Magnetometer Network data which have been open to the public since 1979.
The purpose of this note is to introduce the details of the data and show a few examples of analysis of the data.
2. Description of the Data
Table 1 is a brief summary of the Scandinavian Magnetometer Array ( SMA)
observation described in KOPPERS et al. (1979). SMA consisted of 36 Gough
Reitzel type magnetometers, each of which was housed in an airtight tube and buried in the ground. Deflections of three wire-suspended magnets were optically recorded on 35 mm film every 10 sec (20 sec at some of the stations). The system operated unattended for approximately 73 days.
The observation was conducted by a research group of Geophysical Institute, University of Milnster, led by Prof. J. UNTIEDT. Persons who are most acquainted with the data may be Drs. W. BAUMJOHANN, Max-Planck Institute for Extra Terrestrial Physics in Garching/Milnchen, and K.-H. GLASSMEIER, Institute for Geophysics and Meteorology, University of Koln.
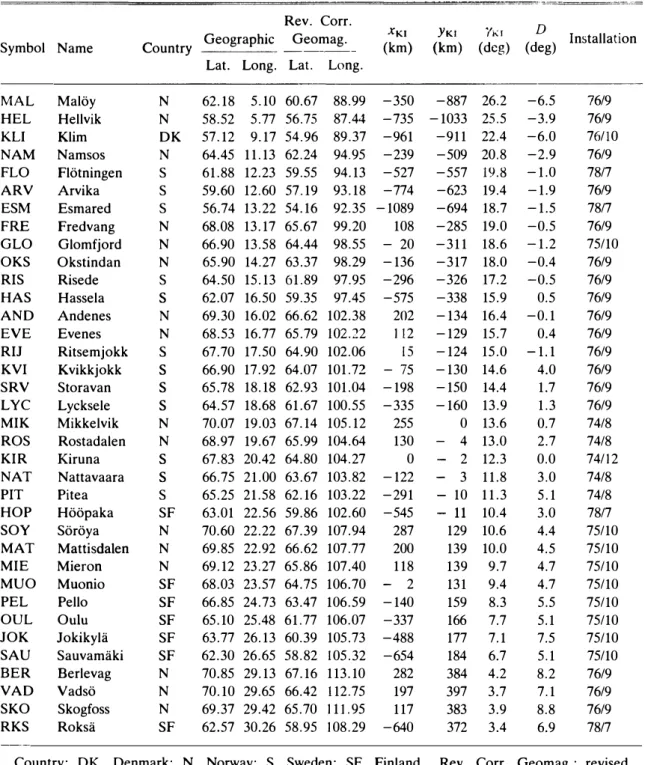
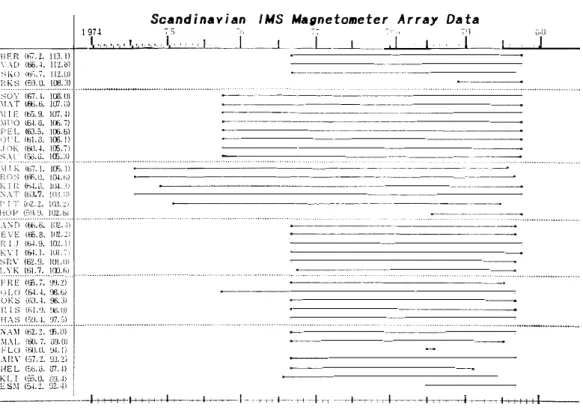
Table 2 gives names and locations of the 36 stations of which distribution is shown in Fig. 1. Data period of each station is shown in Fig. 2.
3. Examples of Data Analysis 3 .1. Geomagnetic sudden commencement
VoLPERS ( 1984) analyzed two sudden commencements (SC's) observed by SMA on January 9, 1979 and April 5, 1979. Here we will compare his results with observations at the North American IMS Magnetometer Network ( abbreviated as
NAMN). Difference in the onset time of the two SC's (0335UT and 0156UT) is small and we do not need to worry about the difference in local time at each station.
Stations Data period
Table I.
Number of film reels Magnetometer Components Range Clock Drift Resolution Film speed Time mark Calibration Traces on film
Summary of the Scandinavian Magnetometer Array observation
(from KOPPERS et al., 1979).
36 stations in Denmark, Norway, Sweden and Finland
August 1, 1974 (earliest station)-October 26, 1979 (last station), sup plemented by a few stations data up to June 19, 1980
567 ( one reel contains data for approximately 73 days)
Gough-Reitzel type; 3 wire-suspended magnets, optical recording on 35 mm film with every 10 or 20 sec exposure, the whole system in an airtight 1.6 m-long aluminum tube buried in the ground
H(northward; negative on the film frame), D(eastward; positive), Z(down ward; negative)
H: -1500 nT-1000 nT, D: -500 nT-1000 nT, Z: -800 nT-1200 nT Quartz clock (nominal error is less than 5 sec in 73 days) Usually less than 0.1 nT/day
2 nT (40 nT/mm on film, optical resolution=0.05 mm) Approximately 27 .3 mm/h
Every 6 (or 12) hours (shown by a thick vertical line), 1 hour (thin vertical line), 6 (or 12) min (thick dot) 10 sec (thin dot)
Every 6 (or 12) hours (00-06 min, by small Helmholtz coils)
H, D, Z, T (temperature), B1, B2 (base line); there is a list which shows
12 T. ARAKI, H. SmMAZU, T. KAMEi and H. HANADO
Table 2. Station list of the Scandinavian Magnetometer Array (from KOPPERS et al., 1979).
Rev. Corr. D
Geographic Geomag. XKI YKI /Kl Installation
Symbol Name Country --- (km) (km) (deg) (deg)
Lat. Long. Lat. Long.
MAL Maloy N 62.18 5.10 60.67 88.99 -350 -887 26.2 -6.5 76/9 HEL Hellvik N 58.52 5.77 56.75 87.44 -735 -1033 25.5 -3.9 76/9 KLI Klim DK 57.12 9.17 54.96 89.37 -961 -911 22.4 -6.0 76/10 NAM Namsos N 64.45 11.13 62.24 94.95 -239 -509 20.8 -2.9 76/9 FLO Flotningen
s
61.88 12.23 59.55 94.13 -527 -557 19.8 -1.0 78/7 ARV Arvikas
59.60 12.60 57.19 93.18 -774 -623 19.4 -1.9 76/9 ESM Esmareds
56.74 13.22 54.16 92.35 -1089 -694 18.7 -1.5 78/7 FRE Fredvang N 68.08 13.17 65.67 99.20 108 -285 19.0 -0.5 76/9 GLO Glomfjord N 66.90 13.58 64.44 98.55 - 20 -311 18.6 -1.2 75/10 OKS Okstindan N 65.90 14.27 63.37 98.29 -136 -317 18.0 -0.4 76/9 RIS Risedes
64.50 15.13 61.89 97.95 -296 -326 17.2 -0.5 76/9 HAS Hasselas
62.07 16.50 59.35 97.45 -575 -338 15.9 0.5 76/9 AND Andenes N 69.30 16.02 66.62 102.38 202 -134 16.4 -0.1 76/9 EVE Evenes N 68.53 16.77 65.79 102.22 112 -129 15.7 0.4 76/9 RIJ Ritsemjokks
67.70 17.50 64.90 102.06 IS -124 15.0 - 1. 1 76/9 KVI Kvikkjokks
66.90 17.92 64.07 101.72 - 75 -130 14.6 4.0 76/9 SRV Storavans
65.78 18.18 62.93 101.04 -198 -150 14.4 1.7 76/9 LYC Lyckseles
64.57 18.68 61.67 100.55 -335 -160 13.9 1.3 76/9 MIK Mikkelvik N 70.07 19.03 67.14 105.12 255 0 13.6 0.7 74/8 ROS Rostadalen N 68.97 19.67 65.99 104.64 130 - 4 13.0 2.7 74/8 KIR Kirunas
67.83 20.42 64.80 104.27 0 2 12.3 0.0 74/12 NAT Nattavaaras
66.75 21.00 63.67 103.82 -122 - 3 11.8 3.0 74/8 PIT Piteas
65.25 21.58 62.16 103.22 -291 10 11.3 5.1 74/8 HOP Hoopaka SF 63.01 22.56 59.86 102.60 -545 11 10.4 3.0 78/7 SOY Soroya N 70.60 22.22 67.39 107.94 287 129 10.6 4.4 75/10 MAT Mattisdalen N 69.85 22.92 66.62 107.77 200 139 10.0 4.5 75/10 MIE Mieron N 69.12 23.27 65.86 107.40 118 139 9.7 4.7 75/10 MUO Muonio SF 68.03 23.57 64.75 106.70 - 2 131 9.4 4.7 75/10 PEL Pello SF 66.85 24.73 63.47 106.59 -140 159 8.3 5.5 75/10 OUL Oulu SF 65.10 25.48 61.77 106.07 -337 166 7.7 5.1 75/10 JOK Jokikyla SF 63.77 26.13 60.39 105.73 -488 177 7.1 7.5 75/10 SAU Sauvamaki SF 62.30 26.65 58.82 105.32 -654 184 6.7 5.1 75/10 BER Berlevag N 70.85 29.13 67.16 113.10 282 384 4.2 8.2 76/9 VAD Vadso N 70.10 29.65 66.42 112.75 197 397 3.7 7.1 76/9 SKO Skogfoss N 69.37 29.42 65.70 111. 95 117 383 3.9 8.8 76/9 RKS Roksa SF 62.57 30.26 58. 95 108.29 -640 372 3.4 6.9 78/7Country: DK, Denmark; N, Norway; S, Sweden: SF, Finland. Rev. Corr. Geomag.: revised
corrected geomagnetic coordinates according to GUSTAFFSON (1970). xKi, YK1: coordinates in Kiruna
System. YK1: westerly deviation of the positive xK1 axis from geographic north. D: magnetic easterly
Z+-21°E J2•e
eRKS
• LNN----t60'
• IMS-Magnetometer .Techn.Univ. Braunschweig
_, •153 nT IHI -, •144nTID1 ,_ttrty) I 0000
___
/ .. 0100 51• • Magnetic Observatory 28°E J2°E 0200UTFig. 1. Upper panel: Station map of the Scandinavian Magnetometer Array in geographic coordinates given by KOPPERS et al. (1979). Solid curve through KIR shows 64.80N corrected geomagnetic latitude (GUSTAFFSON, 1970). Broken lines are the axes of the Kiruna system defined by KOPPERS et al. (1979). Lower panel: Example of a film record from station EVE of the Scandinavian Magnetometer Array (KOPPERS et al., 1979). Curves for the H-, D- and Z-components consist of dots optically recorded by every JO sec (20 sec at some of the stations) exposure.
14 T. ARAKI, H. SHIMAZU, T. KAMEi and H. l·lANADO Scandinavian IMS Magnetometer Array Data
----4--19_._7�.:....:..J...J..-'-L"""'---'--'-'-'75 _
__,_;___�L _
_L__7L_L .�7i,_ ... I_· _ __.'1''---l _ _ IL-·--'--';L-'°--BF.R (h7.2. 113.1) \".\D (66.�. 112.ol Sl,D (bC..7, 112.IJ) F:KS (5lJ.O. 106.:ll ····-···-··· ... . SOY (67. I. 106.lll ---\1.\T (6:i.b. JIJI.Lil ---\!IE (oo.9. !(JUI�---(6-1. 0, !(Ii. 71 (63.5. IC6.6) ltil.o. !C6. I) ./OK 160.�. 105.71 S.\l rn.G. lffi.:I) IITZ.21 Ft I J (b-1.9, !OZ. II KV I (61. I. IUI.7i Sft\" (62.'.J. 101.lll _I:_',:_K,J!il,_7. ___ lrJJ,.ni_ FFtE (oo.7. 'J'J.Z) < d.0 (6-l.�- QB.bi OKS (6:U. 96.31 le IS (lil.ll. (R\.11) 11.\S ('i'.J •. J. '.17.G) ----···-··· ···· N.\\l (62.2. :Ji.I)) \I.\L llill. 7. iJ9.lll FLU (Fll.U. !JI.Ii .\R\" Ci7.Z. UJ.:O HEL (5b.G. b'?.ll KL I <,ii.O. ES\! (5-1.Z. --- --- ---- ··--·---� -- --- --- ---
---·--- ---� --- -···---·---·---···----···---·---·---···---Fig. 2. Interval of available data for each station of the Scandinavian Magnetometer Array. In Figs. 3 and 4 time sequential plots of 30 min data for the 2 events ( abbreviated as 1.9 SC and 4.5 SC, respectively) observed along the Alaska chain of NAMN are shown together with VoLPERs's plots of the SMA data. A- and B-components of the SMA data correspond to the H- and D-components of the Alaska chain data.
According to a model of SC proposed by ARAKI (1979, 1987 and 1988),
waveform of SC in high latitudes consists of two pulses (DPpi and DPwi) with
opposite sense. On the lower latitude side of the auroral zone a positive pulse of the H-component precedes a negative pulse in the morning and a positive pulse follows a negative pulse in the afternoon. The sense reverses on the higher latitude side. The A-component of the SMA data of the both events seems to follow this rule if we assume that most of stations in SMA are at the lower latitude side, because it consists of a positive pulse followed by a negative pulse. The H-component of 4.5 SC observed along the Alaska chain in the afternoon also seems to follow this rule. The first pulse of it is negative at lower latitude stations (TLK, COL, FYU and AVI) and positive at higher latitude station (JOP) as shown by a broken vertical line in Fig. 4. The dotted curves show following pulses (DPllli).
While waveform of the H-component of 1.9 SC is similar to that of 4.5 SC at TLK, it becomes much different from 4.5 SC at higher latitude stations ( especially at AVI and INK) because of superposition of a large amplitude oscillation on 1.9 SC. Since the A- and B-components of both events are similar at SMA, the oscillation seems to appear in a limited longitudinal extent in the afternoon. The Y-componcnt of the interplanetary magnetic field (IMF) is negative for both events and the Z-component is strongly positive for 1.9 SC and nearly zero for 4.5 SC. lt should
IMS MAGNi:TOMETER DATA Jf\tl 9, 1979 ALASKA CHAIN<l1>·� ..,
;3
ALASKA CAHIN<D)150NT 0335 0335 ROS MIE --=- SKO 0400UT Fig. 3. Geomagnetic sudden commencement occurred on January 9, 1979. Upper
panel: records from 6 stations of the Alaska chain (in north-south direction) of the North American IMS Magnetometer Network. Middle panel: from 7 stations of a north-south chain of the Scandinavian Magnetometer Array. Lower panel: from an east-west chain of SMA.
1 6 T. ARAKI, H . SHIMAZU, T. KA MEi and H . HANADO
IMS MAGNETOM�TER DATA APR 5 , 1979
ALASKA CHAIN(D)
I :
Fig. 4. Geomagnetic sudden commencement of April 5, 1979. Upper panel: records from 8 stations along the Alaska chain of the North American IMS Magnetometer Network. Middle panel: from 7 stations of a north-south chain of the Scandinavian Magnetometer Array. Lower panel: from 5 stations of an east-west chain of SMA.
M I I� - H M I K - 0 H I K - Z K I R- H K r n- o K I R- Z P I T-H P I T - 0 P I T - Z CLO-H GL 0 - 0 CL O - Z HUO -H HU0-0 HUO - Z
1978 SEP. 27 (Day 270) IIIK·N ' ILIIA(D 100 !IC • 110 HC IIIK·O F I L l(A(D 100 HC • 150 HC t1U C • Z ' IL llREO 100 IIC .. 110 HC
�---··
---�---500 UNIVERSAL TIME
1978 SEP. 27 ( Day 270) Ct O-M J:' IL UFl'EO •oo UC - UiO SEC ct o-o F' IL IEIUD •oo SEC • '50 SEC CLO-Z F I L HR'.£0 •oo SEC • .,a SEC
600
500 UNIVERSAL TIME 600
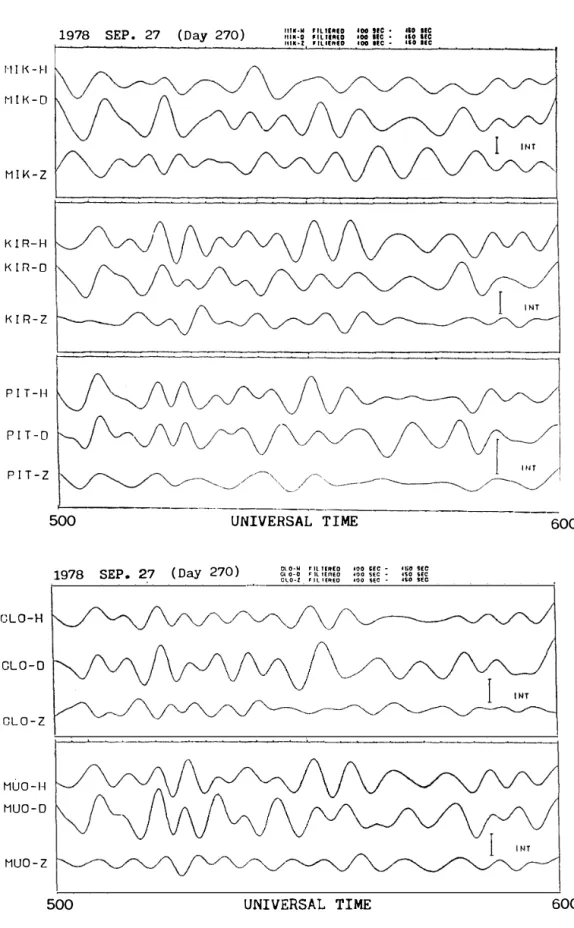
Fig. 5. One hour records of a geomagnetic pulsation observed by the Scandinavian
Magnetometer Array on September 27, 1978. Upper 3 panels: from a north-south chain. Lower 2 panels: from an east-west chain. The positive direction for the H-, and Z-components is downward.
1 8 T. ARAKI, H. SHIMAZU, T. KAMET and H. HANADO
be further studied whether or not the difference in waveform of the both events depends upon the IMF polarity.
3 .2. Geomagnetic pulsation
Geomagnetic pulsations have been analyzed by the following procedure; ( 1) Twenty-four pulsation events were picked up by examining the SMA data from April to December in 1978 at KIR (Kiruna).
1 01 t o' r: :J a:: I-u w 0.. '.J1 0: w 1 01
3:
0 0.. 1 0' 1 0 · 1 0.1 a GLO t o' MIK t o' r: to' :J n:: f- 1 01 u w CL t o' U) a: w t o' 3: 0 0.. 1 0' t o·• -T O -TAL C'# CC'# 0. 0 0. 2 0 . • F R E Q U E NCY KIR a . 2 o . • o. & o. e 1. 1. a o. 2 a. • F R E Q U E N CY x l 0 ·2t S E C" ti F RE_QU E N C Y t 01 I PIT 1 0' r: 1 0' :J a: I- 1 0' u w 0.. 1 01 (j) n:: w 1 013:
0 0.. 1 01t
TO TAL cw ccw � �E
I 0. ii o. a I . 0 x 1 0 ·2r s E c· 11 MUOr
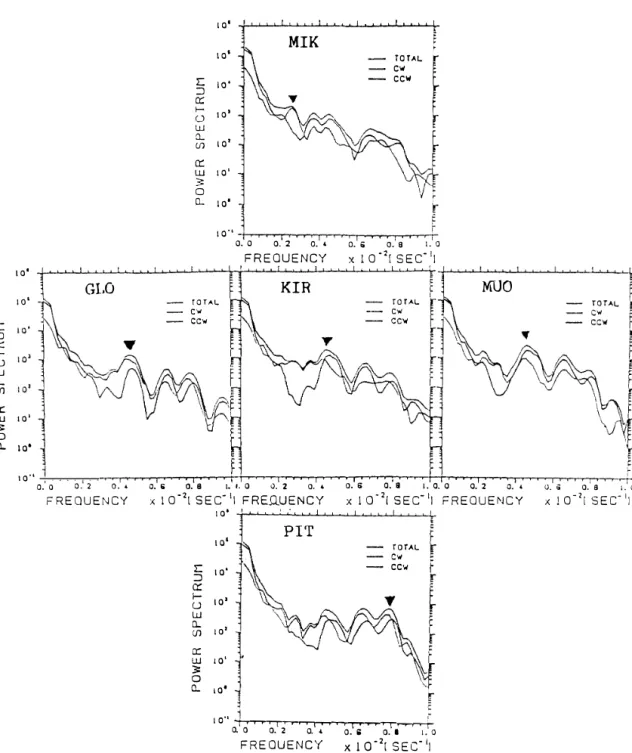
a. s o. a 1 . o. o o. 2 o. • o. ii a. a � X 1 0 · 2 [ S E C"11 F R E O U E �J C Y X 1 0 ·21 S E C-11 TOTAL Cl>I ccw t O"' .,...,...,..-r-r.,..,....,....,...,...,...,.-..-,...,...,....,..,....,..,....,....,..,� o. 0 0. 2 0. • o. Ii 0. I I . 0 F R E Q U E N C Y x 1 0 ·2r s E c· 11Fig. 6. Power spectrum of the geomagnetic pulsation shown in Fig. 5. The spectrum was calculated separately for clockwise-, counter clockwise-components of horizontal polarization and total horizontal vector.
(2) Corresponding NAMN data at COL (College ) in nearly the same geo magnetic latitude as KIR were checked and pulsation activity was found in 9 events.
( 3) The SMA data at KIR for the events were digitized and plotted. The waveforms at KIR and COL were compared.
( 4) Detailed properties of the spectrum and polarization were studied for 2 events among the 9 events above.
Figure 5 shows one hour plots of a geomagnetic pulsation observed along the north-south (MIK, KIR, PIT) and the east-west (GLO, MUO) chain of SMA. The phase of the oscillation proceeds from south to north and from east to west. This is consistent with an assumption that the pulsation is caused by the Kelvin Helmholtz instability on the magnetopause. The result of the spectrum analysis at the 5 stations is given in Fig. 6. The dominant frequency decreases with increasing latitude along the north-south chain, whereas it is nearly constant along the east west chain.
It was found that simultaneous occurrence of pulsations with similar period at SMA and NAMN was very rare. Figure 7 is a plot of an event in which a geomagnetic pulsation appeared in both SMA and the Alaska chain. This event is very peculiar in the fact that not only the frequency but also waveform is similar at College in the morning and Kiruna in the afternoon. Detailed properties of this event are now investigated.
K l RUNA r,,s HACNE 10t1E ,rn o.i •
1 9 78. S E P. 27 <OAY 2 7 0 l
.�---�
K I R - Z
1500
C O L L E C E ! H S tU,CNE TOtt£ TER DATA
1 97 8, SEP. 27 l DAY2 70J COL-H COL - 0 COL - Z 1 500 UNIVERSAL TIME UNIVERSAL TIME I 20NT 1600 1600 Fig. 7. One hour records of a geomagnetic pulsation observed simultaneously in the afternoon
(KIR: Kiruna in Scandinavia) and morning (COL: College in Alaska) with similar waveform. Positive direction for the H- and Z-components at KIR is downward.
20 T. ARAKI, H. SHIMAZU, T. KAMEI and H. HANAoo
4. Conclusions
Although the analysis of the SMA data has just begun in Japan and it is still in the beginning stage, we have confirmed from our provisional experience that the data are very useful for studying fine structure and local time dependence of geomagnetic rapid variations. We hope, therefore, that many research workers will be interested in the data and use the data for their research. One problem is a considerable amount of time required for digitizing the data, so that it is desirable to develop a way of automatic digitization of the data.
Acknowledgments
We would like to express our sincere thanks to Profs. J. UNTIEDT and M. SIEBERT and Drs. W. BAUMJOHANN, K.-H. GLASSMEIER and K. SCHLEGEL for their kind arrangements for transferring the SMA data to the World Data Center C2 for Geomagnetism, Kyoto. We also thank Miss S. lsHIBASHI for preparing the publication of the data. This research was partly supported by the Grant-in-Aid for Scientific Research No. 0 1460272 from the Ministry of Education, Science and Culture, Japan.
References
ARAKI, T. ( 1 977 ) : Global structure of geomagnetic sudden commencements. Planet. Space Sci.,
25, 373-384.
ARAKI, T. ( 1 987 ) : A model of geomagnetic sudden commencement. Quantitative Modeling of Magnetosphere-Ionosphere Coupling Processes, extended abstract for the Symposium,
ed. by Y. KAMIDE, 47-52.
ARAKI, T. and NAGANO, H. ( 1 988 ) : Geomagnetic response to sudden expansions of the magneto sphere. J. Geophys. Res., 93, 3983-3988.
GusTAFFSON, G. ( 1 970 ) : A revised corrected geomagnetic coordinate system. Ark. Geofys., 5, 595-617.
KUPPERS, F., UNTIEDT, J., BAUMJOHANN,
w.,
LANGE, K . and JONES, A. G . ( 1 979 ) : A twodimensional magnetometer array for ground-based observations of auroral zone electric currents during the I nternational Magnetospheric Study ( IMS) . J. Geophys., 46, 429-450.
VoLPERS, H . ( 1 984 ) : Untersuchung und I nterpretation zweier <lurch SSC's angeregter Pc 5 Pulsationsereignisse, gemessen mit einem Magnetometernetz in Nordskandinavien. Ph.D. Thesis, Geophysical Institute, University of Miinster.