PERFORMANCE MEASUREMENTS ON A UAV-SCALE CYCLOIDAL ROTOR IN HOVER
A Thesis by
ADAM JOHN KELLEN
Submitted to the Office of Graduate and Professional Studies of Texas A&M University
in partial fulfillment of the requirements for the degree of MASTER OF SCIENCE
Chair of Committee, Moble Benedict Committee Members, John Valasek
Edward White Sivakumar Rathinam Head of Department, Rodney Bowersox
May 2019
Major Subject: Aerospace Engineering
ABSTRACT
This thesis discusses the optimization of a UAV-scale cycloidal rotors (or cyclorotor0s) aero-dynamic performance in hover through an extensive experimental parametric study and the de-velopment of a cyclocopter UAV. The current parametric study focused on collecting systematic time-averaged thrust and power measurements to characterize the effect of pitch kinematics and rotor geometry on the performance of a cyclorotor operating at Reynolds numbers between 100,000 and 300,000. Experiments were conducted for a range of rotational speeds across different blade pitch amplitudes for rotor configurations with varying airfoils, blade spans, chord-by-radius ratios, and number of blades. Based on the 37 unique rotor configurations, at an operating Reynolds number of 200,000, the optimal cycloidal rotor configuration had a chord-by-radius ratio of 0.66, 3 blades featuring a blade aspect ratio (span/chord) of 4 and a NACA 0020 airfoil, rotor aspect ratio (span/diameter) of 1.33 and cyclic pitch amplitude of ±40◦ and obtained a figure of merit of 0.6. The 17 lb. technology demonstrator prototype featured a dual-rotor configuration with cyclorotors featuring a novel split-blade design positioned at the front and rear of the vehicle. The vehicles rotors were designed based on the results from the parametric study. Flight performance was demonstrated through gimbal, tethered and free-flight tests.
DEDICATION
ACKNOWLEDGMENTS
I would like to begin by acknowledging and thanking my advisor Moble Benedict. I first met Dr. Benedict when I was a Junior looking for an opportunity to work and learn about academic research and what it meant to be a graduate student. Even as an undergraduate, he pushed me to take ownership of my own project and participate in the summer research program (USRG). Both experiences proved instrumental in my selection as an outstanding senior engineer in 2016 and my eventual decision to attend graduate school. Now over all of the years I have spent in the Advanced Vertical Flight Lab I have been exposed to numerous projects and learned more than I ever would of considered possible. It has been a pleasure and honor to work and learn under Dr. Benedict and I could not have asked for a better mentor.
A special acknowledgement and thank you for all of the students, professors and staff at Texas A&M University and especially those in the Aerospace Engineering department. Between the amazing advisers, business staff, secretaries and professors I always felt welcomed and appreci-ated. The sense of family in the department is unmatched and I could not of asked for a better place to spend my collegiate career. A special thank you to Dr. John Valasek, Dr. Edward White, and Dr. Sivakumar Rathinam for agreeing to serve on my committee.
I would remiss if I didn’t thank each and every one of my fellow coworkers in the Advanced Vertical Flight Lab. Spending everyday down in the basement working would not of been half as memorable or rewarding without you. Whether is consulting about a question or problem with my research or debating current events and politics everyday in the lab was a new adventure that I will not soon forget. A special thanks to the two undergraduate students, Joel White and Matthew Kendall, who dedicated countless hours to assisting me with my projects.
My family deserves the biggest thanks of all as nothing that I accomplished would have been possible without them. My parents instilled in me the discipline and values I needed to be successful in engineering. Beyond that they provided me with everything I needed to nurture my love for science and technology as a kid and have continued that support throughout my collegiate
career. My brothers and sister were always calling to check in on my progress and encourage me to fight through the problems that arose in my research. My loving wife, Victoria, has always been my rock and constant source of encouragement. No matter how school and research was going, I was blessed to be able to come home to her and could not of asked for a better partner to go through it all with.
I would like to end by taking a moment to thank everyone else I interacted with in the last seven years who I may have missed mentioning above. Individuals from across the university and across the country have supported me and my work and I am deeply thankful for the roles they have played.
CONTRIBUTORS AND FUNDING SOURCES
Contributors
This work was supported by a thesis committee consisting of Professor Moble Benedict (ad-visor), Professor John Valasek and Professor Edward White of the Department of Aerospace Engineering and Professor Sivakumar Rathinam of the Department of Mechanical Engineering.
Undergraduate research assistants, Joel White and Matt Kendall, provided assistance during the parametric study presented in Chapter 3. The design for the flight controller utilized on the demonstration vehicle presented in Chapter 4 was completed by Dr. Vikram Hrishikeshavan from the department of Aerospace Engineering at the University of Maryland.
All other work conducted for the thesis was completed by the student independently. Funding Sources
Graduate study was supported under a grant from the Army/Navy/NASA sponsored Vertical Lift Research Center of Excellence (VLRCOE) led by the University of Maryland (Grant Number - 46731-Z8458101). Dr. Mahendra Bhagawat serves as the Technical Monitor.
NOMENCLATURE
A Rectangular projected area,(b×2R),m2
AS Blade swept area,2πRb,m2
b Blade span,m
c Blade chord length,m
c/R Chord-by-Radius ratio CP Power coefficient,P ρA(ΩR)3 CQ Power coefficient,Q ρAR(ΩR)2
CT Power coefficient,TRes
ρA(ΩR)2
D Diameter,m
DL Disk loading,TRes
A, mN2
FM Figure of merit
L1, L2, L3, L4 Linkage lengths of the four-bar pitch mechanism
Nb Number of blades
P Total aerodynamic power,QΩ,W
P L Power loading,TRes
P, WN
Q Aerodynamic torque,Nm
R Radius,m
TRes Resultant thrust,
p T2
Y +TZ2,N
TZ Rotor vertical thrust,N
TY Rotor sideward thrust,N
ρ Air density, mkg3
σ Rotor solidity,Nbc
2πR
Φ Thrust angle,tan−1 TY
TZ
,Deg
ψ Azimuthal position of blade,Deg
TABLE OF CONTENTS
Page
ABSTRACT . . . ii
DEDICATION . . . iii
ACKNOWLEDGMENTS . . . iv
CONTRIBUTORS AND FUNDING SOURCES . . . vi
NOMENCLATURE . . . vii
TABLE OF CONTENTS . . . ix
LIST OF FIGURES . . . xi
LIST OF TABLES. . . xiv
1. INTRODUCTION . . . 1
1.1 Cycloidal Rotor Operating Principle . . . 1
1.2 Literature Review . . . 2
1.3 Research Objectives . . . 7
2. EXPERIMENTAL PROCEDURE . . . 8
2.1 Cycloidal Rotor Hover Test Stand . . . 8
2.1.1 Rotor Design . . . 11
2.1.1.1 Blade Design . . . 12
2.1.1.2 Pitch Mechanism . . . 13
2.1.1.3 Support Structure and Transmission. . . 15
2.1.2 Tested Configurations . . . 16
2.2 Data Collection and Processing . . . 18
3. PARAMETRIC STUDY . . . 19 3.1 Aerodynamic Measurements . . . 20 3.1.1 Cyclorotor Forces . . . 20 3.1.2 Power Analysis . . . 22 3.2 Rotor Parameters . . . 23 3.2.1 Virtual Camber . . . 23
3.2.3 Effect of Blade Airfoil Thickness. . . 30
3.2.4 Effect of Blade Span (Blade Aspect Ratio) . . . 33
3.2.5 Effect of Chord-by-Radius Ratio . . . 36
3.2.6 Effect of Number of Blades . . . 41
3.2.7 Effect of Rotor Solidity . . . 44
3.3 Optimal Geometry . . . 47
3.4 Concluding Remarks . . . 48
4. TECHNOLOGY DEMONSTRATOR PROTOTYPE . . . 50
4.1 Vehicle Design . . . 50
4.1.1 Rotor Design . . . 53
4.1.1.1 Rotor Geometry and Blade Kinematics . . . 53
4.1.1.2 Pitch Mechanism . . . 55
4.1.1.3 Blade Design . . . 56
4.1.1.4 Rotor Support Structure and Transmission. . . 58
4.2 Attitude Control Strategy . . . 59
4.2.1 Avionics and Feedback Control. . . 61
4.3 Experimental Testing . . . 62
4.4 Concluding Remarks . . . 64
5. SUMMARY AND CONCLUSIONS . . . 65
5.1 Future Work . . . 67
LIST OF FIGURES
FIGURE Page
1.1 Cyclorotor concept . . . 2
1.2 Kirsten0s cyclorotor study. . . 3
1.3 Bosch Aerospace cyclorotor. . . 4
1.4 MAV-scale cyclocopters.. . . 5
1.5 P LvsDL: MAV-scale cyclocopter and conventional rotor . . . 5
1.6 Power vs. Forward Speed: trimmed flight of MAV-scale cyclorotor . . . 6
1.7 Seoul National University cyclocopters. . . 6
2.1 Cyclorotor blade coordinates . . . 8
2.2 Cycloidal rotor hover test stand: 3-component balance . . . 9
2.3 Hover stand configurations.. . . 9
2.4 Force balance. . . 10
2.5 Torque balance.. . . 11
2.6 Hover stand cyclorotor design. . . 11
2.7 Cyclorotor blade design. . . 13
2.8 Manufactured blades for parametric study. . . 13
2.9 Hover stand cyclorotor pitch mechanism.. . . 14
2.10 L3andL2links. . . 14
2.11 Hover stand cyclorotor structure. . . 15
2.13 Hover stand LabVIEW VI . . . 18
3.1 Cyclorotor area definitions. . . 19
3.2 Thrust vs. RPM: 2-bladed cyclorotor. c/R = 0.26, PA =±30◦. . . 21
3.3 Thrust vs. RPM: 6-bladed cyclorotor. c/R = 0.66, PA =±30◦. . . 21
3.4 Power vs. RPM: 2-bladed cyclorotor. c/R = 0.26, PA =±30◦. . . 23
3.5 Power vs. RPM: 6-bladed cyclorotor. c/R = 0.66, PA =±30◦. . . 23
3.6 Virtual camber effect. . . 24
3.7 P Lvs. DL: 2-bladed cyclorotor. c/R = 0.66, varying symmetric pitch amplitudes . . . 26
3.8 P Lvs. DL: 4-bladed cyclorotor. c/R = 0.66, varying symmetric pitch amplitudes . . . 26
3.9 P Lvs. DL: 2-bladed cyclorotor. c/R = 0.66, varying asymmetric pitch amplitudes . 27 3.10 P Lvs. DL: 4-bladed cyclorotor. c/R = 0.66, varying asymmetric pitch amplitudes . 28 3.11 Optimal Pitch Amplitude vs. Chord-by-Radius Ratio: 2-bladed cyclorotor . . . 29
3.12 Optimal Pitch Amplitude vs. Number of Blades: varying chord-by-radius ratio . . . 30
3.13 CT vs. Pitch Amplitude: varying airfoil thickness . . . 31
3.14 CP vs. Pitch Amplitude: varying airfoil thickness . . . 32
3.15 P Lvs. DL: varying airfoil thickness . . . 33
3.16 CT/σvs. AR: varying chord-by-radius and pitch amplitude . . . 34
3.17 CP/σvs. AR: varying chord-by-radius and pitch amplitude . . . 34
3.18 P Lvs. ARfor fixed disk loading: varying chord-by-radius and pitch amplitude . . . 35
3.19 2-bladed cyclorotor with elliptical endplate . . . 36
3.20 P Lvs. DL: 2-bladed cyclorotor with and without endplate . . . 36
3.21 Φvs. c/R: varying pitch amplitude . . . 38
3.22 Thrust vs. c/R: varying pitch amplitude . . . 39
3.23 Power vs. c/R: varying pitch amplitude . . . 39
3.25 CT/σ vs. N b for fixed disk loading: varying chord-by-radius ratio and pitch
amplitude . . . 42
3.26 CP/σ vs. N b for fixed disk loading: varying chord-by-radius ratio and pitch amplitude . . . 43
3.27 P Lvs. N bfor fixed disk loading: varying chord-by-radius ratio and pitch amplitude 44 3.28 CT/σvs. σ: varying rotor configuration . . . 45
3.29 CT/σvs. σ: varying rotor configuration . . . 46
3.30 P Lvs. σ: varying rotor configuration . . . 47
3.31 F M vs. σ: optimal pitch kinematics for every rotor configuration . . . 48
3.32 Optimal cyclorotor configuration . . . 48
4.1 Cyclocopter concept . . . 51
4.2 17 lb cyclocopter pictured with 29 g cyclocopter. . . 51
4.3 Vehicle cyclorotor performance. . . 55
4.4 Four-bar pitch mechanism: Schematic and vehicle. . . 56
4.5 Technology demonstrator blade design.. . . 58
4.6 Cyclorotor structure and transmission. . . 59
4.7 Control definitions. . . 60
4.8 Attitude control strategy. . . 61
4.9 Motor reaction torques effect on pitch stability. Pitch up maneuver represented. . . 61
4.10 Feedback loop. . . 62
4.11 Gimbal test stand. . . 63
4.12 Tethered flight test . . . 63
LIST OF TABLES
TABLE Page
2.1 Tested configurations. . . 17 4.1 Design specifications for cyclocopter.. . . 52 4.2 Weight breakdown for cyclocopter. . . 52
1. INTRODUCTION
Unmanned Air Vehicles (UAVs) are a key technology shaping the future. They are capable of accomplishing tasks that were previously too difficult, costly, or unsafe to complete from the ground or via manned aircraft. Creating the next generation of vertical takeoff and landing (VTOL) capable UAVs requires revolutionary vehicle concepts. Traditionally these concepts would rely on conventional rotors/propellers as their primary means of propulsion. Unfortunately, conventional rotors tend to suffer from high susceptibility to gust disturbances and high acoustic signatures. A cycloidal rotor (or cyclorotor) is a revolutionary horizontal-axis propulsion system which is capable of near instantaneous thrust vectoring about the rotor azimuth. Cyclorotors are now being investigated as an alternative propulsion system for larger UAVs. The work presented in this thesis involves the experimental optimization of a UAV-scale cyclorotor0s aerodynamic performance and the creation of a technology demonstrator vehicle.
1.1 Cycloidal Rotor Operating Principle
A cyclodial rotor, or cyclorotor, is a rotary-based propulsion system consisting of multiple blades rotating about an offset horizontal axis (Fig. 1.1a). Each blade can rotate about its pitch axis with the span positioned parallel to the axis of rotation. To create a net vertical force, the blades are cyclically pitched in a 1/rev fashion such that the blades experience positive geometric angles of attack during both the top and bottom halves of its circular trajectory (Fig. 1.1b). The magnitude and direction of the net thrust vector can be changed by varying the amplitude and phase of the cyclic blade pitch kinematics.
Compared to traditional rotary systems the cyclorotor provides several unique advantages. Aerodynamically, each span-wise blade element of a cyclorotor operates at similar aerodynamic conditions, thus tending to show that the blades can be easily designed to maximize thrust and aerodynamic efficiency. The cyclic pitching kinematics combined with the high blade pitch rates combined delays the onset of blade stall further augmenting the thrust generation of the cyclorotor.
Furthermore, the ability to instantaneously vary the magnitude and direction of the net thrust vector can provide high control authority for cyclorotor-based aircraft, referred to as ”cyclocopters”, compared to multirotor based systems.
(a) Rotor schematic (b) Blade kinematics and forces Figure 1.1: Cyclorotor concept
1.2 Literature Review
The cyclorotor concept originated in the early 20th century [1]. Many of the earliest attempts failed to achieve much success due to structural and aerodynamic challenges. Interest in cycloro-tors quickly lessened with the successful demonstration of conventional helicopters, but scientific studies continued due to the benefits a cyclorotor system could provide. The current section discusses many of scientific studies that were conducted on cyclorotors since the 1920s.
One of the earliest significant scientific studies on cyclorotors was conducted in the 1920s by Professor Kurt Kirsten at the University of Washington [2, 3]. The study was conducted as part of an engineering effort with Boeing with the goal of constructing a cyclorotor for an airship followed by the creation of a ”cycloplane” (Fig. 1.2). Several generations of cyclorotors were designed and tested in preparation for full-scale testing. Unfortunately, the airship designated to be used for the full-scale testing crashed before testing could be completed leading to the indefinite suspension of
study. With suspension of the air vehicle testing the cyclorotor design was modified to be used as a ship propeller (Fig. 1.2c). The resulting rotor was integrated into a ship and extensively tested with travel distances totaling 4000 nautical miles. This initial design was improved over the coming decades into the voith-schneider propeller which remains the only commercial application of the cyclorotor to date [4].
(a) Cyclorotor driven airship (b) Cycloplane (c) Ship cyclopropeller Figure 1.2: Kirsten0s cyclorotor study.
Between 1924 and 1933, Strandgren conducted a series of experimental studies and the first ever computational study of the aerodynamics of a cyclorotor [5]. During his experiments he created and tested a full scale cyclorotor system, but the real advance came as part of his computa-tional work. Through his work the first ever aerodynamic model was created to predict the thrust of a cyclorotor system.
During the same time period, John Wheatley at the Langley Memorial Aeronautical Laboratory conducted his own experimental and analytical studies [6, 7]. Wheatley levered his analytical study to examine the feasibility of the cyclorotor for manned aircraft. Based on the results it was determined that aerodynamically the system is sound, but there are large structural challenges that must be addressed. For Wheatley0s experimental study, he tested a cyclorotor with an 8 ft. diameter and span in the NACA 20 ft. wind tunnel at advanced ratios between 0.2 and 0.5. The experimental results and the differences found from the analytical results demonstrated the need to properly account for the highly unsteady nature of a cyclorotors aerodynamics to accurately
predict performance. Unsteady aerodynamics were not fully understood at that time and would not be integrated into analytical studies until much later.
The onset of World War 2 and the lack of successful demonstrations of cyclorotor based vehicle led to a significant reduction in the number of studies conducted following the work of Strandgren and Wheatley. The development of advanced composite material and expanded interest in unmanned aerial vehicles led to the reemergence of interest in the study of cyclorotors in the late 1990s. In response to a request for an innovative propulsion system Bosch Aerospace proposed the use of a cyclorotor for a 600 lb UAV [8, 9]. Experimental and analytical studies were conducted with large improvements in both areas, but unfortunately flight was never demonstrated (Fig. 1.3).
(a) Test rotor (b) UAV concept
Figure 1.3: Bosch Aerospace cyclorotor.
Entering into the 21st century pioneering research on cyclorotors has been conducted at the University of Maryland, Texas A&M University, and Seoul National University. Work conducted at the University of Maryland and Texas A&M University focused on the development micro air vehicle (MAV) scale cyclorotors. Their research has resulted in the creation of cyclocopters between 29 and 800 grams (Fig. 1.4) [10, 11, 12]. The research established a fundamental under-standing of the aeromechanics of MAV-scale cyclorotors. Systematic performance measurements at MAV scales demonstrated higher hover efficiency than a conventional rotor because of uniform aerodynamic loading along blade span and favorable unsteady aerodynamic phenomena (Fig. 1.5) [13, 14, 15, 16]. Wind tunnel studies showed the cyclorotor is capable of efficient high-speed forward flight even beyond an advance ratio of 1.0 by phasing its cyclic pitch, essentially thrust
vectoring (Fig. 1.6) [17, 18, 19]. Thrust vectoring capability means a cyclocopter can transition from hover to high-speed forward flight without any configuration change [20].
(a) University of Maryland cyclocopters (b) Texas A&M cyclocopter [21] Figure 1.4: MAV-scale cyclocopters.
Figure 1.6: Power vs. Forward Speed: trimmed flight of MAV-scale cyclorotor [19]
Work conducted at Seoul national university focused on the creation of UAV-scale cyclorotors ranging between 10 kg and 110 kg [22, 23, 24, 25]. Prior to the design of the vehicles a multi-disciplinary optimization problem was solved computationally to determine the design capable of producing the maximum thrust for the defined power. The results were used in the construction of multiple cyclocopters. The two vehicles which have achieved stable flight are a dual rotor cyclocopter with a conventional tail propeller and a four rotor cyclocopter (Fig. 1.7).
(a) Dual-rotor cyclocopter tethered flight [25] (b) Four rotor cyclocopter free flight [26] Figure 1.7: Seoul National University cyclocopters.
1.3 Research Objectives
The study presented here represents an extension of previous research regarding UAV-scale cyclorotors. Previous UAV-scale studies successfully demonstrated vehicle flight, but lacked suffi-cient ssuffi-cientific studies to determine the optimal rotor geometry. The previous study was conducted analytically with minimal experimental validation and focused on determining a configuration which would produce the maximum thrust for the available engine power. The study was a signif-icant first step, but the study set parameter boundaries that were too narrowed to definitively state the optimal configuration nor determine the effect each geometric parameter has on aerodynamic performance. The current study will include a systematic experimental study to quantify the effect of each geometric parameter (airfoil thickness, blade aspect ratio, chord-by-radius ratio, number of blades, and rotor solidity) and pitch kinematics on thrust generation and aerodynamic efficiency. The results of the experimental study will be used in the construction and demonstration of an an optimized UAV-scale cyclocopter.
2. EXPERIMENTAL PROCEDURE
The goal of the current experimental study is to characterize the effect of a cyclorotor0s rotor geometry and pitch kinematics on aerodynamic performance in hover. To conduct this study a state-of-the-art hover stand featuring a three-component force balance was designed and built in-house. The cyclorotor models tested in the experimental study were developed to simplify changes in geometric parameters while maintaining high stiffness-to-weight ratios. Time-averaged data measurements were conducted to characterize aerodynamic performance of each rotor configura-tion.
2.1 Cycloidal Rotor Hover Test Stand
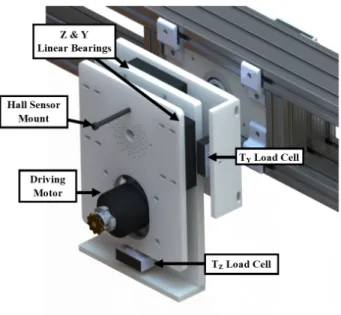
The hover stand was designed to measure vertical thrust (TZ), sideward thrust (TY), aerody-namic torque (Q), and rotational speed. From these measurements, the resultant thrust (TRes) magnitude and direction (acting at an angleΦas shown in Fig. 2.1), aerodynamic power (P) and relevant performance metrics can be obtained. The hover stand was created from a support frame and force/torque balance sub-assemblies (Fig. 2.2).
Figure 2.2: Cycloidal rotor hover test stand: 3-component balance
The support frame was created using pre-fabricated 80-20 extrusions. The extrusions simplified manufacturing and provided flexibility for testing various rotor spans. The frame0s base could also be reassembled to provide two separate test heights, one ideal for hover testing (Fig. 2.3a) and one ideal for wind tunnel testing in the Oran W Nicks low speed wind tunnel at Texas A&M University (Fig. 2.3b) [27].
(a) Tall configuration (b) Wind tunnel configuration Figure 2.3: Hover stand configurations.
The force balance design featured a series of load plates machined from Delrin mounted to linear bearings and fixed in place by load cells (Fig. 2.4). Linear bearings with a coefficient of friction of 0.003 (Tusk BX5-2) were used in the Y and Z direction. The bearings created the freedom of movement and load path in one direction for each individual plate while transferring the remaining forces and torques. The load cells feature a 25 lbs (111 N) limit (Transducer Techniques MLP-25). The load cells were calibrated after mounted to account for frictional losses in the linear bearings. The primary and secondary force balances feature similar designs except for the larger front plate used for mounting the driving motor and the Hall-effect sensor, which generated a 4/rev signal to measure rotational speed.
Figure 2.4: Force balance.
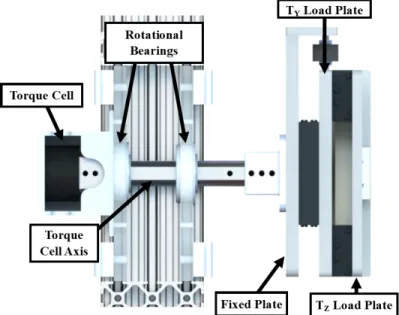
The torque balance assembly features the force balance assembly mounted on a D-rod through two rotational bearings (Fig. 2.5). The 3/4” aluminum D-rod transfers all forces in the Y and Z directions (Fig. 2.1) through the rotational bearings mounted in the support frame. Rotational movement is restricted by the torque cell with a 200 in-lb (22.6 N-m) limit (Transducer Techniques TRT-200). Similar to the load cells, the torque cell is calibrated, once mounted on the frame, to account for frictional losses in the bearings.
Figure 2.5: Torque balance. 2.1.1 Rotor Design
The cyclorotor used for the parametric study was designed to be versatile for testing numerous rotor configurations and simple to manufacture. Transverse centrifugal loads in excess of 100gs creates the need for all components to be designed with high strength to weight ratio. The primary elements of the structure are the rotor blades, pitch control arms and support structure (Fig. 2.6).
2.1.1.1 Blade Design
Cyclorotor blades must be carefully designed to ensure durability and functionality in the presence of the centrifugal and aerodynamic loads. The high centrifugal loads on a cyclorotor introduce large transverse bending loads. Aerodynamic loads do not exceed the combined lift and drag on each of the blades meaning their contribution to blade deformation is minimal compared to the centrifugal loads. To that end the blades are designed primarily accounting for the centrifugal loads meaning the primary goal is to maximize the blade0s stiffness-to-weight ratio.
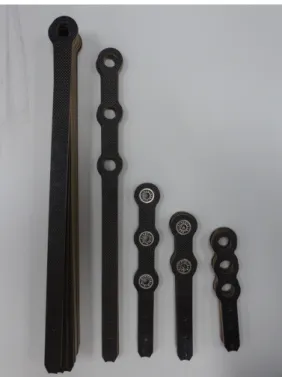
The blade design was improved and modified with the manufacturing of each blade, however each blade design was based on an assembly of blade ribs, filler foam, and composite tubes (Fig. 2.7). The blade ribs were cut from a carbon fiber laminate structure with a foam core (Fig. 2.7a). The material provides a high strength to weight ratio with the only compromise being reduced compressive strength and a laminated structure. In the split blade design, a 1mm thick aluminum ring was machined and pressed into every rib to provide a mounting surface for the roller bearings that transferred loads to the entire rib structure. The filler space between the ribs is filled with low-density Rohacell foam assemblies (Fig. 2.7b). The foam formed the outer shape of the blade and provided a continuous surface for mounting the mylar (MonokoteR
) cover. The foam provides minimal bending strength so its weight was severely limited through the removal of large portions of the material in the center of each rib structure. Since epoxy is heavy, the larger leading edge pieces of the filler foam are connected using wooden dowel pins to reduce weight. The main structural rod and pitching axis running between the side supports is a 3/8” pultruded carbon fiber tube. Smaller 3/16” carbon fiber tubes run through the rear of each blade (Fig. 2.7c). The rods provide additional structural stiffness as well as the mounting point for the rear pitch control rod. Nylon spacers on each side of the solid blades, or blade halves in the split blade, prevent any pinching between the blades or supports. In total, 9 different types of blades were manufactured with multiples of each blade type created, equating to a total of 26 blades (Fig. 2.8).
(a) Rotor rib (b) Filler foam
(c) Assembled blade (d) Wrapped blade
Figure 2.7: Cyclorotor blade design.
(a) Varied blade spans and types. (b) Varied airfoil thickness. (c) Varied blade chord. Figure 2.8: Manufactured blades for parametric study.
2.1.1.2 Pitch Mechanism
The pitch control mechanism developed for use on the cyclorotor must be capable of accurately generating the desired pitch kinematics while being simple to manufacture. The pitch mechanism design was created using a four-bar linkage due to its ability to kinematically couple pitch kine-matics to rotor rotation (Fig. 2.9a).
The four bar mechanism was recreated using four fixed lengths (Fig. 2.9b). The rotor radius (support arms) serves asL1. A machined Delrin link serves as the primary control link (L2). L3 is the pitch control link which transfers the required forces to achieve cyclic pitching and was created
using one of two methods depending on the link length (Fig. 2.10). The three longest pitch links were machined from a 1/16” birch carbon fiber laminate with a machined Delrin fork link at the connection point between the rotor blades and offset link. The remainder of the pitch links were machined from a 1/16” carbon fiber plate. The distance between the blade pitch axis and the pitch link (L3) mounting point serves asL4.
(a) Schematic (b) Hover stand
Figure 2.9: Hover stand cyclorotor pitch mechanism.
2.1.1.3 Support Structure and Transmission
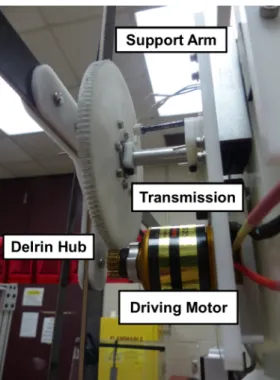
The rotor support must be capable of withstanding the large tension loads resulting from the centrifugal loads on the blades. To ensure the rotor is capable of handling the large loads with minimal deflection and to minimize rotor weight, the support arms were machined from a 5/32” thick laminate composite material (Fig. 2.11). The carbon fiber laminate features a birch core and is capable of handling both the large tension loads and any compressive loads caused during handling. Roller bearings were pressed into the mounting points to provide a rotational degree of freedom for the fixed blade designs. To provide configuration flexibility the support arms were sandwiched in the center hub, which was created from two Delrin plates. The hub allowed experimenting with differing numbers of blades as well as replacing the support arms with the desired length (Fig. 2.12). The rotor support structure was driven via a spur-gear based transmission system with a gear ratio of 7.78:1 and a driving motor. The design ensured the electric motor would operate at its efficient high-speed low-torque condition.
Figure 2.12: Hover stand support arms. 2.1.2 Tested Configurations
During the experimental parametric study a total of 37 unique degree configurations were tested. Each of these configurations was tested at cyclic pitch amplitudes of ±15◦ ±20◦ ±25◦ ±30◦ ±35◦ and±40◦. Two of the configurations (#6 and #9) were tested with additional asym-metric cyclic pitch amplitudes and one configuration (#24) was tested with elliptical endplates. In total, 234 unique combinations of geometric configurations and pitch kinematics was tested. Table 2.1 provides a summary of the geometric parameters of all of the rotor configurations tested.
# c(in) Nb R(in) b(in) Airfoil 1 5.5 2 5.5 22 NACA0020 2 5.5 2 6.0 22 NACA0020 3 5.5 2 6.66 22 NACA0020 4 5.5 2 7.5 22 NACA0020 5 5.5 2 8.25 16.5 NACA0020 6 5.5 2 8.25 22 NACA0020 7 5.5 2 8.25 27.5 NACA0020 8 5.5 3 8.25 22 NACA0020 9 5.5 4 8.25 22 NACA0020 10 5.5 5 8.25 22 NACA0020 11 5.5 6 8.25 22 NACA0020 12 5.5 2 9.17 22 NACA0020 13 5.5 2 11.0 16.5 NACA0020 14 5.5 2 11.0 22 NACA0020 15 5.5 2 11.0 27.5 NACA0020 16 5.5 3 11.0 22 NACA0020 17 5.5 4 11.0 22 NACA0020 18 5.5 5 11.0 22 NACA0020 19 5.5 6 11.0 22 NACA0020 20 5.5 2 13.33 22 NACA0020 21 5.5 2 16.66 22 NACA0020 22 5.5 2 20.0 22 NACA0020 23 5.5 2 21 22 NACA0015 24 5.5 2 21 22 NACA0020 25 5.5 2 21 22 NACA0025 26 5.5 3 21 22 NACA0020 27 5.5 4 21 22 NACA0020 29 5.5 5 21 22 NACA0020 30 5.5 6 21 22 NACA0020 31 8.0 2 5.5 22 NACA0020 32 8.0 2 8.25 22 NACA0020 33 8.0 2 11.0 22 NACA0020 34 8.0 2 13.33 22 NACA0020 35 8.0 2 16.66 22 NACA0020 36 8.0 2 20.0 22 NACA0020 37 10.0 2 13.33 22 NACA0020
2.2 Data Collection and Processing
Voltage measurements from the load cells, torque cells and Hall-effect sensors was collected using a National Instruments data acquisition (DAQ) input board. The DAQ acquired 2000 samples over 2 seconds at a 1 KHz sampling rate before passing it to the computer to be processed in the LabVIEW software. The LabVIEW software provided the interface necessary for determining the reference measurement for zero load on the load and torque sensors, averaging the data over the extended time, and processing the Hall-effect sensor data to equate it to a rotational speed (Fig. 2.13). Experimental data points were taken as an average of 8 seconds worth of samples. Experiments were repeated three times for each configuration to ensure repeatability in results. The respective data files were then post-processed using MATLAB. The large volume of data led to the use of multiple data organization and manipulation techniques to ensure accurate processing and plotting.
3. PARAMETRIC STUDY
A systematic experimental parametric study has been conducted on the UAV-scale cyclorotor by varying blade kinematics and rotor geometry to investigate their effect on cyclorotor perfor-mance in terms of both thrust and aerodynamic efficiency, quantified in terms of both power loading (thrust/power) and figure of merit (FM) [28, 29, 30]. Unlike traditional rotors, cyclorotors have differing swept and projected areas, thus non-dimensionlized parameters, CT, CP, and FM, and disk loading (thrust/area), are calculated based on the projected rectangular area perpendicular to the resultant thrust vector (A = Db) while rotor solidity, σ, is calculated using the swept area (As = πDb) (Fig. 3.1). The following sections provide a detailed discussion on the method undertaken for aerodynamic force and power power measurements, the effect of various rotor parameters on aerodynamic performance and the optimal rotor geometry.
3.1 Aerodynamic Measurements 3.1.1 Cyclorotor Forces
The fixed frame coordinates utilized in the force measurements are shown in Fig. 2.1. TZ is the vertical force andTY is the sideward force. The angle,Φ, made byTRes to the vertical is given by Φ = tan−1 TY TZ (3.1) Even though counter-intuitive, previous studies on cyclorotors at MAV-scales have shown that the measured sideward force (TY) could be a significant fraction of the vertical force (TZ), even as high as 55% [15]. Recent analytical studies showed that the reason for this is large flow curvature effects for cyclorotors with high chord/radius ratio and unbalanced drag forces in the upper and lower halves resulting in net sideward force [18]. A detailed explanation of the flow curvature effects was provided in section 3.2.1.
Moving to the UAV-scale, the current study found that the sideward forces persisted, but were highly dependent on the geometric parameters. This is shown in Figs. 3.2 and 3.3, where the variation of thrust components produced by a 2-bladed cyclorotor with a chord/radius ratio of 0.26 and a 6-blade cyclorotor with a chord/radius ratio of 0.66 with operating pitch amplitudes of±30◦ is plotted as a function of rotational rate. The points represent experimental measurements and the dotted lines represent quadratic curve fits. Examining the 2-bladed rotor (3.2),TY never exceeded 12% ofTZ representing a value of 6◦ forφ or a 1◦ deviation from the expected when considering the mechanical phase lag of 5◦ resulting from the four-bar pitching mechanism. Increasing the number of blades to four shows an increase in TY up to 80% of TZ (Fig. 3.3). This increase equates to an increase inφ up to 35◦ (after considering mechanical phase lag) or in other words, the resultant thrust vector (TRes) will be tilted at an angle of 35◦with the vertical.
0 100 200 300 400
Rotational Rate, RPM
0 5 10 15 20 25 30Thrust, N
T Z T Y T ResFigure 3.2: Thrust vs. RPM:2-bladed cyclorotor. c/R = 0.26, PA =±30◦
0 200 400 600 800
Rotational Rate, RPM
0 5 10 15 20 25 30Thrust, N
T Z T Y T ResFigure 3.3: Thrust vs. RPM: 6-bladed cyclorotor. c/R = 0.66, PA =±30◦
Adjusting the phasing of the pitch kinematics ensures the resultant thrust is directed in the desired direction thus the remainder of the study presents thrust as the resultant thrust (Eq. 3.2) unless stated.
TRes = q
T2
Y +TZ2 (3.2)
Referring to Figures 3.2 and 3.3, we see that, as expected, according to momentum theory, thrust increases as the square of rotational speed.
3.1.2 Power Analysis
The total aerodynamic power of a cyclorotor is a combination of the induced and profile power of the blades, blade pitching power, and the parasitic losses associated with rotating support structure. Power was obtained as the product of measured torque and rotational speed (Eq. 3.3). Tare tests with no blades mounted to the rotor were conducted at various rotational speeds to measure the parasitic power associated with the support structure. The tare power measurements were subtracted from the total aerodynamic power to obtain the power required to rotate only the blades. Tare losses accounted for less than 5-10% of the total aerodynamic power.
P =QΩ (3.3)
The aerodynamic power measurements for the same 2- and 6-bladed cyclorotors from the previous section are provided in Figs. 3.4 and 3.5, respectively. Again, as expected according to momentum theory, power increases as the cube of rotational speed.
0 100 200 300 400
Rotational Rate, RPM
0 100 200 300 400Power, W
Total Power Aerodynamic Power Parasitic PowerFigure 3.4: Power vs. RPM: 2-bladed cyclorotor. c/R = 0.26, PA =±30◦
0 200 400 600 800
Rotational Rate, RPM
0 100 200 300 400Power, W
Total Power Aerodynamic Power Parasitic PowerFigure 3.5: Power vs. RPM: 6-bladed cyclorotor. c/R = 0.66, PA =±30◦ 3.2 Rotor Parameters
3.2.1 Virtual Camber
The curvilinear flow experienced by the cyclorotor blades introduces a unique aerodynamic phenomenon referred to as virtual camber (Fig. 3.6). The virtual camber effect was originally
observed on vertical axis wind turbine blades where the blades undergo an orbital motion and therefore operates in a similar curvilinear flow. The effect is introduced now due to its significant effect on aerodynamic performance of a cyclorotor. Blades subjected to curvilinear flow behave very differently compared to one immersed in a rectilinear flow. In a curvilinear flow, the local velocity and angle of attack of the blade are unique at different locations along the chord. Because of this, a symmetric blade in curvilinear flow can be viewed to behave like a cambered blade in rectilinear flow (Fig. 3.6a).
The flow curvature effects are clearly explained in Fig. 3.6b, which shows a symmetric airfoil at a 0◦ pitch angle. Point A is the pitching axis of the blade. For the sake of explanation, resultant velocity at any location on the blade chord was assumed a function of the rotational speed only (ignoring induced velocity and pitch rate effects). Thus, the magnitude and direction of the resultant velocity varies along the chord. The angle of attack of the flow at any location on the chord, x, is given by ax = tanx
R−1 and the velocity magnitude is given byΩR where R0 =√R2+x2. The flow curvature effects become more pronounced as the chord-by-radius ratio and pitch amplitude increase thus, the virtual camber effect is directly dependent on the cyclorotor configuration and plays a significant role in the thrust generation and aerodynamic performance
(a) Curvilinear flow (b) Schematic
3.2.2 Effect of Blade Cyclic Pitching Amplitude
The cyclic blade pitching amplitude for a cyclorotor is analogous to collective pitch for a conventional rotor and it plays a significant role in the performance of the cyclorotor because the amplitude directly impacts the resultant thrust produced and aerodynamic efficiency. Operating at the optimum cyclic pitching amplitude is important to maximize the cyclorotor0s thrust and power loading. Previous studies at the MAV scale have shown that operating at high cyclic pitching amplitudes (>±40◦) improves the performance of the cyclorotor [31]. The reason for the improved performance at high cyclic pitch amplitudes finds its roots in the unsteady aerodynamics due to the pitch-rate and flow curvature.
Figures 3.7 and 3.8 present power loading vs disk loading for a 2- and 4-bladed cyclorotor featuring a 5.5 in chord, 22 in span, and 8.25 in radius with symmetric pitch kinematics between ±15◦ and±40◦. Symmetric pitch kinematics means the blades attain the same cyclic pitch angle at diametrically opposite locations of its circular trajectory. Examining the results for the 2-bladed cyclorotor in Fig. 3.7 one can see the effect of cyclic blade pitching amplitude on power loading. The power loading for all disk loadings steadily increases from the±15◦ pitch amplitude case all the way to the±35◦case after which point it begins to decrease. The drop-in power loading for the ±40◦case is small and is likely due to the onset of dynamic stall and shows that, when considering aerodynamic efficiency, ±35◦ is the optimal symmetric cyclic pitch amplitude for the current 2-bladed cyclorotor. Experimental results for the 4-2-bladed cyclorotor shown in Fig. 3.8 demonstrate trends comparable to the 2-bladed one. The power loading for each disk loading steadily increases from the±15◦pitch amplitude case up to the±40◦pitch amplitude. The increase in optimal cyclic pitch amplitude from the 2- to 4-bladed case is attributed to the change in inflow which reduces the effective angle of attack.
0 20 40 60 80 100
Disk Loading, N/m
2 0 0.05 0.1 0.15 0.2 0.25Power Loading, N/W
20 Deg 25 Deg 30 Deg 35 Deg 40 DegFigure 3.7:P Lvs. DL: 2-bladed cyclorotor. c/R = 0.66, varying symmetric pitch amplitudes
0 20 40 60 80 100
Disk Loading, N/m
2 0 0.05 0.1 0.15 0.2 0.25Power Loading, N/W
20 Deg 25 Deg 30 Deg 35 Deg 40 DegFigure 3.8:P Lvs. DL: 4-bladed cyclorotor. c/R = 0.66, varying symmetric pitch amplitudes Previous MAV-scale studies showed a measurable improvement in aerodynamic efficiency for asymmetric pitching kinematics [13]. The improvement was found when the pitch amplitude was higher at the top (ψ = 90◦) than the bottom (ψ = 270◦) of the trajectory and was attributed to the inflow and flow curvature effects, which reduce the lift produced along the top of the trajectory
and increases it along the bottom. To understand the effect of asymmetric pitching on a UAV-scale cyclorotors aerodynamic efficiency, Figs. 3.9 and 3.10 present power loading vs disk loading for the 2- and 4-bladed cyclorotors with five different pitch kinematics featuring an overall 70◦ peak-to-peak amplitude. Unlike the MAV-scale studies, a negligible or even detrimental effect was found for pitch kinematics featuring 5◦or 10◦ of asymmetry in the pitch amplitude for both 2-bladed and 4-bladed rotors regardless of the location of the higher pitch amplitude.
0 20 40 60 80
Disk Loading, N/m
2 0 0.05 0.1 0.15 0.2 0.25Power Loading, N/W
25°T 45°B 30°T 40°B 35°T 35°B 40°T 30°B 45°T 25°B0 20 40 60 80
Disk Loading, N/m
2 0 0.05 0.1 0.15 0.2 0.25Power Loading, N/W
25°T 45°B 30°T 40°B 35°T 35°B 40°T 30°B 45°T 25°BFigure 3.10: PL vs. DL: 4-bladed cyclorotor. c/R = 0.66, varying asymmetric pitch amplitudes The complex nature of the unsteady aerodynamics and flow curvature effects in a cyclorotor means the optimal pitch kinematics will shift with changing rotor geometry. Figure 3.11 presents the optimal pitch amplitude vs. chord-by-radius ratios for a 2-bladed UAV-scale cyclorotor (sym-metric pitching). The optimal pitch amplitude is determined based on the maximum power loading for a fixed disk loading of 60 N/m2. The increase in optimal pitch amplitude with increasing chord-by-radius ratio is attributed to the significant change in flow curvature effects. As discussed in section 3.2.1 an increase in chord-by-radius ratio results in an increased velocity gradient across the blade chord resulting in an increased virtual camber.
0.2 0.4 0.6 0.8 1
c/R
20 25 30 35 40 45Optimal Pitch Amplitude, Deg
Figure 3.11: Optimal Pitch Amplitude vs. Chord-by-Radius Ratio: 2-bladed cyclorotor Figure 3.12 presents the optimal pitch amplitude vs number of blades for fixed chord-by-radius ratios of 0.26, 0.50, and 0.66. The change in optimal pitch amplitude with increasing number of blades was less significant but is attributed to the changing inflow which leads to a reduction in the effective angle of attack. To capture the optimal pitch amplitude for each configuration the remainder of the paper presents results for symmetric pitching kinematics with a maximum cyclic pitch amplitude between±15◦and±40◦.
2 3 4 5 6
Number of Blades
20 25 30 35 40 45Optimal Pitch Amplitude, Deg
0.26 0.50 0.66 Chord-by-Radius Ratio
Figure 3.12: Optimal Pitch Amplitude vs. Number of Blades: varying chord-by-radius ratio 3.2.3 Effect of Blade Airfoil Thickness
The pitching kinematics for a cyclorotor result in a geometry such that the top surface of the blade relative to the incoming flow becomes the bottom surface during the opposite half of the cycle (Fig. 1.1b). Inherent from this fact is that the ideal airfoil likely has a symmetric geometry, as was found during MAV-scale studies [13]. A cambered geometry would operate with one half of the cycle experiencing a positive camber while the other would operate in negative camber. The results presented in this paper are focused on determining the ideal airfoil thickness from tests on blades with symmetric 4-series NACA airfoils with 15%, 20% and 25% thickness-to-chord ratios, namely NACA0015, NACA0020 and NACA0025 airfoils. The other parameters fixed for these tests included a 5.5 in chord, 21 in radius (c/R=0.26), and 22 in span.
Figure 3.13 shows the variation of thrust coefficient, CT, with pitch amplitude (calculated at a blade speed of 20 m/s (∼400 RPM) or a Reynolds number of ∼200,000. As expected, the results for varying airfoils is subtle but the results provided are quite interesting. Looking at the values of the coefficient of thrust we see that the thrust is higher for the thinnest airfoil for most of the operating pitch amplitudes. At the higher pitch amplitudes (±35◦) the thrust begins to
thicker airfoils (NACA0020 and NACA0025) exhibit a delay in the onset of this nonlinear behavior resulting in higher thrust production for the thicker airfoils at higher pitch amplitudes.
0 10 20 30 40 50
Pitch Amplitude, Deg
0 0.05 0.1 0.15Coefficient of Thrust, C
T NACA 0015 NACA 0020 NACA 0025 AirfoilFigure 3.13:CT vs. Pitch Amplitude: varying airfoil thickness
Figure 3.14 shows the variation of power coefficient, CP, with pitch amplitude for the dif-ferent airfoils tested. For all pitch amplitudes, the thinner airfoils exhibit increased aerodynamic power, which is counter intuitive when considering conventional propeller aerodynamics where thinner airfoils tend to exhibit reduced drag and thus reduce power requirements. The deviation is attributed to the higher stall angle of thicker airfoils and performance change associated with the virtual camber effect.
0 10 20 30 40 50
Pitch Amplitude, Deg
0 0.02 0.04 0.06 0.08 0.1
Coefficient of Power, C
P NACA 0015 NACA 0020 NACA 0025 AirfoilFigure 3.14: CP vs. Pitch Amplitude: varying airfoil thickness
Combining the effects on thrust and aerodynamic power due to airfoil thickness, Fig. 3.15 shows the power loading for a fixed disk loading of 60N/m2. Two interesting trends arise while examining the plots. First, note the peak power loading values are near identical (PL≈ .165 WN) for all airfoils and it occurs at either a±20◦ or ±25◦ pitch amplitude. Second, note the shape of the PL vs pitch amplitude plot is different from one airfoil to another. With the thinnest airfoil (NACA 0015), a sharp peak could be seen centered about a 20◦ pitch amplitude. Moving to the thicker airfoils (NACA 0020 and NACA 0025) the peak shifts to 25◦ and a more rounded peak to the power loading curve exists, which provides an expanded operating regime in which the cyclorotor can produce thrust efficiently. Based on these results, a symmetric airfoil with a thickness of around 20 to 25 percent of the chord is recommended from an aerodynamic efficiency standpoint. Improved performance at higher thickness is also an encouraging result from blade structural design standpoint. The airfoil used for the remainder of the study was a NACA 0020.
0 10 20 30 40 50
Pitch Amplitude, Deg
0.04 0.06 0.08 0.1 0.12
Power Loading, N/W
NACA 0015 NACA 0020 NACA 0025 AirfoilFigure 3.15:P Lvs. DL: varying airfoil thickness 3.2.4 Effect of Blade Span (Blade Aspect Ratio)
2-bladed cyclorotors with three different blade spans (16.5 in., 22in., and 27.5 in.) were tested at the same chord (5.5 in.) and blade kinematics for two different radii (8.25 in. and 11 in.) to understand the effect of blade span on thrust generation and aerodynamic efficiency. The spans and chord were chosen to equate to aspect ratios of 3, 4 and 5 while the tested radii equated to chord-by-radius ratios of 0.50 and 0.66. The aspect ratios test were limited to a maximum of 5 to mitigate the effect of blade deflection on the results [15]. These chord-by-radius ratios were chosen due to their proximity to the optimal chord-by-radius ratio as is covered in the subsequent sections. The data points were calculated for a fixed blade speed of 20 m/s.
Figures 3.16 and 3.17 show the variation of cyclorotors thrust produced per unit span, presented asCT/σ, and power required per unit span, presented asCP/σ, of the cyclorotor with respect to aspect ratio. Figure 3.18 presents the power loading for a fixed disk loading (60 N/m2). The plots include data for the two chord-by-radius ratios tested and three separate pitching amplitudes (±20◦, ±30◦, ±40◦). The trends for all three figures show limited change with respect to aspect ratio. The result is significant because traditionally increasing the blade aspect ratio results in an increased aerodynamic efficiency due to reduction in tip losses.
3 3.5 4 4.5 5
Aspect Ratio
0.5 1 1.5 2C
T/
c/R=0.50, PA=20 Deg c/R=0.66, PA=20 Deg c/R=0.50, PA=30 Deg c/R=0.66, PA=30 Deg c/R=0.50, PA=40 Deg c/R=0.66, PA=40 DegFigure 3.16: CT/σvs. AR: varying chord-by-radius and pitch amplitude
3 3.5 4 4.5 5
Aspect Ratio
0 0.5 1 1.5 2C
P/
c/R=0.50, PA=20 Deg c/R=0.66, PA=20 Deg c/R=0.50, PA=30 Deg c/R=0.66, PA=30 Deg c/R=0.50, PA=40 Deg c/R=0.66, PA=40 Deg3 3.5 4 4.5 5
Aspect Ratio
0 0.05 0.1 0.15Power Loading, N/W
c/R=0.50, PA=20 Deg c/R=0.66, PA=20 Deg c/R=0.50, PA=30 Deg c/R=0.66, PA=30 Deg c/R=0.50, PA=40 Deg c/R=0.66, PA=40 DegFigure 3.18: P Lvs. ARfor fixed disk loading: varying chord-by-radius and pitch amplitude To investigate the magnitude of the tip losses an experiment was conducted using a 2-bladed cyclorotor with an aspect ratio of 4 to examine the relative change in thrust generation and aerody-namic efficiency for rotors with and without end plates. For the experiment a thin elliptical plate was attached to the end of each blade (Fig. 3.19). Figure 3.20 shows the power loading vs. disk loading for the optimal pitch amplitude for that configuration (25◦). The dotted lines represent a curve fit based on a quadratic fit for thrust and cubic fit for power with respect to rotational rate. The results demonstrate a small, but noticeable (∼2%) change in the power loading. The small change for This result provides confidence in the assertion above that thrust generation and aerodynamic efficiency exhibit minimal changes with regards to blade aspect ratio for the small aspect ratios typically associated with cyclorotors. Large aspect ratios (AR>5) could result in improvements in aerodynamic performance, but special consideration must be made with regards to the structural design of high aspect ratio blades.
Figure 3.19: 2-bladed cyclorotor with elliptical endplate 0 10 20 30 40
Disk Loading, N/m
2 0.1 0.15 0.2 0.25Power Loading, N/W
No End Plate With End Plate ConfigurationFigure 3.20:P Lvs. DL: 2-bladed cyclorotor with and without endplate 3.2.5 Effect of Chord-by-Radius Ratio
The chord-by-radius ratio was proven to be one of the driving design parameters for MAV-scale cyclorotors when it comes to establishing an optimal rotor geometry [13]. The importance of the parameter is derived from the implication of chord-by-radius ratio on flow curvature effects as
One immediate impact of the flow curvatures is the shift in relative magnitudes of the horizontal and vertical thrust generation. Figure 3.21 presents the angle of the resultant thrust vector from vertical,Φ(Fig. 2.1), versus the chord by radius ratio. Specifically, these tests were conducted on a cyclorotor with a 5.5 in chord and 22 in span at a fixed blade speed of 20 m/s for radii between 5.5 in. and 21 in. In Figs. 3.21 to 3.24 the chord-by-radius ratio is increased by decreasing the radius for a fixed chord. The relative change in magnitude is due in part to the virtual camber effect which results in asymmetry in lift and drag coefficients between the upper and lower halves of the circular blade trajectory [32, 33]. This is because, the blade experiences negative virtual camber in the upper half of the trajectory (ψ = 0◦-180◦) and positive virtual camber in the lower half (ψ = 180◦-360◦). The positive virtual camber at the 90◦ azimuthal location serves to minimize the lift in the upper half while the negative virtual camber at the 270◦ azimuthal location amplifies the effects of curvilinear geometry leading to significant lift in the lower half. The virtual camber can also create an asymmetry between the right (ψ = 270◦-90◦) and left halves (ψ = 90◦-270◦) of the circular trajectory, leading to the forces in Y-direction not getting cancelled out. The magnitude of the virtual camber depends on the chord-by-radius ratio and hence this parameter has a profound effect on blade forces and cyclorotor performance. A cyclorotor by design is capable vectoring its thrust around the azimuth (360◦), thus only the magnitude of the resultant thrust is considered going forward.
0.2 0.4 0.6 0.8 1
c/R
10 15 20 25 30 35 40, Deg
20 Deg 30 Deg 40 Deg Pitch AmplitudeFigure 3.21:Φvs. c/R: varying pitch amplitude
Figures 3.22 and 3.23 present thrust and power vs. chord-by-radius ratio for the same con-ditions defined above to examine the effect of chord-by-radius on thrust and aerodynamic power. From Fig. 3.22 it can be seen that for high pitch amplitudes that thrust is not constant for different radii at a fixed blade speed (ΩR) and chord. This is due to the change in flow curvature effects associated with the increased chord-by-radius ratio. For the case presented it was found that for high pitch amplitudes (40◦), where the flow curvature effects are the highest, increasing the chord by radius ratio up to 0.66 resulted in increased thrust generation (∼11%) using the exact same blade and blade speed. The decline in thrust generation per unit area for chord-by-radius ratios greater than 0.66 demonstrates the optimal chord-by-radius ratio in terms of thrust production lies between 0.5 and 0.66. The implication is decisive for the design of an optimal cyclorotor because by decreasing the radii you are effectively reducing rotor weight due to shorter support arms while at the same time increasing the thrust generated. The result is a cyclorotor with higher thrust generation and higher thrust to weight ratios. Looking at Fig. 3.23, it can be seen that the power increases with respect to chord-by-radius ratio for all pitch amplitudes. While still not fully understood, the change in thrust and power with changing chord-by-radius ratio are attributed to
around the azimuth. As shown, these effects are beneficial to an extent but become detrimental to thrust generation and performance at very high chord-by-radius ratios (c/R >0.66).
0.2 0.4 0.6 0.8 1
c/R
10 15 20 25 30 35 40Thrust, N
20 Deg 30 Deg 40 Deg Pitch AmplitudeFigure 3.22: Thrust vs. c/R: varying pitch amplitude
0.2 0.4 0.6 0.8 1
c/R
100 200 300 400 500Power, N
20 Deg 30 Deg 40 Deg Pitch AmplitudeFigure 3.23: Power vs.c/R: varying pitch amplitude
Increasing the chord by radius ratio represents one of two ways to increase the cyclorotor solidity. The solidity is also dependent on the number of blades (Nbc2πR). Despite the large
change in solidity during the current study, the trends found for the change in thrust and power with respect to chord-by-radius are independent of the variance in solidity due to the constant blade area (Nbbc) and fixed blade speed (ΩR). In other words, as shown in Eq. 3.4, CT/σ is proportional to total thrust (TRes) since the total blade area and blade speeds are constant.
CT/σ = TRes A(ΩR)2 .Nbc 2πR = πTRes ρ(ΩR)2N bbc (3.4) Figure 3.24 presents power loading versus chord-by-radius ratio for a fixed disk loading (60 N/m2) to examine the effect of chord-by-radius ratio on aerodynamic efficiency. Like trends found for thrust and power, the aerodynamic efficiency varies greatly for different pitch amplitudes. For a pitch amplitude of 20◦ the power loading remains relatively constant until high chord-by-radius ratios, whereas for higher pitch amplitudes (30◦ and 40◦) an optimal configuration becomes clear with the formation of a peak. In terms of aerodynamic efficiency, the optimal chord-by-radius ratio was found to be 0.66. Thus, combining considerations for the thrust generation and aerodynamic efficiency the recommend chord-by-radius ratio is around 0.66. It is significant to note while the relative change in cyclorotor performance with respect to chord-by-radius ratio was significantly different, the optimal chord-by-radius ratio was found to be similar even at an order of magnitude higher Reynolds number when compared to earlier MAV scale studies [13].
0.2 0.4 0.6 0.8 1
c/R
0.05 0.1 0.15Power Loading, N/W
20 Deg 30 Deg 40 Deg Pitch AmplitudeFigure 3.24:P Lvs. c/R: varying pitch amplitude 3.2.6 Effect of Number of Blades
As mentioned before, increasing the number of blades serves is an alternative method to increase rotor solidity without changing the chord-by-radius ratio and flow curvature effects. To determine whether a change in number of blades has an effect independent of the change in solidity the relationship of CT/σ, CP/σ, and power loading with regards to the number of blades was investigated. The studies were conducted for a single chord (5.5 in.) for three different radii (21 in., 11in., and 8.25 in.) establishing three different chord-by-radius ratios (0.26, 0.50 and 0.66). The large variance creates significant difference in the flow curvature effects on the rotor performance allowing for its effects to be neglected.
Figure 3.25 presentsCT/σvs number of blades for the rotor configurations operating at a fixed blade speed (20 m/s) for three separate pitch amplitudes (20◦, 30◦, and 40◦). Examining the figure, one can observe thatCT/σmonotonically drops with increasing number of blades. In fact, for all nine of the configurations presented, the value ofCT/σfor a 6-bladed rotor is 40-60% of that found for the 2-bladed rotor. The underlying cause of this observation is two-fold. First, the increase in the number of blades results in a shift in the inflow reducing the effective angle of attack of the blade resulting in less lift. Second, as the number of blades increases the blade interactions increase
resulting in reduced thrust generation. 2 3 4 5 6
Number of Blades
0 0.5 1 1.5 2C
T/
c/R=0.26, PA=20° c/R=0.50, PA=20° c/R=0.66, PA=20° c/R=0.26, PA=30° c/R=0.50, PA=30° c/R=0.66, PA=30° c/R=0.26, PA=40° c/R=0.50, PA=40° c/R=0.66, PA=40°Figure 3.25: CT/σ vs. N b for fixed disk loading: varying chord-by-radius ratio and pitch amplitude
Transitioning to the effect of the number of blades on aerodynamic power, Fig. 3.26 shows CP/σ versus number of blades. Similar to Fig. 3.25,CP/σ decreases with increasing number of blades. Neither thrust nor power doubles when the number of blades is doubled.
2 3 4 5 6
Number of Blades
0 0.5 1 1.5C
P/
c/R=0.26, PA=20° c/R=0.50, PA=20° c/R=0.66, PA=20° c/R=0.26, PA=30° c/R=0.50, PA=30° c/R=0.66, PA=30° c/R=0.26, PA=40° c/R=0.50, PA=40° c/R=0.66, PA=40°Figure 3.26: CP/σ vs. N b for fixed disk loading: varying chord-by-radius ratio and pitch amplitude
To determine if a trend exists for aerodynamic efficiency with regards to number of blades, the power loading was plotted versus number of blades for a fixed disk loading of 60 N/m2 (Fig. 3.27). The trend was sporadic with regards to number of blades. The data points for the lower chord-by-radius ratio (c/R= 0.26) exhibited an increase in power loading for all number of blades. The larger chord-by-radius ratio (cR= 0.50 and 0.66) exhibited an overall decreasing trend with regards to power loading. To design an aerodynamically optimal cyclorotor, there must be a balance between the chord-by-radius ratio and number of blades. This balance is likely related to the blade interactions which would be closely associated with rotor solidity and is investigated in section 3.2.7.
2 3 4 5 6
Number of Blades
0.05 0.1 0.15 0.2Power Loading, N/W
c/R=0.26, PA=20° c/R=0.50, PA=20° c/R=0.66, PA=20° c/R=0.26, PA=30° c/R=0.50, PA=30° c/R=0.66, PA=30° c/R=0.26, PA=40° c/R=0.50, PA=40° c/R=0.66, PA=40°Figure 3.27: P Lvs. N bfor fixed disk loading: varying chord-by-radius ratio and pitch amplitude 3.2.7 Effect of Rotor Solidity
Two ways of increasing the solidity of a cyclorotor, essentially, increasing the chord-by-radius ratio or increasing the number of blades, were investigated in the sections 3.2.5 and 3.2.6. In-creasing the chord-by-radius ratio was shown to result in an increase inCT/σ and power loading for chord-by-radius ratios up to 0.66. Increasing the number of blades was shown to result in a decrease of CT/σ while having varied effect on the aerodynamic efficiency depending on the rotor configuration. Between the two studies it has become evident that determining the optimal configuration in terms of aerodynamic efficiency requires a balance between the chord-by-radius and number of blades.
Figure 3.28 presents CT/σ vs. solidity for rotors operating at a ±40◦ pitch amplitude with varying rotor solidity based on the two different methods. Based on the trends it becomes clear that to improve thrust per unit area a designer should choose the optimal chord-by-radius because increasing the number blades results in steep penalties in terms of thrust per unit area. However, increasing the chord-by-radius ratio can result in double the thrust for double the blade area.
0 0.1 0.2 0.3 0.4 0.5 0.6
Solidity
0 0.5 1 1.5C
T/
Increasing c/R (Nb=2)Increasing Number of Blades (c/R=0.26) Increasing Number of Blades (c/R=0.50) Increasing Number of Blades (c/R=0.66)
Configuration Change
Figure 3.28:CT/σvs. σ: varying rotor configuration
This possibility was further investigated by conducting experiments with blades of three differ-ent chord lengths (c=5.5 in, 8 in, and 10 in.) at a fixed radius (R = 13.33 in.) equating to chord-by-radius ratios of 0.41, 0.60 and 0.75. Figure 3.29 presentsCT/σvs. solidity from those experiments. For pitch amplitudes of 20◦ and 30◦, the thrust per unit area remained roughly constant while for 40◦ a slight decrease was found. The results correlated well with the study on changing chord-by-radius ratio for a fixed chord discussed previously thus doubling the blade area by changing the chord length can result in double the thrust assuming the optimal chord-by-radius ratio (∼0.66) is not exceeded. The reduction in the total number of blades also reduces the total rotor weight due to a reduction in the number of support arms and pitch links required. Due to large centrifugal loads, the support arms tend to represent a significant percentage of the rotors weight.
0.1 0.15 0.2 0.25
Solidity
0.4 0.6 0.8 1 1.2 1.4C
T/
20 Deg 30 Deg 40 DegFigure 3.29:CT/σvs. σ: varying rotor configuration
Figure 3.30 presents power loading vs. solidity for all configurations tested as part of the number of blades and chord-by-radius ratio study for a ±40◦ pitch amplitude. Examining the figure, a trend begins to take shape as to the relation between figure of merit and solidity. The curve for increasing number of blades at a low chord by radius ratio (c/R=0.26) showed the power loading continued to increase for all values of solidity. The curve for increasing chord-by-radius ratio for a 2-bladed rotor showed a peak transition point equating to the determined optimal chord-by-radius ratio (c/R=0.66,σ=0.24). The final curve started with the optimal chord-by-radius ratio and presented the effect of increasing number of blades. For this curve, the power loading remained roughly constant until a solidity of∼0.35, after which it began to decrease. At higher solidities, it is likely, as discussed earlier, that blade interactions begin to become detrimental to the aerodynamic performance. The optimal rotor solidity was found to fall between 0.30 and 0.40.
0 0.1 0.2 0.3 0.4 0.5 0.6
Solidity
0 0.05 0.1 0.15Power Loading, N/W
Increasing c/R (Nb=2)Increasing Number of Blades (c/R=0.26) Increasing Number of Blades (c/R=0.50) Increasing Number of Blades (c/R=0.66)
Configuration Change
Figure 3.30:P Lvs. σ: varying rotor configuration 3.3 Optimal Geometry
As a final check to determine if there was a rotor configuration tested to date that demonstrated a higher aerodynamic efficiency, the peak figure of merit obtained for all 37 rotor configuration (regardless of pitch amplitude) was plotted versus rotor solidity in Fig. 3.31. Figure of merit (TRes3/2/P√2ρA) represents the ratio of ideal aerodynamic power to measured aerodynamic power. Examining the figure, the peak figure of merit was found to be 0.6. The respective rotor configura-tion was a 3-bladed cyclorotor with a 5.5in chord, 22in. span, and 8.25 in radius. In general terms, the recommended rotor configuration for an aerodynamically optimized UAV-scale cyclorotor is a 3-bladed rotor with a chord-by-radius ratio of 0.66, a blade aspect ratio (span/chord) of 4, a NACA 0020 airfoil, a rotor aspect ratio (span/diameter) of 1.33 and operating pitch amplitude of±40◦. A picture of the optimal cyclorotor is provided in Fig. 3.32.
0 0.1 0.2 0.3 0.4 0.5 0.6
Solidity
0.4 0.45 0.5 0.55 0.6 0.65Figure of Merit
Figure 3.31:P Lvs. σ: optimal pitch kinematics for every rotor configuration
Figure 3.32: Optimal cyclorotor configuration 3.4 Concluding Remarks
This present chapter discussed a detailed experimental study to understand the effect of blade kinematics and rotor geometry on the aerodynamic performance of a UAV-scale cyclorotor in
balance to measure time-averaged forces, torque and rotational speed of a UAV-scale cyclorotor prototype. Closely examining the thrust, power, and power loading measurements at different pitch amplitudes (symmetric and asymmetric), blade airfoil thicknesses, blade spans, chord-by-radius ratios, blades numbers, and solidities provides guidance on the design of an optimized cyclorotor.
4. TECHNOLOGY DEMONSTRATOR PROTOTYPE
In order to demonstrate the utility and function of a UAV-scale cyclorotor a 17 lb technology demonstrator prototype was developed with a novel dual-cyclorotor configuration [34]. Prior dual-cyclorotor configurations have featured a side-by-side arrangement of cyclorotors with a conventional tail rotor to counteract the primary cyclorotors’ torque and produce excess lift. The cyclocopter developed as part of the current study features two cyclorotors with one positioned at the front and one at the rear of the vehicle. In order to achieve stable hovering flight, the vehicles cyclorotors feature a novel split-blade design. The current chapter discusses the design and development of the vehicle, the formulation and implementation of the control strategy for hover, and the flight testing results.
4.1 Vehicle Design
The current vehicle is designed to demonstrate and take full advantage of a cyclorotors thrust vectoring and high-speed flight capability. The concept features two cyclorotors on the front and rear of the vehicles fuselage (Fig. 4.1a). To maintain VTOL capabilities, the cyclorotors must be capable of producing differential forces capable of providing roll and yaw control authority. To generate these forces the cyclorotors feature a novel split-blade design, where the blade is split at mid-span location into left and right halves as shown in Fig. 4.1b. The split-blade design allows independent pitch amplitude and phase control for each half enabling different thrust magnitude and direction for the left and right sides of a single cyclorotor for roll and yaw control. Pitch control could be achieved by a differential pitch amplitude or rotational speed between front and rear rotors.
(a) Rendering (b) Split blade design Figure 4.1: Cyclocopter concept
The cyclocopter developed for the current study is shown in Fig. 4.2. The vehicle measures approximately 2 feet in width, 5 feet in length, and 2.5 feet in height. The gross weight of the vehicle with batteries is 17 lb. The fuselage of the vehicle was created using a system of 1/2” composite tubes and 3D printed joints to create a lightweight and stiff frame for the cyclorotors. A central composite plate provides a mounting place for the vehicles electronics and potential payloads. The cyclorotors have an 18-inch diameter, 18 in span, and 6 in blade chord. The rotors are independently driven by a 105 kV out-runner KDE motor via a single stage timing belt transmission. The nominal operating rotor rotational speed is 850 RPM.
![Figure 1.6: Power vs. Forward Speed: trimmed flight of MAV-scale cyclorotor [19]](https://thumb-us.123doks.com/thumbv2/123dok_us/1882012.2774731/20.918.264.653.111.426/figure-power-forward-speed-trimmed-flight-scale-cyclorotor.webp)