Localized microstructure enhancement
via Friction Stir Processing
for die cast components
N. Sun, D. Apelian
Friction stir processing (FSP) is an outgrowth of Friction stir welding (FSW) that locally manipulates
the microstructure by imparting a high level of energy in the solid state resulting in improved mechanical
properties. This study has shown that FSP can be implemented as a post-casting method to locally eliminate
casting defects, such as porosity, which is generated by gas evolution during casting. Coarse second phases are
broken into fine nearly equiaxed particles and uniformly distributed in the matrix. Moreover, grain refinement
is obtained by dynamic recrystallization during FSP. This results in improved microhardness, tensile properties
and fatigue properties of the cast FSP processed A206 alloy. In addition, FSP is a viable means to produce
localized composite structures in cast Al components. Such improvements have important implications
for manufactured components for a variety of automotive and other industrial applications. The convenience
of FSP as a post-processing step that can easily be adapted during machining operation makes it very
attractive to adopt. These results will be reviewed and discussed.
INTRODUCTION
Complexities of casting, which involve heat, fluid and mass tran-sport processes, give rise to heterogeneities of the microstructure, formation of porosity, and defects. These flaws deteriorate materials properties and limit casting applications. In a sense, it can be con-sidered that high-quality castings are made not only by control-ling the microstructure, but also more importantly through con-trol (or management) of defects. In this vein, a processing method, Friction Stir Processing (FSP), has been pursued to locally con-trol or affect the microstructure, and to reduce porosities and de-fects to improve cast properties. FSP was developed based on the principle of Friction Stir Welding (FSW) [1]. In FSP a high-spe-ed rotating tool (rod) with a flat shoulder and probe penetrates into and traverses across the work piece, while the head face of the tool shoulder fully contacts the work piece. Frictional heat (bet-ween the tool and the work piece) can be high enough to produ-ce plastic deformation of the matrix around the moving tool; this alters and refines the local microstructure, reduces porosity and defects, which results in local property improvement.
FSP has emerged as an important post-processing technique and has drawn much attention. It was first used in highly alloyed wrought Al alloys such as the 2XXX and 7XXX series for aero-space applications; superplasticity, high strength, and fracture resistance of the alloy were attained via FSP [2-4]. A unique cha-racteristic of FSP is the resultant ultrafine grain structure and simultaneous improvements in the strength and ductility of the processed alloy [5]. This phenomenon is contrary to the Hall-Patch Law, wherein fine grains result in grain boundary strengthening [6] at the expense of ductility [7]. This implies that FSP has a
dif-ferent strengthening mechanism. Several factors can account for the property improvements we see in the FSPed region, such as grain size and grain morphology, distribution and density of di-slocations, and grain boundary morphology. Friction stir processed microstructures have the following features [8]: (i) equiaxed, fine grains – even ultra-fine grains (nano-sized scale) [9-11], (ii) very fine second phases and (iii) large fraction of high-angle grain boun-daries. These microstructural features enable superplastic de-formation at high strain rates and/or low temperatures [12-14] as well as improved room-temperature formability [15]. Another attractive feature of FSP is that it can be incorporated in the overall manufacturing cycle as a post-processing step du-ring the machining operation to achieve a localized composite structure in the cast component. Secondly, porosity that is ge-nerated by gas evolution, as well as undesirable interfacial re-actions between the reinforcement phase and the matrix are mitigated via FSP[16]. Third, FSP can be used as a tool for the re-pair of localized defects.
In this study FSP was performed on cast A206 aluminum alloy. A206 is an important and widely used Al casting alloy because of its high strength and good machinability. FSP parameters were optimized for this alloy to locally manipulate the cast mi-crostructure - porosity alleviation, grain refinement, and second phase homogenization. This study also evaluated the resultant mechanical properties, both static and dynamic. For composite fabrication via FSP, the reinforcements were emplaced in the pre-machined cavity in the Al A206 work piece. Three reinfor-cement materials and several key processing parameters were investigated. The motive behind this study was to confirm and demonstrate FSP as an enabling technology for post-processing of cast A206 components. By doing so, the cast structure can be locally manipulated to attain wrought material attributes; this opens up the design space of cast Al alloys towards that for wrought Al alloys.
N. Sun, D. Apelian
Advanced Casting Research Center Metal Processing Institute WPI, Worcester, MA 01609 USA
Keywords:
FSP, Microstructural Manipulation, Microhardness,
Tensile Properties, Fatigue properties, Composite Fabrication
DESIGN OF EXPERIMENTS
The main platform for FSP was a HAAS CNC milling machine. A specifically designed FSP tool head made from H13 tool steel was used. The diameter of the tool shoulder is 16 mm, and at the end of the shoulder a tapered probe whose length is 3.2 mm is manufactured. A tilt angle (angle between machine spindle and work piece normal) of three degrees is used to induce the forging action at the trailing edge of the shoulder. This is achieved by in-serting a back plate whose surface is machined into a slant sur-face. Proper tool penetration depth is very important in generating enough friction heat between the tool and the work piece and producing good FSP finish on the work piece. The mi-nimum tool penetration depth requires the shoulder of the tool to have enough contact with the work piece, and this number is calculated based on the real contact condition between the tool and the material. The local temperature of the work piece was measured by K-type thermocouples and the data was recorded by the FLIR S40 system. Four equi-distant holes were drilled along the FSP traverse direction to accommodate four thermo-couples, and the distance between each thermocouple was 2.54 cm. These thermocouples were inserted into the work piece at 2 mm below the top surface, and the tip of each thermocouple was near the centerline of the FSP nugget.
Eck Industries provided 6.25mm thick commercial A206 plates. The composition of the alloy is shown in Table 1. Dimensions of the work piece are 150 mm X 75 mm X 6.25 mm. FSP was di-rectly applied on the casting surface, and the processing para-meters were as follows: tool rotation speed –1000 RPM, tool traverse speed – 50.8 mm/min.
Samples for metallographic analysis were sectioned perpendi-cular to the FSP traverse direction and prepared for the micro-structure analysis following the routine procedure. Barker’s etchant and the polarized light were used to clearly reveal the grain size and morphology. Thin films for the TEM analysis was prepared via the focus ion beam (FIB) technique at particular lo-cations in the processed region. TEM work was carried out with a JOEL 2000 microscope operated at 200 kV. Specimen prepa-ration for the EBSD analysis was carefully performed in order to properly image the structure and obtain high-quality diffrac-tion patterns. A Carl Zeiss SUPRA-55 SEM equipped with the EBSD detector was used for EBSD data acquisition. The step size chosen for the FSPed specimen was 0.5µm, and for the as-cast specimen was 5µm.
The Knoop hardness (HK) test was conducted using the Buehler OmniMet MHT automatic microhardness test system with a load of 500 gf. As shown in Fig. 1, the test specimens were sectioned perpendicular to the FSP traverse direction to reveal the sverse cross-section. Measurements were taken on the tran-sverse cross-section along two lines. The first line is ~ 300µm below the top surface of the FSP region, and the second line is the middle line of the FSP region. They are named as location 1 (L1) and location 2 (L2) respectively in the results and discus-sion section.
The tensile test specimen was taken from the FSP nugget (the homogenous microstructure region) along the FSP traversing centerline as shown in Fig. 2. The specimen had a 25 mm gauge length with a cross section of 12.5 x 6.3 mm. It is a standard specimen in accordance to ASTM B8. The test was conducted in the Instron machine 5500 at room temperature. The ramp rate
Si
Fe
Cu
Mn
Mg
Zn
Ti
Ni
0.077
0.046
4.33
0.343
0.256
0.019
0.243
<0.002
TABLE 1
Composition of the Commercial A206 Alloy.
Composizione della lega commerciale A206.
FIG. 1 A macrograph of the FSPed region showing two locations where the microhardness data were collected.
Micrografia della regione trattata con FSP che mostra le due linee lungo le quali sono stati raccolti i dati di microdurrezza.
a
b
FIG. 2 Specimen for the tensile test: (a) schematic diagram of the tensile bar; (b) image of the tensile bar.
Provini utilizzati per le prove di trazione: (a) disegno schematico del provino; (b) immagine e dimensioni del provino.
was set at 1 mm/min (strain rate of 4%) and the strain was mea-sured using an extensometer of 25 mm gauge length.
The ultrasonic fatigue tests were conducted at room tempera-ture in the ambient air over a range of stresses using fully re-versed load (R= -1). The specimen had cylindrical gauge sections, and it was turned from a rectangular bar; dimensions
of the bar were 15 (L) x 1.4 (W) x 1.4 (H) cm. For the FSPed spe-cimen, the gauge section was manufactured from the FSP nug-get to ensure the homogeneity of the microstructure in this region. To ensure a consistent surface finish with low residual stress, samples were polished along the longitudinal direction to reach a Ra 8 value; these were done at Westmoreland Materials Testing in Youngstown, PA, USA.
The following three reinforcement materials to fabricate the composite layers were used: (i) 20 nm Ta powders; (ii) 100 nm SiC powders; and (iii) discontinuously reinforced aluminium (DRA). The reinforcements were emplaced into a slot that was manufactured in the surface of the work piece. The dimensions of the cavity were 50 (L) X 2 (W) X 4 (T) mm. Prior to FSP, the top of the slot was covered and sealed by the pre-friction-stirring action using a probe of only one millimetre in length to ensure the reinforcements (powders) were well encapsulated. The centerline of the slot was 1 mm offset from the centerline of the tool-traversing route to make sure that the advancing side of the tool fully contacted the reinforced materials. FSP was car-ried out at a tool rotating speed 1000 RPM and traversing speed 50 mm/min. Effects of multi-pass-FSP (up to two passes) and the amount of the reinforcement material were investigated.
Sam-(1) FIG. 3
Casting defect analysis: (a) the distribution of porosity inside a large area of the as-cast A206; (b) a plot showing the frequency distribution of the porosities equivalent circular diameters.
Analisi dei difetti di colata: (a) distribuzione della porosità entro un’ampia area della lega A206 as-cast; (b) grafico della frequenza dei valori dei diametri equivalenti delle porosità.
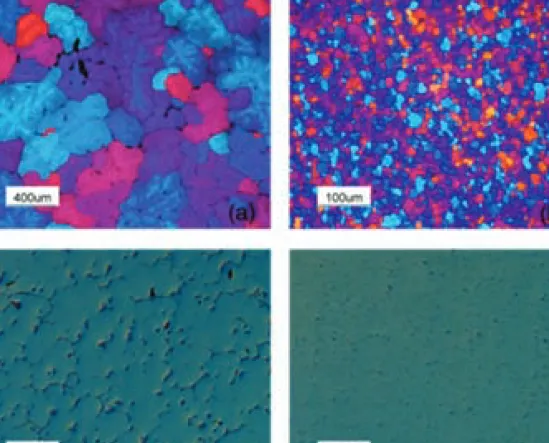
FIG. 4
Micrographs of as-cast A206 and FSP A206 (a) grain morphology of as-cast A206; (b) grain morphology of FSP A206; (c) second phase distribution of as-cast A206; (d) second phase distribution of FSP A206.
Micrografie della lega A206 as-cast e dopo esecuzione del processo FSP (a) morfologia dei grani del materiale A206 as-cast; (b) morfologia dei grani del materiale A206 sottoposto a FSP; (c) distribuzione della fase secondaria nel materiale A206 as-cast; (d) distribuzione della fase secondaria nel materiale A206 sottoposto a FSP.
ples were sectioned perpendicular to the FSP traverse direction; SEM and EDS were applied to reveal distributions of the rein-forcement materials.
RESULTS AND DISCUSSIONS Microstructure Evolution
Fig. 3a is a composite image showing the morphology and di-stribution of microshrinkage porosities inside the as-cast A206 specimen. To quantitatively analyze the 2-D porosity population distribution, a large area (7 mm x 5 mm) metallographic cross-section was examined to ensure a sufficient number of pores were in the analysis space. Sizes and distributions of all porosi-ties were statistically analyzed with an image processing soft-ware - "Image J". The size of the porosity was characterized with the equivalent circular diameter (ECD), which is defined as
where A is the 2-D projected area of the porosity.
For the as-cast A206, the average porosity ECD was 37µm, and the total area fraction of the microshrinkage porosity was 0.65%. Fig. 3b is the ECD frequency distribution histogram. More than
80% of ECDs were between 20µm and 50µm. After FSP, more than 97% of the pores were closed due to plastic deformation of the material under the high downward force and shear forces. This indicates that FSP is a viable method to significantly re-duce porosity in the cast component.
Fig. 4 shows optical micrographs of A206 pre-and post-FSP. Grain boundaries and grain size are clearly depicted in Fig. 4a and Fig. 4b. Dendritic structures and large grains more than 400µm in diameter are observed in the as-cast A206 micro-structure. However, after FSP, equiaxed and fine grains in the size of less than 10µm were observed, almost a reduction of one magnitude order. In addition, there was second phase compound refinement. The microstructure of the as-cast A206 contained second phases that were mainly coarse needle-like CuAl2-CuAl compounds (Fig. 4c). In contrast, in the FSP region fine second phase particles uniformly distributed were observed (Fig. 4d). These small particles were CuAl2-CuAl compounds broken by the stirring action of the probe, and the aspect ratio of the refi-ned particle was near one.
Grain boundary characteristics were analyzed via EBSD. Fig. 5a FIG. 5
Image quality maps overlaid with low angle and high angle boundaries and misorientation angle distribution histogram plots of the as-cast A206 (a) (b) and FSPed A206 (c) (d).
“Image quality map” con individuazione dei bordi di grano a basso e alto angolo e istogrammi della distribuzione del disorientamento degli angoli nella lega A206 as-cast (a) (b) e nella lega A206 sottoposta a FSP (c) (d).
FIG. 6
TEM micrographs showing (a) grain morphology showing clear boundaries; (b) dislocations inside a grain.
Micrografie TEM che mostrano (a) la morfologia dei bordi di grano; (b) dislocazioni all’interno di un grano.
and Fig. 5c are image quality (IQ) maps taken from the as-cast A206 and FSPed A206 samples. The IQ map is overlaid with grain boundary angles. The “high angle” boundaries are defi-ned as boundaries with misorientations exceeding 15 degrees, whereas the “low angle” boundaries are defined as boundaries with misorientations between 1 degree and 15 degrees. High-angle grain boundaries are marked in blue color. When quanti-tatively analyzing the grain boundary characteristics, for instance, calculating the fraction of high-angle boundaries, the minimum boundary misorientation should be defined. In this case, the minimum boundary misorientation was set to 1. Fig. 5b and Fig. 5d are histograms showing the frequency distribution of grain boundary misorientation angles in the as-cast and FSPed specimen. The fraction of high angle grain boundaries in-creased from 26.6 % to 76.7% after FSP.
FSP introduces a large amount of dislocations in the work piece. The rearrangement or elimination of these dislocations reduces the internal energy of the system; this is the thermodynamic dri-ving force for dynamic recovery. During dynamic recovery, sub-grains or cell structures are formed by dislocation rearrangement
and accumulation, and these substructures can only be revealed under TEM because they do not have typical grain boundaries that can be clearly demarked with optical microscopy. Moreover, because there is no migration of high angle boundaries, most subgrains are formed with low angle boundaries. Contrary to dy-namic recovery, there is large scale high-angle grain boundary migration during dynamic recrystallization, and if grain refine-ment is caused via dynamic recrystallization, boundaries of the refined grains can be clearly delineated by both optical micro-scopy and TEM. This study found that the grain refinement via FSP was mainly due to dynamic recrystallization, as we have ob-served clear grain boundaries (Fig. 4b and Fig. 6a) as well as a high fraction of high angle boundaries. However, as shown in Fig. 6b, some dislocation tangles and cell structures remain inside the refined grain, which indicates that dynamic recovery did take place during FSP. Due to the high stacking fault energy of the alu-minum, dislocations can interact with each other easily during the recovery stage, which led to dislocations annihilation. Espe-cially for low-angle grain boundaries, they are sinks of disloca-tions and they can promote the recovery and reduce the dislo-cation density [17]. FSP produced a large fraction of high-angle boundaries and the remained dislocation density was higher in the FSPed work piece compared with in the as-cast work piece.
Mechanical Properties Enhancement
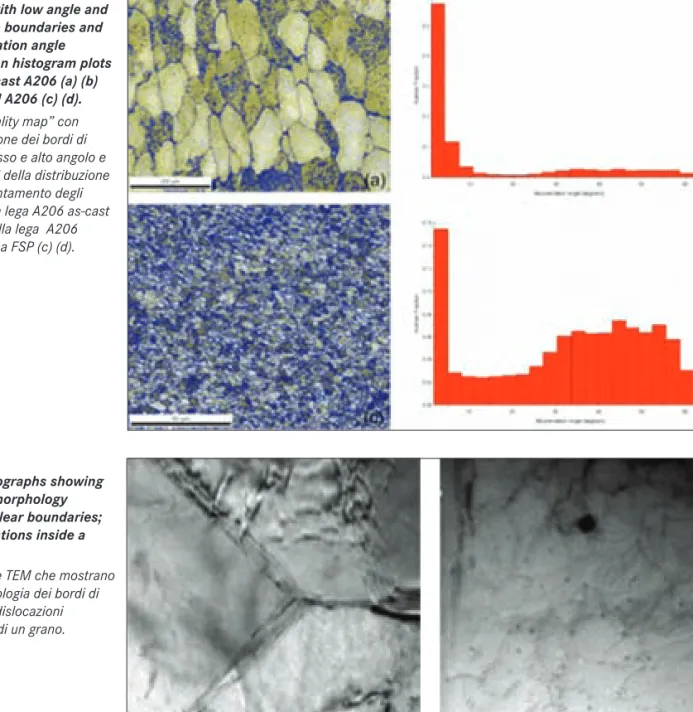
Fig. 7 shows the average Knoop hardness (HK) profiles for the as-cast and FSPed A206 specimens. The average microhardness of the as-cast A206 was 85 HK, and one can note the variation in values (see the error bar of the as-cast data in Fig. 7 b). The existence of casting defects, i.e. porosities and inclusions, dete-riorated the hardness of the material. The microhardness profi-les of the FSP processed specimen were selected from two locations in the FSP region, as described in the previous para-graph. The material between the surface of the work piece and location 1 had sufficient contact with the tool shoulder, and this region is referred to as the shoulder-affected zone. During FSP, the material in the shoulder-affected zone experienced a huge downward force as well as a shear force from the tool shoulder. The strain/strain rate in this region was higher than in other parts of the FSP region. As a result, the stirring action of the tool broke those coarse Al-Cu intermetallic compounds and produ-ced fine Al-Cu particles whose sizes were smaller in the shoul-der-affected zone than in other regions. These finer Al-Cu particles generated a stronger pinning effect to prevent the co-arsening of the recrystallized grains. From Fig. 7a one can see that the grain size at location 1 was smaller than that in the mid-dle of the FSP region. Location 2 was in the midmid-dle of the FSP nugget, and the material in this region represented the typical microstructure of the FSPed A206. Microhardness profiles in
a b
FIG. 7
Microhardness profile of the as-cast A206 and FSP A206: (a) grain size difference in the FSP region; (b) microhardness values.
the shoulder-affected zone (location 1) as well as in the middle of the FSP zone (location 2) were higher in values than the mi-crohardness profile in the parent material. Moreover, the mate-rial in the shoulder-affected zone became even harder. The improvement in microhardness is contributed to the following: (1) grain refinement – dynamic recrystallization occurred du-ring FSP, which resulted in an obvious grain size decrease (from ~300µm to 5µm at location one, and down to 10µm at location two); based on the Hall – Petch principle, material strengthe-ning can be achieved via grain refinement, and this was the rea-son that location one has a higher hardness value than location two; (2) casting defect alleviation – FSP eliminated almost all po-rosities; (3) second phases break-up during FSP; fine and ho-mogenously dispersed second phase particles result in a uniform hardness distribution in the FSP region.
Fig. 8 shows typical stress-strain curves of as-cast A206 and FSPed A206. The yield stress of the as-received A206 was 190 MPa; the UTS was 262 MPa, and the elongation was 5.6%. FSP resulted in a simultaneous increase in the strength and ductility. The elongation increased to 14.4%. Both the yield stress and the UTS increased after FSP: the yield stress increased from 190 MPa to 230 MPa, and the UTS increased from 262 MPa to 348 MPa. In this case, a numerical index that only depends on the metallurgical qualities of the alloys [18] was introduced to ex-press the quality of a casting. A higher index number stands for the better quality of a casting or the better tensile property of a
Profili di microdurezza del materiale A206 as-cast e del materiale A206 sottoposto a FSP: (a) differenza della dimensione dei grani nella regione sottoposta a FSP; (b) valori di microdurezza.
FIG. 8 Typical stress-strain curves for as-cast and FSP A206.
Curve sforzo-deformazione tipiche per il materiale A206 nello stato as-cast e in quello di sottoposto a FSP.
specimen. The quality index (QI) can be calculated based on the following equations [18]
QI = UTS + k x log E (2)
where UTS is the ultimate tensile strength in MPa; k is a con-stant whose value is 150 for the aluminum alloy; E is the elon-gation. Because the yield strength (YS) is less influenced by casting defects, we used the yield strength to calculate the QI instead of UTS. The YS is given by
YS = UTS – 60 x log E – 13 (3)
Accordingly, the quality index can be expressed as
QI = YS + 210 x log E + 13 (4)
The FSPed specimen showed better tensile properties with the QI increasing from 360 to 486. The enhanced yield stress was at-tributed to the dislocation pinning effect. FSP introduced a large number of dislocations in the work piece. Although the disloca-tion density was lowered by dislocadisloca-tion annihiladisloca-tion during the recovery stage, there were still many dislocations preserved wi-thin the refined grains or at grain boundaries. At grain boun-daries, the dislocations accumulated and interacted with one another, which served as pinning points or obstacles that signi-ficantly impeded their motion under loading as exhibited in the tensile test. Moreover, those fine and uniformly dispersed se-cond phase particles interacted with the tangled dislocations, which further prohibited dislocation movement and strengthe-ned the material during low strain deformation. This resulted in the observed higher yield strength. The increased UTS was due to porosity elimination as well as refinement of grains and se-cond phases. Ductility improved after FSP – the elongation was increased by more than 150%. The significant ductility enhan-cement is due to the higher work hardening rate of the FSPed A206 compared to the as-cast A206.
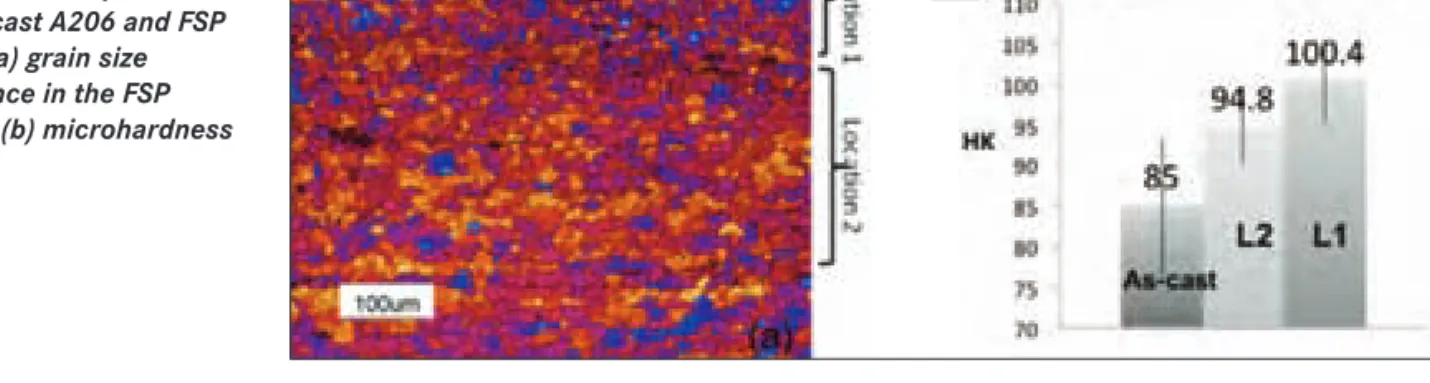
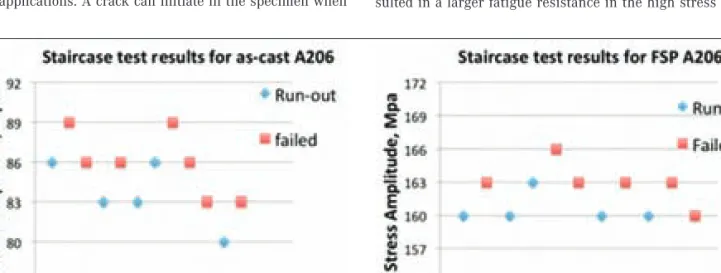
Commonly, when the cyclic load is run to 108or 109cycles (in the
ultrasonic fatigue mode), the S-N curve flattens out [19]. The value of the stress amplitude at 108or 109cycles is the fatigue
strength of the material and this number is important in indu-strial applications. A crack can initiate in the specimen when
the cyclic load is at or below this value; however, the crack can-not propagate to cause the final failure because the driving force for crack propagation is very low [19, 20]. So far, the value of the fatigue strength cannot be estimated accurately because of the existence of scatters on the S-N plot when the cyclic load is run to very high cycles. In this study, the staircase test methodology was used [21] to reduce the above issue and associated errors, and to correctly determine the fatigue strength of the A206 alu-minum alloy. The fatigue test was carried out in the ultrasonic fatigue test mode at a series of stress amplitudes within a pre-determined range.
Fig. 9 shows experimental staircase test results for the as-cast A206 and FSPed A206. Assuming the fatigue strength follows a normal distribution, the mean fatigue strength of the as-cast A206 at 108cycles and the population standard deviation were
estimated to be 85.5 Mpa and 1.56 Mpa, respectively. For the FSPed A206, these properties were 165 Mpa and 1.56 Mpa, re-spectively. It is noted that the fatigue strength of the FSPed A206 was almost two times higher than the as-cast A206. Moreover, the ratio of this fatigue strength to the yield strength was in-creased for the FSPed A206 compared with the as-cast A206. For the as-cast A206, the yield strength is 190 Mpa, and the fa-tigue strength endurance is 85 Mpa, which is ~45% of the Y.S; whereas for the FSPed A206, the yield strength is increased to 225 Mpa, and the fatigue strength endurance is raised to more than 75% of the Y.S. The increase in both the yield strength and the ratio indicated that the improved fatigue behavior after FSP was due to the elimination of casting defects, which was micro-shrinkage porosity in this material.
In addition to the staircase test, some complementary tests were carried out at higher stress amplitudes to fill in the high-stress-amplitude region data and to obtain the general trend of the S-N curve. To generate the S-S-N trend curve, the general non-linear model [22] was applied to represent the data. Fig. 10 shows S-N plots of the as-cast A206 and FSPed A206. Specimens tested to 108cycles without failure were regarded as run-outs, and
they are marked with arrows in the figure. The influence of FSP on the fatigue behavior of A206 is clearly seen in Figure 10. Compared with the S-N curve of the as-cast specimen, the S-N curve of the FSPed specimen was shifted to the regime where both the stress amplitude and life cycle were higher. FSP re-sulted in a larger fatigue resistance in the high stress
ampli-FIG. 9 Experimental staircase test results for A206 at 108 cycles (a) as-cast A206; (b) FSPed A206.
Risultati sperimentali della prova a gradini per la lega A206 dopo 108 cicli (a) per la lega A206 as-cast; (b) per la lega A206 sottoposta a FSP.
tude regime. Fatigue life is longer than 106cycles even when
the stress amplitude reached 215 Mpa. Moreover, the FSP S-N plot had a steep transition from 106to 107. The number of cycles
was only reduced by less than one order of magnitude when the stress amplitude increased from 175 Mpa to 215 Mpa. The total fatigue life consists of the number of cycles required for crack initiation and the number of cycles required for crack growth and propagation to the failure. For cast Al alloys, at high stress amplitudes, the crack is readily initiated at casting de-fects, such as large pores due to high stress concentration at these locations. In such cases, fatigue life is dominated by the crack growth and propagation stage from the initial crack to the final fatal crack length, because the crack initiation life is ne-gligible [23, 24]. FSP significantly elongated the fatigue life under high stress amplitudes, which indicates that the number of cycles at the crack initiation stage also had impact on the total fatigue life.
In general, the fracture surface consists of three distinct re-FIG. 10 S-N plots of the as-cast and FSPed A206.
Curve S-N per la lega A206 as-cast e per la lega A206 sottoposta a FSP.
gions: the crack initiation region, the steady crack growth and propagation region and the fast fracture region. These regions can be identified in the fracture surfaces shown in Fig. 11. The as-cast specimen had a porous fracture surface; large porosities whose diameters were up to 200µm were observed in the SEM micrograph (Fig. 11a). The crack initiation region for the as-cast specimen (marked with the blue circle in Fig. 11a) was charac-terized by one/some microshrinkage porosities located near the edge of the specimen. In the crack growth region, there were a large number of transcrystalline cleavages radiating from the crack initiation region. FSP is an advanced tool to mitigate mi-crostructural inhomogeneities. In this study, 97% of the total po-rosity was eliminated after FSP, especially noticeable is the eli-mination of the relatively large pores. From Fig. 11b we can see that there are no obvious casting defects in the fracture surface. The fatigue crack initiated from a weak point near the edge where the concentrated stress was high. In the crack propagation region, cracks grew perpendicular to the load direction. River pat-terns that were parallel to the crack advancing direction were cle-arly revealed. The final region contained the fast fracture that was caused by overloading.
Fig. 11c and Fig. 11d show two SEM micrographs depicting the different fatigue crack initiators of the as-cast and FSPed speci-mens. For the as-cast specimen, the fatigue crack originated from a pore near the edge (Fig. 11c). The irregular shape of the pore and the dendritic appearance indicates that it was due to microshrinkage porosity. The ECD of the microshrinkage poro-sity was ~109µm. Fracture surfaces of 14 as-cast specimens were closely examined with SEM, and all cracks were caused by microshrinkage porosities located at or very close to the speci-men surface. The statistical analysis results of these porosities, i.e. ECDs, the number of porosities, and the corresponding stress amplitudes are shown in Table 2. 36% of the fatal cracks were initiated from multiple porosities that were in close proximity to each other (marked with M in Table 2). If a fracture surface contained multiple porosities, the ECD of the largest porosity lo-cated near the edge is listed in the Table. It has been found that the crack was always initiated from large porosities, and there was no obvious correspondence between the ECD of the
poro-FIG. 11
SEM images showing (a) the fracture surface of the as-cast specimen; (b) the fracture of the FSPed specimen; (c) the fatigue crack initiator of the as-cast specimen; (d) the fatigue crack initiator of the FSPed specimen.
Immagine SEM che mostra: (a) la superficie di frattura del provino as-cast; (b) la frattura del provino sottoposto a FSP; (c) l’innesco della cricca di fatica del provino as-cast; (d) l’innesco della cricca di fatica del provino sottoposto a FSP.
sity and the applied stress amplitude. These large size porosi-ties were totally eliminated via FSP, which improved the resi-stance to the crack initiation stage. For the FSPed specimen, although most coarse Al-Cu components were broken into uni-form dispersed fine Al-Cu particles, there were still some larger size Al2Cu compounds remaining in the matrix. Fatigue crack was readily initiated on the interface between the large and hard precipitates and the matrix (see Fig. 11d).
Sample
σσ
(Mpa)
ECD (um)
Single or
No.
Multiple
1
83
180
S
2
89
105
S
3
90
60
M
4
123.5
39
S
5
86
91
M
6
95
69
M
7
86
146
M
8
150
155
S
9
89
78
M
10
125
107
M
11
125
109
M
12
83
107
M
13
86
141
M
14
104.5
48
S
TABLE 2Statistical analysis of the crack initiators.
Analisi statistica degli inneschi della cricca.
Composite Fabrication
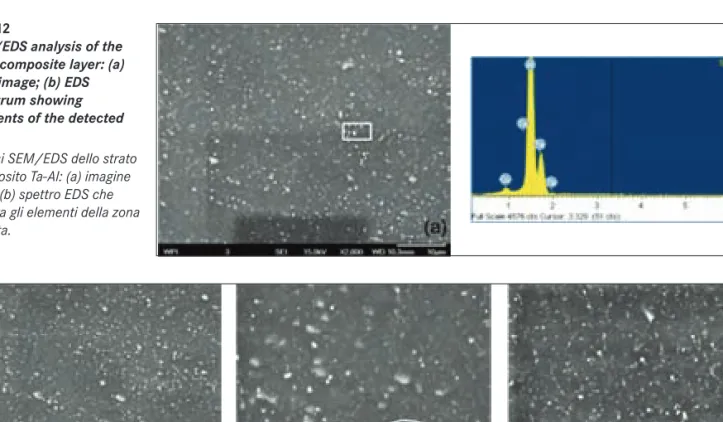
The feasibility of composite fabrication via FSP was first de-monstrated by mixing-in nano-sized Ta powders in the A206 ma-trix. The composite region was fabricated by filling a cavity of ~400 mm3. Fig. 12a shows the microstructure of the composite region which is revealed by SEM, and Fig.12b is the spectrum confirming that the particles viewed as bright spots in the white rectangular shape are Ta powders. In the SEM image, the grey background is the aluminum matrix and the larger and lighter particles (~2 µm) are the Al-Cu precipitates broken by the stir-ring action of the tool dustir-ring FSP. In addition to the size, the Ta powder has a different morphology compared with the Al-Cu particles. The Ta powders are round, whereas the Al-Cu inter-metallic particles have irregular shapes with sharp edges and corners.
The following factors account for the homogenous distribution of Ta powders: (1) particle encapsulation – the top of the slot was closed by a cover prior to FSP, which ensured that the powders were well confined in the slot and driven by the movement of the matrix materials during FSP; (2) sufficient input heat - input heat was high enough to ensure adequate materials flow, by which the reinforced particles were easily wrapped and moved around the tool; (3) complete contact between particles and the tool – the FSP tool was made up of two parts: a flat shoulder and a screwed probe at the end of the shoulder. The shoulder was the main heat resource [25], however, the probe contributed a lot on the material movement – the soften metal moved from the advancing side to the retreating side, but only limited to the range of probe diameter [26]. This was the reason that the route along which the tool traversed ahead was offset 1mm from the centerline of the slot - to make sure the advancing side of the
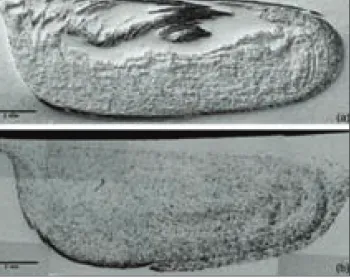
FIG. 13 SEM images of the Ta-Al composite layer: (a) overall distribution of Ta powders inside the composite layer after one-pass FSP; (b) Ta powders agglomeration; (c) improved distribution of Ta powders inside the composite layer after two-pass FSP under higher magnification.
Immagini SEM dello strato composito Ta-Al: (a) distribuzione generale delle polveri di Ta all’interno dello strato composito dopo un passaggio di FSP ; (b) agglomerazione di polveri di Ta; (c) distribuzione migliorata delle polveri di Ta all’interno dello strato composito dopo due passaggi di FSP vista con ingrandimento maggiore.
FIG. 12
SEM/EDS analysis of the Ta-Al composite layer: (a) SEM image; (b) EDS spectrum showing elements of the detected area.
Analisi SEM/EDS dello strato composito Ta-Al: (a) imagine SEM; (b) spettro EDS che mostra gli elementi della zona rilevata.
probe was fully contacted with the reinforced material. Fig. 13 shows the effect of multi-pass FSP on the distributions of Ta powders in the composite region. After one pass these pow-ders were stirred into the matrix and the distribution was good (Fig. 13a). However, some powders-agglomeration phenomenon was observed under higher magnification (Fig. 13b white circle). These powder agglomerations could be alleviated by two-pass FSP (Fig. 13c). The powders were dispersed more homogeneou-sly after two-pass FSP compared with the dispersion produced by one-pass FSP.
SiC/Al composites have high strength as well as good corrosion resistance, and they are the most commonly used composites. Most of SiC/Al composites are fabricated with large size SiC par-ticles (µm scale), and few can be produced with nano-sized SiC reinforced particles. The aim of this study is to locally fabricate the SiC/Al composites in the cast components by using smaller-size SiC particles (nano scale). Following the success in synthe-sis of the localized Ta/Al composite, FSP was applied to fabricate the SiC particle-reinforced cast alloy A206 matrix composite using the same setup and procedure as for making Ta/Al com-posite. The results showed that the distribution of nano-sized SiC powders in the matrix was good (see Fig. 14a). The spectrum in Fig. 14 b shows that the particles within the white rectangu-lar frame in Fig. 14a are SiC particles, and the rectangu-large particle on the left corner of Fig. 14a is a broken Al-Cu particle. The ave-rage size of the initial SiC particles was about 100 nm but some large SiC particles of up to 0.5 µm can be observed in the com-posite layer.
The effects of the reinforcement amount on the particle distri-bution and the quality of the composite were investigated. Tests were conducted on two levels of cavity filling: one was 200 mm3,
which filled half of the slot whose volume was 400 mm3;
ano-ther was 400 mm3 – fully filled the slot. Fig. 15 shows the
ma-crographs of the transverse section of the composite regions fabricated with different amounts of SiC particles. These pictu-res are composite pictupictu-res, which reppictu-resented a large area, and covers the entire FSP region and vicinity. It can be observed in FIG. 14
(a) SEM image of the SiC-Al composite: (b) EDS spectrum showing the ingredients of the square-marked area in (a).
(a) Immagine SEM del composito SiC-Al: (b) spettro EDS che mostra i componenti dell’area del riquadro riportato in (a).
Fig. 15 a that when the particles filled half of the slot, or the smaller amount of particles were added, the particles were prone to move towards the bottom of the FSP region on the retreating side; few SiC particles can be observed in the top or the middle of the FSP region. When more SiC particles were added, the di-stribution was improved, and this is shown in Fig. 15b. Fig. 16 contains two optical micrographs of the metal matrix composite, which was fabricated by emplacing DRA into the alu-minum matrix. The discontinuously reinforced alualu-minum is a premade solid composite with a high fraction of reinforcement FIG. 15 Patterns of SiC particle dispersion in the FSP region – effects of the amount of the SiC particles: (a) 50% cavity filling; (b) 100% cavity filling.
Configurazione della disperisione delle particelle di SiC nella regione sottoposta a FSP– effetti della quantità di particelle di SiC: (a) riempimento delle cavità del 50%; (b) riempimento delle cavità del 100%.
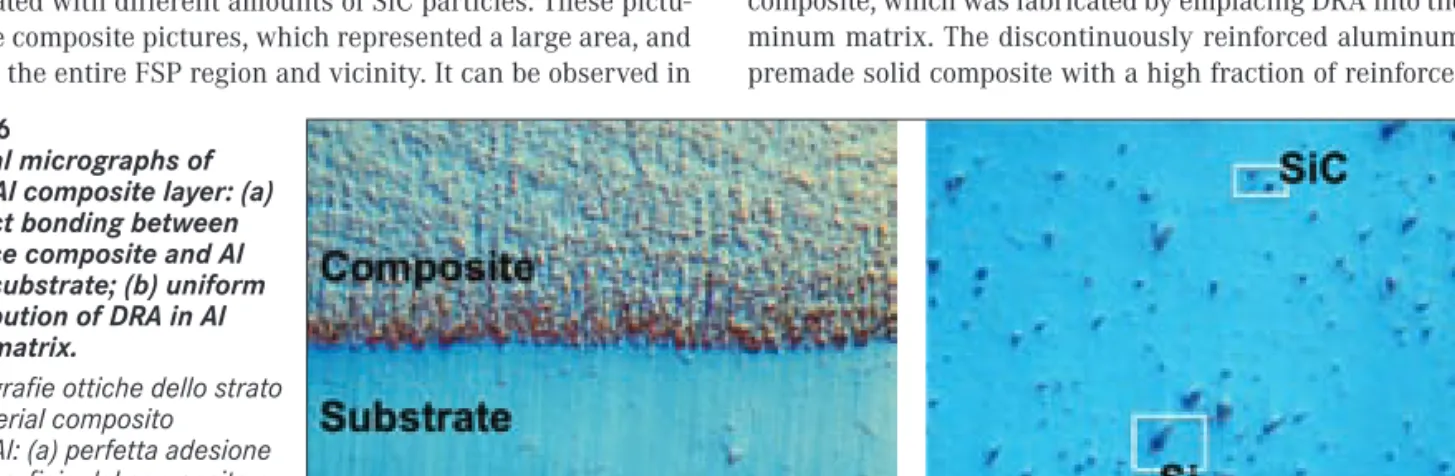
FIG. 16
Optical micrographs of DRA/Al composite layer: (a) perfect bonding between surface composite and Al alloy substrate; (b) uniform distribution of DRA in Al alloy matrix.
Micrografie ottiche dello strato di material composito DRA/Al: (a) perfetta adesione fra superficie del composito e substrato della lega Al; (b) distribuzione uniforme del DRA nella matrice della lega Al.
particles. DRA has a continuous metallic phase, into which a se-cond phase is artificially introduced. The matrix of the DRA ap-plied in this study is aluminum alloy 6061 containing about 50 wt% of Si and SiC particles. In Fig. 16 a, the interface zone bet-ween the composite region and the aluminum substrate can cle-arly be seen; the composite layer appears to be well bonded to the aluminum substrate, and the structural integrity is attained – no evidence of porosities or severe reinforcement agglomera-tion. Fig. 16 b shows the distribution of SiC inside the composite layer at a higher magnification. Apart from the improved distri-bution, the morphology of SiC was also changed subsequent to FSP – the size was decreased to less than 10 µm, and aspect ratio to 1. The rotating probe produced a breaking effect on the SiC particles, resulting in the cracking of some large particles and the knocking off of corners and sharpened edges from the large particles [26].
Fig. 17 shows the distributions of the DRA in the composites fa-bricated with different number of passes. It is evident that the particles were dispersed more homogenously after a two-pass than a one-pass FSP, and after two passes the particle agglome-rations disappeared in the middle of the FSP region.
CONCLUSIONS
FSP has been applied as an advanced post-processing tool to lo-cally manipulate the microstructure of cast A206 aluminum alloy to refine and strengthen the material. Conclusions of this work are summarized as follows:
• FSP was applied to locally manipulate the A206 microstruc-ture. The grains in the stirred zone of A206 were refined to mi-crometer levels, and the grain boundaries were clearly revealed. The fraction of high angle boundaries was increa-sed. Second phase particles were distributed uniformly in the aluminum matrix after FSP, and the size and aspect ratio of these particles decreased significantly. Porosity was nearly eliminated by FSP. The mechanism of the grain refinement was dynamic recrystallization.
• FSP strengthened A206 locally. Microhardness was increased in the FSP region. The shoulder-affected zone became harder than other locations in the FSP region. Strength (both the yield strength and the ultimate tensile strength) and ductility of the FIG. 17 The reinforcement dispersion in the FSP region of
the composites fabricated with different number of stirring passes: (a) 1 pass; (b) 2 passes.
Dispersione delle particelle nella regione sottoposta a FSP dei compositi prodotti con diversi numeri di passaggi di stirring: (a) 1 passaggio; (b) 2 passaggi.
A206 improved via FSP. These enhanced mechanical proper-ties resulted from elimination of porosity, breaking of coarse second phases and grain refinement. The fatigue strength at 108 for the FSPed A206 was almost twice in value compared with the as-cast A206. Crack initiated at pores near the sur-face of the as-cast specimens, whereas the crack initiated in the defect-free surface of the FSPed specimen from the inter-face between the large and brittle second phase particle and the aluminium matrix. The improved fatigue property was due to the increased fracture resistance in both the crack initia-tion stage.
• FSP is an advanced post-processing technique to produce lo-calized composite structures in cast Al components. Nano-sized Ta powders, nano-sized SiC powders, and discontinuously rein-forced aluminum, were synthesized in the cast aluminum A206 matrix. The composites produced for all tested conditions were characterized and evaluated. The feasibility of FSP to ma-nufacture localized composite regions in cast components was validated.
ACKNOWLEDGMENTS
The authors gratefully acknowledge the member companies of the Advanced Casting Research Center (ACRC) for their support of this work, and for their continued support of research focused on the science and technology of metal casting at Worcester Po-lytechnic Institute.
REFERENCES
1) Thomas, W.M. Nicholas, E.D., Needham, J.C., Murch, M.G., Temple-smith, P., and Dawes, C.J., GB Patent Application No. 9125978.8, De-cember 1991.
2) Cavaliere, P., and De Marco, P.P., “Friction stir processing of a Zr-modified 2014 alloy”, Materials Science and Engineering: A, 462 (1-2) pp. 206-210, 2007.
3) Cavaliere, P., and Squillace, A., “High temperature deformation of friction stir processed 7075 aluminium alloy”, Materials Characte-rization, 55 (2) pp. 136-142, 2005.
4) Cavaliere, P., “Effects of friction stir processing on the fatigue pro-perties of a Zr-modified 2014 alloy”, Materials Characterization, 57 (2) pp. 100-104, 2006.
5) Sun, N., and Apelian, D., “Friction stir processing of Al cast alloys for high performance applications”, Journal of Metals, Materials and Minerals, 63 pp. 44-50, 2011
6) Valiev, R.Z., Korznikov, A.V., and Mulyukov, R.R., “Structure and pro-perties of ultrafine-grained materials produced by severe plastic de-formation”, Materials Science and Engineering: A, 168 (2) pp. 141-148, 1993.
7) Kapoor, R., De, P.S., and Mishra, R.S., “An analysis of strength and ductility of ultrafine grained Al alloys”, Materials Science Forum, 633-634 pp. 165-177, 2010.
8) Friction stir welding and processing, edited by Mishra, R.S., and Ma-honey, M.W., ASM International, Materials Park, Ohio, 2007. 9) Kwon, Y.J., Saito, N., and Shigematsu, I., “Friction stir process as a
new manufacturing technique of ultrafine grained aluminum alloy”, Journal of Materials Science Letters, 21 (19) pp. 1473-1476, 2002. 10) Hofmann, D.C., and Vecchio, K.S., “Submerged friction stir
proces-sing (SFSP): An improved method for creating ultra-fine-grained bulk materials”, Materials Science and Engineering: A, 402 (1-2) pp. 234-241, 2005
11) Ma, Z.Y., and Mishra, R.S., “Development of ultrafine-grained mi-crostructure and low temperature (0.48 Tm) superplasiticity in fric-tion stir processed Al-Mg-Zr”, Scripta Materialia, 53 (1) pp. 75-80, 2005.
12) Charit, I., and Mishra, R.S., “High strain rate superplasticity in a commercial 2024 Al alloy via friction stir processing”, Materials Science and Engineering: A, 359 (1-2) pp. 290-296, 2003. 13) Charit, I., and Mishra, R.S., “Low temperature superplasticity in a
friction-stir- processed ultrafine grained Al-Zn-Mg-Sc alloy”, Acta Materialia, 53 (15) pp. 4211-4223, 2005.
14) Ma, Z.Y., Liu, F.C., and Mishra, R.S., “Superplastic deformation me-chanism of an ultrafine-grained aluminum alloy produced by fric-tion stir processing”, Acta Materialia, 58 (14) pp. 4693-4704, 2010. 15) Mahoney, M., Fuller, C., Miles, M., and Bingel, W., “Thick plate ben-ding of friction stir processed aluminum alloys”, Friction stir wel-ding and processing III, Edited by Jata, K., Mahoney, M., Mishra, R.S., and lienert, T., TMS, pp. 131-137, 2005.
16) Wang, W., Shi, Q., Liu, P., Li, H., and Li, T., “A novel way to produce bulk SiCp reinforced aluminum metal matrix composites by friction stir processing”, Journal of Materials Processing Technology, 209 (4) pp. 2099-2103, 2009.
17) Zhao, Y.H., Bingert, J.F., Zhu, Y.T., Liao, X.Z., Valiev, R.Z., Horita, Z., Langdon, T.G., Zhou, Y.Z., and Lavernia, E.J., “Tougher ultrafine grain Cu via high-angle grain boundaries and low dislocation density”, Applied Physical Letters, 92 (8) 081903, 2008.
18) Jacob, S., “Quality index in prediction of properties of aluminum ca-stings – a review”, AFS Transactions, 108 pp. 99-208, 2000. 19) Caton, M.J., Jones, J.W., Mayer, H., Stanzl-Tschegg, S., and Allison,
J.E., “Demonstration of an endurance limit in cast 319 aluminum”, Metallurgical and Materials Transactions A, 34 (1) pp. 33-41, 2003. 20) Mayer, H., Papakyriacou, M., Zettl, B., and Stanzl-Tschegg, S.E., “In-fluence of porosity on the fatigue limit of die cast magnesium and
aluminium alloys”, International Journal of Fatigue, 25 (3) pp. 245-256, 2003.
21) Dixon, W.J., and Mood, A.M., “A method for obtaining and analyzing sensitivity data”, Journal of American Statistical Association, 43 pp. 109-126, 1948.
22) Conway, J.B., and Sjodahl, L.H., “Analysis and representation of fa-tigue data”, ASM International, Materials park, Ohio, 1991. 23) Gao, Y.X., Yi, J.Z., Lee, P.D., and Lindley, T.C., “A micro-cell model of
the effect of microstructure and defects on fatigue resistance in cast aluminum alloys”, Acta materialia, 52 (19) pp. 5435-5449, 2004. 24) Yi, J.Z., Gao, Y.X., Lee, P.D., and Lindley, T.C., “Microstructure-based
fatigue life prediction for cast A356-T6 aluminum-silicon alloys”, Metallurgical and Materials Transactions B, 37 (2) pp. 301-311, 2006.
25) Hofmann, D.C., Vecchio, and D.S., “Thermal history analysis of fric-tion stir processed and submerged fricfric-tion stir processed alumi-num”, Materials Science and Engineering: A, 465 (1-2) pp.165-175, 2007.
26) Feng, A.H., Xiao, B.L., and Ma, Z.Y., “Effect of microstructural evo-lution on mechanical properties of friction stir welded AA2009/SiCp composite”, Composites Science and Technology, 68 (9) pp. 2141-2146, 2008.
Abstract
Miglioramento localizzato della microstruttura
mediante processo di Friction Stir per componenti pressocolati
Parole chiave:processi - pressocolata – microstruttura – fatica -Il processo di Friction stir (FSP) è una conseguenza della tecnologia di saldatura per attrito allo stato solido (Friction stir welding - FSW) nel quale viene influenzata allo stato solido localmente la microstruttura impartendo un elevato livello di energia appor-tando un miglioramento delle proprietà meccaniche. Questo studio ha mostrato che il processo FSP può essere implementato come metodo di post-fusione per eliminare localmente difetti di fusione, quali la porosità, che è generata dallo sviluppo di gas du-rante la colata. Le seconde fasi a grani grossi vengono spezzettatte in particelle fini quasi equiassiche e uniformemente distri-buite nella matrice. Inoltre, durante il processo FSP si ottiene un affinazione del grano mediante ricristallizzazione dinamica. Ciò genera una migliore microdurezza, e migliori caratteristiche di trazione e resistenza a fatica nella lega della A206 colata e sot-toposta al processo FSP. In più, il processo FSP si è rivelato uno strumento efficace nella produzione di strutture composite lo-calizzate in componenti di alluminio colati. Tali miglioramenti hanno importanti implicazioni per la produzione di componenti in molte applicazioni industriali, automobilistiche e non. I vantaggi di impiego del processo di FSP come post-processo che può essere facilmente adattato durante la lavorazione rende il metodo molto interessante. Nel presente lavoro vengono esaminati e discussi i risultati ottenuti.