GARRLiC and LIRIC: strengths and limitations for the
1characterization of dust and marine particles along with
2their mixtures
34
Alexandra Tsekeri1, Anton Lopatin2, Vassilis Amiridis1, Eleni Marinou1,3, Julia
5
Igloffstein4, Nikolaos Siomos3, Stavros Solomos1, Panagiotis Kokkalis1, Ronny
6
Engelmann4, Holger Baars4, Myrto Gratsea5, Panagiotis I. Raptis5,6, Ioannis
7
Binietoglou7, Nikolaos Mihalopoulos5,8, Nikolaos Kalivitis1,8, Giorgos
8
Kouvarakis8, Nikolaos Bartsotas9, George Kallos9, Sara Basart10, Dirk
9
Schuettemeyer11, Ulla Wandinger4, Albert Ansmann4, Anatoli P. Chaikovsky12,
10
and Oleg Dubovik2
11
[1]{Institute for Astronomy, Astrophysics, Space Applications and Remote Sensing, National 12
Observatory of Athens, Athens, Greece} 13
[2]{Laboratoire d’ Optique Atmosphérique, Universite de Lille, Lille, France} 14
[3] {Laboratory of atmospheric physics, Physics Department, Aristotle University of 15
Thessaloniki, Greece} 16
[4]{Leibniz Institute for Tropospheric Research, Leipzig, Germany} 17
[5]{IERSD, National Observatory of Athens, Athens, Greece} 18
[6]{Physikalisch-Meteorologisches Observatorium Davos/World Radiation Center 19
(PMOD/WRC), Davos Dorf, Switzerland} 20
[7]{National Institute of R&D for Optoelectronics, Magurele, Ilfov, Romania} 21
[8]{Environmental Chemical Processes Laboratory, University of Crete, Heraklion, Greece} 22
[9]{University of Athens, School of Physics, Athens, Greece} 23
[10]{Barcelona Supercomputing Center, Barcelona, Spain} 24
[11]{European Space Agency} 25
[12]{Institute of Physics, NAS of Belarus, Minsk, Belarus} 26
Correspondence to: Alexandra Tsekeri ([email protected]) 27
Abstract 1
The Generalized Aerosol Retrieval from Radiometer and Lidar Combined data algorithm 2
(GARRLiC) and the LIdar-Radiometer Inversion Code (LIRIC) provide the opportunity to 3
study the aerosol vertical distribution by combining ground-based lidar and sun-photometric 4
measurements. Here, we utilize the capabilities of both algorithms for the characterization of 5
Saharan dust and marine particles, along with their mixtures, in the South-Eastern 6
Mediterranean during the “CHARacterization of Aerosol mixtures of Dust and Marine origin 7
Experiment (CHARADMExp)”. Three case studies are presented, focusing on dust-dominated, 8
marine-dominated and dust/marine mixing conditions. GARRLiC and LIRIC achieve a 9
satisfactory characterization for the first case in terms of particle microphysical properties and 10
concentration profiles. Τhe marine-dominated and the mixture cases are more challenging for 11
both algorithms, although GARRLiC manages to provide more detailed microphysical retrievals 12
compared to AERONET, while LIRIC effectively discriminates dust and marine in its 13
concentration profile retrievals. 14
15
1 Introduction 16
The importance of studying the vertical distribution of aerosol plumes is prominent in regional 17
and climate studies, since it can effectively change the radiative properties of the atmosphere 18
and the presence of clouds (e.g. Pérez et al., 2006a; Solomon et al., 2007). Ground-based 19
monitoring of the aerosol vertical structure is effectively performed with the synergy of passive 20
and active remote sensing instruments, in particular with multi-wavelength sun-photometers 21
and lidars. The sun-photometer provides the columnar properties of the particles (e.g. Dubovik 22
and King, 2000a; Dubovik et al., 2006), whereas the lidar is capable of providing vertical 23
profiles of the backscatter and extinction coefficients, along with vertical profiles of the particle 24
microphysical properties, mainly for the fine mode (e.g. Müller et al., 2015). The combination 25
of active with passive remote sensing has been tried so far mainly by using the sun-photometer 26
measured aerosol optical depth (AOD) as ancillary information for the lidar retrieval (e.g. 27
Fernald et al., 1972; Ansmann et al., 2011; 2012). GARRLiC (Lopatin et al., 2013) and LIRIC 28
(Chaikovsky et al., 2016) algorithms go a step further and use deeper synergies: the LIRIC 29
approach derives the particle concentration profiles from the lidar measurements, considering 30
the columnar microphysical properties derived separately from the sun-photometer; GARRLiC 31
advances the method even more, combining for the first time both sun-photometer and lidar 1
measurements for the retrieval of the particle microphysical properties. As discussed in detail 2
in Lopatin et al. (2013), combining the sun-photometer intensity measurements with the 3
backscatter lidar information seems to result in better sensitivity to the particle shape, as well 4
as the ability to retrieve the refractive indices of fine and coarse particles separately, along with 5
extracting the vertical distribution of the fine and coarse particle concentrations. Moreover, it 6
can potentially provide higher accuracy for cases of low aerosol loadings, compared with the 7
intensity-only retrieval. 8
GARRLiC and LIRIC have been developed in the framework of the Aerosols, Clouds and Trace 9
gases Research Infrastructure (ACTRIS, http://www.actris.eu/), utilizing the capabilities of 10
combined European stations of the AErosol RObotic NETwork (AERONET, Holben et al., 11
1998) and the European Aerosol Research Lidar Network (EARLINET, Pappalardo et al., 12
2014). Both algorithms have been tested for a variety of aerosol types and their mixtures. For 13
example, LIRIC has been tested for dust and volcanic aerosols (Wagner et al., 2013), 14
dust/pollution mixture (Tsekeri et al., 2013), dust, pollution and mixture of dust/smoke and 15
pollution (Granados-Muñoz et al., 2014; 2015; Papayannis et al., 2014), and smoke/pollution 16
mixture (Kokkalis et al., 2016). LIRIC has also been used to study dust transport events and 17
dust modeling performance over Europe (Binietoglou et al. 2015, Granados-Munoz, 2016), as 18
well as to evaluate air quality models (Siomos, et al. 2017). GARRLiC has been tested for dust 19
and smoke (Lopatin et al., 2013) and dust aerosols (Bovchaliuk et al., 2016). 20
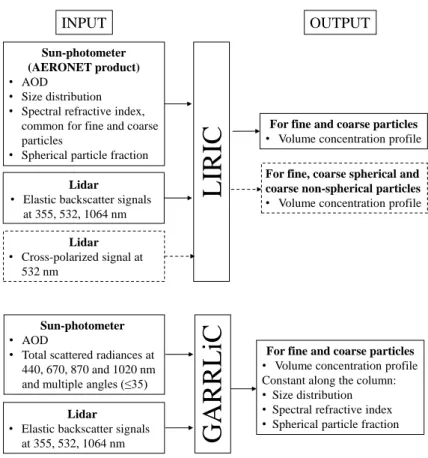
GARRLiC and LIRIC input and output data is shown in Fig. 1, while short descriptions are 21
given herein: LIRIC algorithm uses the particle microphysical properties provided in the 22
AERONET product as a-priori information in the inversion of the lidar measurements for 23
retrieving the aerosol volume concentration profiles. Using lidar measurements of elastic 24
backscatter at three wavelengths of 355, 532, and 1064 nm, LIRIC retrieves the volume 25
concentration profiles of fine and coarse particles, whereas considering also the cross-polarized 26
lidar signal at 532 nm the coarse mode can be disentangled into its spherical and non-spherical 27
components. The error estimation of the retrieved profiles is provided as well. Both LIRIC and 28
GARRLiC retrievals assume that key aerosol properties vary smoothly (e.g. aerosol 29
concentration varies smoothly with height), but otherwise do not constrain the absolute values 30
of the retrieved quantities. In this way the algorithms exclude solutions that are mathematically 31
possible, but contain unrealistic oscillations in the retrieved properties (see also Dubovik, 2004; 32
Dubovik and King, 2000). GARRLiC algorithm combines the sun-photometer sun and sky 1
measurements at four wavelengths (at 440, 670, 870 and 1020 nm) and up to 35 scattering 2
angles, with the vertically-resolved lidar measurements of the elastic backscatter at three 3
wavelengths (at 355, 532, and 1064 nm). The algorithm calculates the size distribution, 4
spherical particle fraction and spectral complex refractive index, separately for fine and coarse 5
particles, considering them constant along the atmospheric column, and the volume 6
concentration profiles of fine and coarse particles. The retrieval uncertainties of the 7
microphysical parameters are provided as well, and the profile retrieval uncertainties are 8
currently under development. The volume concentration below the lowest height of the lidar 9
signals is considered to be constant. Moreover, in case of a dominant mode (e.g. for pure dust 10
cases), the algorithm is set to retrieve the aerosol characteristics for one mode only. GARRLiC 11
and its updates are available for download at http://www.grasp-open.com/doc/ch04.php#grasp-12
manager, as part of the GRASP code (Dubovik et al., 2014). 13
In case of multi-mode aerosol mixtures an inherent deficiency of both algorithms is the number 14
of aerosol modes retrieved, with LIRIC considering three modes (fine particles, coarse spherical 15
and coarse non-spherical particles) and GARRLiC considering two modes (fine and coarse 16
particles). We need to highlight here that LIRIC retrieves three modes only for the volume 17
concentration profiles, whereas otherwise it uses the AERONET products, providing for 18
example a common spectral refractive index for all modes (Fig. 1). Both algorithms work well 19
for individual aerosol components or mixtures of (mainly) fine (e.g. pollution) and (mainly) 20
coarse (e.g. dust) particles, but they should not be able to fully characterize the mixture 21
components in case of more than one fine or coarse mode in the mixture, as in smoke/pollution 22
or dust/marine mixture cases. For the latter, LIRIC should provide an effective characterization 23
for the volume concentration profiles, since it derives the coarse spherical (hydrated marine) 24
particles and the non-spherical (dust) particles, but the characterization is not expected to be 25
satisfactory for the particle microphysical properties. 26
In our study, we apply GARRLiC and LIRIC for cases of dust, marine and dust/marine mixture 27
during the CHARADMExp campaign in the South-Eastern Mediterranean. This is the first time 28
a detailed characterization of marine and marine mixtures with dust along the atmospheric 29
column is performed for the area. So far, various studies have tried to characterize the aerosol 30
radiative properties in the Mediterranean with satellite or ground-based AOD measurements 31
(e.g. di Sarra et al., 2008; Kazadzis et al., 2009; Papadimas et al., 2012). Unfortunately, they 32
fail to overcome their limitations such as the non-realistic assumptions for the aerosol 1
absorption properties and the lack of information of the real vertical aerosol structure (Mishra 2
et al., 2014). The kind of characterization presented here is important for application in future 3
satellite missions not only for the Mediterranean, but for large parts of the globe where dust and 4
marine particles are present, as in the Atlantic Ocean (e.g. Prospero, 1996). 5
The CHARADMExp campaign and the three cases (i.e. mainly dust, marine/pollution mixture 6
and dust/marine/pollution mixture) are presented in section 2. The methodology followed in 7
our work is presented in section 3, the GARRLiC and LIRIC results are shown in section 4 and 8
finally our conclusions are given in section 5. 9
10
2 Overview of the CHARADMExp campaign and datasets 11
CHARADMExp was an experimental campaign of ESA, implemented by the National 12
Observatory of Athens (NOA), aiming at the characterization of dust and marine particles along 13
with their mixtures (http://charadmexp.gr). The campaign took place at the ACTRIS Finokalia 14
station (35.338°N, 25.670°E) on the north coast of Crete, in Greece (Fig. 2), from 20 June to 15
20 July 2014. The station is situated at the top of a hilly elevation (252 m above sea level) and 16
it is a background site with no human activities occurring at a distance shorter than 15 km, 17
making the station ideal for monitoring natural aerosols mainly of desert and marine origin. The 18
area is characterized by the existence of two well-distinguished seasons equally distributed 19
throughout the year: the dry season from April to September and the wet season from October 20
to April, with the first one characterized mainly by winds of N/NW direction (Central and 21
Eastern Europe and Balkans) carrying smoke and long range transported anthropogenic 22
pollution to the area (Sciare et al., 2008; Vrekoussis et al., 2005), and the second one with less 23
pronounced N/NW winds and important transport from the Sahara desert (S/SW winds; 24
occurrence up to 20%). Dust transport is less frequent during the dry period, however 25
commonly observed (e.g. Papadimas et al., 2005), characterized by a transportation pattern 26
through the free troposphere and weaker vertical mixing of the dust layers (e.g. Kalivitis et al., 27
2007). 28
2.1 Instruments and methods 1
2.1.1 Lidar 2
The PollyXT OCEANET lidar (Engelmann et al., 2016) operated at a 24/7 basis during
3
CHARADMExp, measuring aerosol loads in the boundary layer and the free troposphere. The 4
system was provided by the Leibniz Institute for Tropospheric Research (TROPOS -5
http://www.tropos.de). It employs 3 backscatter channels (at 355, 532 and 1064 nm), 2 Raman 6
extinction channels (at 387 and at 607 nm), 2 depolarization channels (at 355 and 532 nm) and 7
one water–vapor channel (at 407 nm). The lidar is housed in a container and can be operated 8
under various climatic conditions. The full description of the original lidar system can be found 9
in Althausen et al. (2009) and in Engelmann et al. (2016). More about the network of Polly 10
systems (i.e., PollyNET) can be found in Baars et al. (2016).
11
The information close to the surface is very important for our study, especially for the marine 12
particle characterization, since the marine particles reside mostly below 1 km (e.g. Ho et al., 13
2015). Unfortunately, this is also the lidar “overlap region”, with large uncertainty for the lidar 14
backscattered signal due to its partial collection from the telescope (e.g. Wandinger and 15
Ansmann, 2002). PollyXT OCEANET far-field (FF) signal full overlap is at ~800 m (Engelmann
16
et al., 2016) and it operates two near–field (NF) channels utilizing a separate 50–mm refractor 17
telescope at a distance of 120 mm from the axis of the laser beam, providing a full overlap at 18
150 m above surface at 532 and 607 nm. The NF measurements are not used in the input of 19
GARRLiC and LIRIC, since both algorithms require the complete set of wavelengths provided 20
by the lidar during CHARADMExp only for the FF measurements. Nevertheless, we use the 21
NF measurements to perform overlap correction in the FF signals, as described in Engelmann 22
et al. (2016), and this allowed us to use the FF-corrected lidar signals from ~550 m, instead of 23
800 m. In future efforts we plan to utilize the additional information provided by our new 24
PollyXT lidar system currently installed at Finokalia station, measuring NF signals at both 355 25
and 532 nm, by performing the signal gluing technique for NF and FF signals at 355 and 532 26
nm and overlap correction for the FF signal at 1064 nm. 27
2.1.2 Sunphotometer 28
The CIMEL CE318 sunphotometer is the instrument used in the AERONET sunphotometer 29
network, with more than 250 units worldwide. The technical specifications of the instrument 30
are given in detail by Holben et al. (1998). Taking into account all the information about the 31
instrument precision and calibration precision (Holben et al., 1998) the accuracy of the AOD 1
measurements is estimated to be of the order of ±0.02 in the UV and ±0.01 in the Visible 2
regarding the level 2 (cloud-screened and quality-assured) data. In the current analysis we 3
utilized the level 1.5 products (i.e., automatically cloud cleared but may not have final 4
calibration applied) for the LIRIC retrieval, since the level 2 data were not available in the time 5
ranges selected for the retrievals. For the GARRLiC retrieval we used the sun and sky multi-6
angle measurements at four wavelengths (440, 670, 870 and 1020 nm) (Dubovik and King, 7
2000). 8
2.1.3 Surface in situ 9
The GARRLiC retrieved size distribution is evaluated against the surface measurements of the 10
Scanning Mobility Particle Spectrometer (SMPS). SMPS provides the fine particle number size 11
distribution at ~9 - 848 nm (nominal) radius. Unfortunately, there were no size distribution 12
measurements for the coarse particles at Finokalia station during CHARADMExp. Note that 13
for a direct comparison of SMPS number size distribution (in cm−3) with the GARRLiC 14
volume size distribution retrievals (in μm3μm−2) we first have to calculate the SMPS volume 15
size distribution (in μm3cm−3) and then to multiply it with the extent of fine particles in the 16
column, derived by the collocated lidar measurements. 17
Moreover, we evaluate the particle concentration derived from GARRLiC and LIRIC at the 18
surface level with the surface in situ measurements of the particular matter for particles with 19
diameters less than 10 µm (PM10). The PM10 is continuously measured at Finokalia station with
20
an Eberline FH 62 I-R (Eberline Instruments GmbH) particulate monitor (Gerasopoulos et al., 21
2006). GARRLiC and LIRIC retrieve the particle concentration for a wider size range (up to 15 22
µm in radius, or 30 µm in diameter), thus their PM10 values are calculated using the respective
23
volume percentages for particles with radius less than 5 µm. 24
In order to compare the in situ measured size distribution and mass concentration with 25
GARRLiC and LIRIC ambient retrievals, we need to take into account the particle drying 26
applied to surface measurements. The in situ instruments dry the sampled air by adiabatic 27
compression during the sampling through their inlets and by the radiant heat from the lights 28
inside the instruments. The size and mass of the ambient particles thus changes, especially in 29
case of hygroscopic particles in humid conditions (e.g. Snider and Petters, 2008). For the size 30
distribution we evaluate this effect qualitatively (see section 4.2 and 4.3). For the PM10
comparison we calculate the “dry” GARRLiC and LIRIC PM10, using the particle hygroscopic
1
growth (i.e., the ratio of the ambient to dry particle size, 𝑓𝑔) as shown in Eq. 1: 2
𝑃𝑀10𝑑= 𝑓𝑔−3𝑃𝑀10𝑎 (1)
where 𝑑 and 𝑎 denote the dry and ambient particles, respectively. 3
We derive 𝑓𝑔 for different relative humidity (RH) values using the hygroscopicity parameter 𝜅 4
(Petters and Kreidenweis, 2007) as shown in Eq. 2: 5 𝑓𝑔= (1 + 𝜅 𝑅𝐻 100−𝑅𝐻) 1 3 (2)
For the cases analysed herein, we consider a 𝜅 value of 0.4 to be characteristic for particles in 6
the south-eastern Aegean Sea (Bezantakos et al., 2013). A more detailed treatment of comparing 7
dry in situ measurements with ambient remote sensing retrievals is out of the scope of this 8
analysis, but it is very important when combining these different techniques (e.g. Tsekeri et al., 9 2017). 10 2.2 Models 11 2.2.1 Source-receptor analysis 12
The origin of the examined aerosol layers at the Finokalia station is investigated with the use 13
of source-receptor computations derived with dispersion modelling tools. The corresponding 14
emission sensitivity (i.e. the residence time of the tracer particles inside the lowest tropospheric 15
layers) is calculated from backward Lagrangian simulations with the atmospheric dispersion 16
model FLEXPART-WRF (Brioude et al., 2013). The dispersion model is offline coupled with 17
the WRF_ARW atmospheric model (Skamarock et al., 2008). The spatial resolution of WRF is 18
12×12 km and we use its hourly outputs to drive the FLEXPART runs. This configuration 19
allows the simulation of meso-γ scale circulations that play an important role for the planetary 20
boundary layer properties and for the regional and local scale transport of the particles. The 21
backward FLEXPART runs are performed for 5-day periods and we assume a release of 40000 22
tracer particles from each arriving layer over the Finokalia station. The modelled retroplume 23
maps show the spatial distribution of the tracer particle residence time below 1 km. Thus, the 24
areas showing longer residence times in these maps indicate the source areas/origin of the 25
particles arriving at the specific heights above Finokalia station. 26
2.2.2 Desert dust model 1
Desert dust emissions and transport are described with the BSC-DREAM8b model (Nickovic 2
et al., 2012; Pérez et al., 2006a; Basart et al., 2012a). The BSC-DREAM8b model is embedded 3
into the Eta/NCEP atmospheric model and solves the mass balance equation for dust, taking 4
into account the different processes of the dust cycle (i.e., dust emission, transport and 5
deposition). The updated version of the model includes a source function based on the 1 km 6
USGS land use data, 8 particle size bins (0.1–10 µm radius range), and dust-radiative 7
feedbacks.The present analysis utilize the BSC-DREAM8b dust simulations for the period from 8
20 June to 20 July 2014 with hourly output. The initial state of dust concentration in the model 9
is defined by the 24 h forecast from the previous day model run. The NCEP Final Analyses (at 10
1o × 1o horizontal resolution) at 00:00 UTC are used as initial conditions and boundary 11
conditions at intervals of 6 h. Moreover, the model configuration includes 24 Eta vertical layers 12
extending up to approximately 15 km in the vertical. The resolution is set to 1/3° in the 13
horizontal. 14
2.2.3 Sea-salt model 15
Sea salt emissions and transport are described with the atmospheric model RAMS-ICLAMS 16
(Solomos et al., 2011). The model is an enhanced version of RAMS (Pielke et al., 1992; Cotton 17
et al., 2003) and it includes a full description of the sea salt lifecycle in the atmosphere. The 18
parameterization of sea salt emission is based on the white-cap formation for the entrainment 19
of sea salt spray in the atmosphere (Monahan et al., 1986), taking also into account the effects 20
of RH on the size distribution of the particles (Zhang et al. 2005). Sea salt flux close to the 21
coastline is also calculated in the model following the parameterizations of Leeuw et al. (2000) 22
and Gong et al. (2002). The dry and wet removal processes are treated with the corresponding 23
schemes described in Seinfeld and Pandis (1998). The simulated sea salt mass is represented 24
with a bimodal lognormal distribution. The first (accumulated) mode has a mean diameter of 25
0.36 µm and a geometric dispersion of 1.80. The second (coarse) mode has a mean diameter 26
of 2.85 µm and the geometric dispersion is 1.90. 27
28
3 Results 29
In order to demonstrate the GARRLiC and LIRIC capabilities in characterizing events with dust 30
and marine particles, we analyse in detail three cases acquired during CHARADMExp at 31
Finokalia. The first case is a relatively moderate dust episode with low amount of marine and 1
continental particles, the second is a low-AOD marine and continental plume and the last is a 2
mixture of dust, marine and continental particles. Source-receptor simulations are used to derive 3
the particle origin and characterize the air masses. Then, we compare the optical properties 4
retrieved from GARRLiC and LIRIC, as well as the collocated Klett retrievals (Klett, 1985). 5
The GARRLiC and LIRIC/AERONET fine mode size distributions and PM10 concentrations
6
are compared with surface in situ measurements. Finally, the dust and marine concentration 7
profiles are compared with the corresponding profiles from BSC-DREAM8b and RAMS-8
ICLAMS models. 9
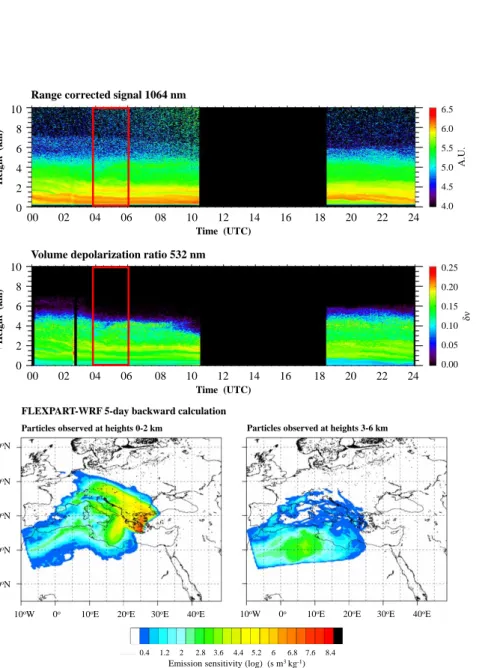
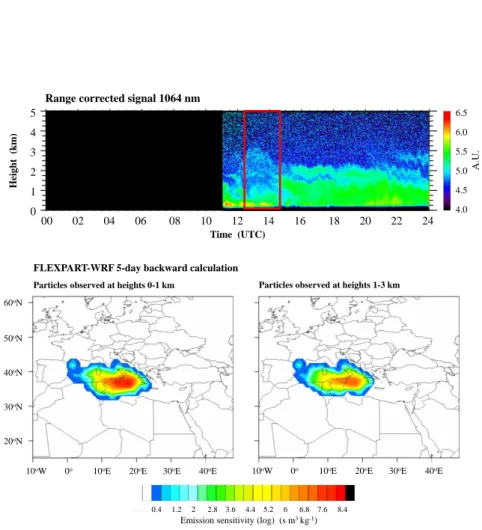
3.1 Dust-dominated case 10
On June 26 the PollyXT measurements of volume depolarization ratio at 532 nm showed the
11
advection of non-spherical particles (volume depolarization ratio at 532 nm of 0.15-0.2), at 12
height ranges extending from close to the ground up to 5-6 km (Fig. 3a) and an AOD at 440 nm 13
of 0.4. Model simulations also support our observations: dust transport simulations using the 14
BSC DREAM8b model indicate Saharan dust transport to Finokalia. As shown by the 15
FLEXPART footprints in Fig. 3b, the particles reaching from the ground up to 2 km have 16
possible near-surface sources at the West Sahara region, with potential mixing of marine and 17
continental particles from the western Mediterranean region, the Balkans and Greece, while the 18
particles arriving at 3-6 km are most likely dust from the Sahara desert between 0°-10° E and 19
25°-35° N. The presence of dust particles is indicated from AERONET as well, with Ångstrom 20
exponent at 440/870 nm of ~0.1, sphericity parameter <2.3 % and a coarse-mode dominated 21
size distribution. These values are characteristic for dust particles, as reported in the 8-year 22
global AERONET climatology of Dubovik et al. (2002). 23
Considering that the atmospheric column is dominated by dust (as shown in the coarse mode 24
dominated AERONET size distribution), we performed the one-mode GARRLiC inversion. 25
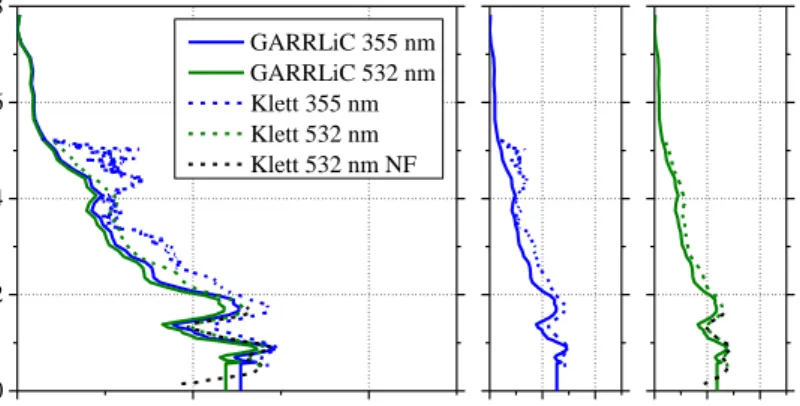
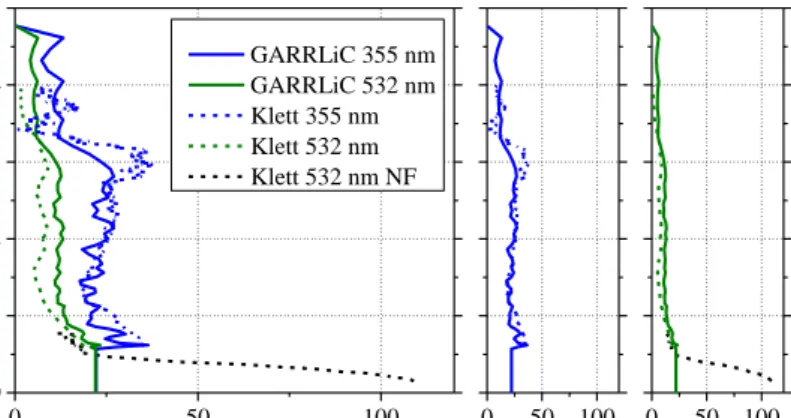
For both GARRLiC and LIRIC we used the lidar measurements at 4-6 UTC (red box in Fig. 26
3a) and the sun-photometer measurements at 4:54 UTC. Our results show that GARRLiC and 27
LIRIC backscatter and extinction coefficient profiles at 355, 532 and 1064 nm agree quite well 28
within the LIRIC uncertainties with small differences seen below ~550 m, in the lidar 29
incomplete overlap region (first and second row in Fig. 4). Figure 4 shows also the comparison 30
of GARRLiC backscatter and extinction coefficients with the ones produced with the Klett 31
method (Klett, 1985). The Klett profiles are cut above 5 km, since the low signal to noise ratio 1
of the day-time lidar measurements introduces large uncertainty to the Klett retrievals above 2
that height. For the Klett retrievals we used an extinction-to-backscatter ratio, or “lidar ratio” 3
(LR) of 40 sr for 532 and 1064 nm and of 47 sr for 355 nm, which result in extinction coefficient 4
profiles that closely reproduce the sun-photometer-measured AODs at 340, 500 and 1020 nm 5
(i.e. 0.42, 0.42 and 0.38), respectively. The uncertainty in the assumed lidar ratios are taken into 6
account by considering a 20 % uncertainty in the backscatter retrievals (Fig. 4, third row). The 7
agreement of GARRLiC with Klett retrievals is considered satisfactory, with differences for the 8
backscatter coefficient to be within the Klett retrieval uncertainty, and for the extinction 9
coefficient to be less than 30% at heights above 550 m. Figure 4 shows also the NF retrievals 10
at 532 nm, providing information of the particle properties down to 150 m: In particular, we 11
see a decrease in the particle backscatter and extinction coefficients near the surface, which is 12
not retrieved by GARRLiC or LIRIC due to missing NF information as discussed in section 13
3.1.1. 14
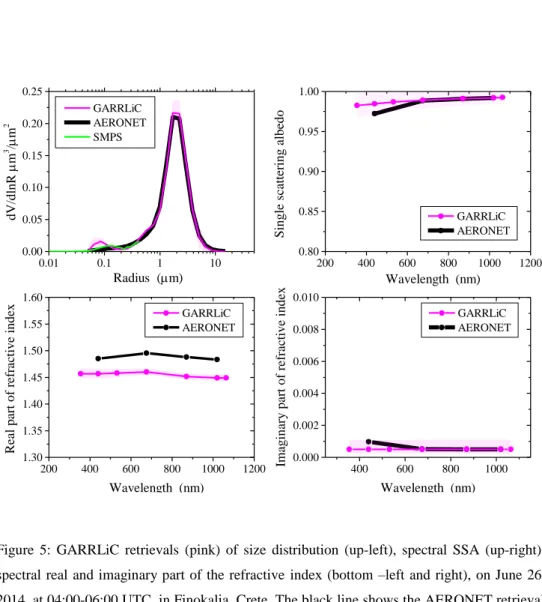
A special feature seen in GARRLiC, LIRIC and Klett backscatter profiles is the larger 15
backscatter at 532 than 355 nm. This is not usual for dust particles, but it has been reported 16
before: Veselovskii et al. (2016) have shown a similar spectral dependence for dust during the 17
study of SaHAran Dust Over West Africa (SHADOW) campaign, which they attributed to large 18
dust particle spectral variation of the imaginary part of the refractive index. More specifically, 19
they managed to reproduce this backscatter spectral dependence with imaginary part values of 20
0.005-0.05 at 355 nm and 0.005 at 532 nm. Although these values are not the same with the 21
retrieved 0.001 at 355 nm and 0.0005 at 532 nm for our case (Fig. 5 –bottom, right), the 22
backscatter spectral dependence can be a combination of the effect that different factors have 23
on the backscattered light, as the size, shape or orientation of the dust particles. 24
Figure 5 shows good agreement between GARRLiC and AERONET retrievals (the latter used 25
in the LIRIC retrieval), within the GARRLiC retrieval uncertainties. Differences are seen only 26
for the real part of the refractive index, which for GARRLiC is at ~1.45, at the low end of the 27
dust climatological value range of 1.48±0.05-1.56±0.03 as reported in Dubovik et al. (2002). 28
This value though is much lower than expected for dust from West Sahara in situ measurements, 29
reporting values of 1.55-1.65 (e.g. Kandler et al., 2007), and it may be due to the marine particle 30
mixture at lower heights, with real part of refractive index of ~1.35. An important feature of the 31
GARRLiC retrieval is the spectral dependence of the single scattering albedo (SSA), showing 32
the characteristic increase of dust absorption in the ultraviolet (Fig. 5, up right) (Otto et al., 1
2007). Moreover, the GARRLiC size distribution agrees well with surface in-situ SMPS 2
measurements for the fine mode, showing a very small volume concentration for fine particles. 3
The SMPS number size distribution is converted to μm3μm−2 for a direct comparison with the 4
GARRLiC and AERONET product, as described in section 2.1.3: For this conversion we 5
consider that mainly the first 2 km contain fine particles due to the mixing of marine and 6
continental particles with dust there (Fig. 3b). Moreover, due to the low RH at the surface of 7
16%, we do not expect differences between the GARRLiC ambient size distribution and the 8
SMPS dry measurements. 9
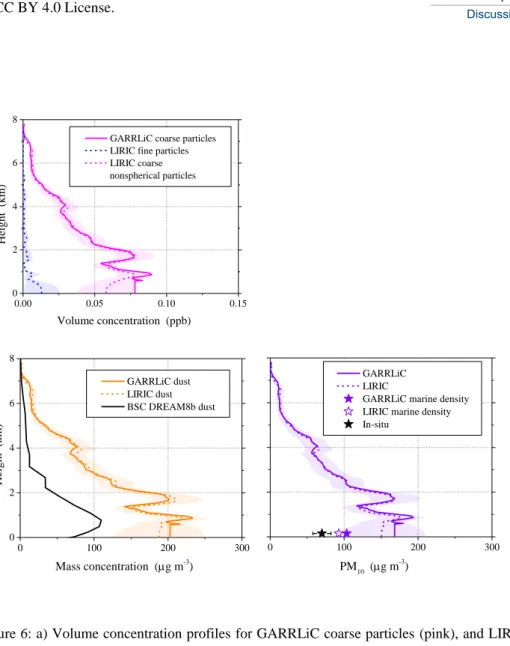
The concentration profiles from GARRLiC and LIRIC are in excellent agreement at heights >1 10
km (Fig. 6a). LIRIC retrieves fine and coarse mode profiles, whereas GARRLiC considers only 11
one mode, dominated by coarse particles. The LIRIC coarse mode is comprised only of non-12
spherical particles. Figure 6b (left) shows the comparison of GARRLiC and LIRIC dust particle 13
profiles with the BSC DREAM8b model. For this comparison we consider all particles in 14
GARRLiC and LIRIC profiles to be dust particles. Furthermore, we multiply them with the dust 15
density of 2.6 g cm−3 (Reid et al., 2003) to convert the volume concentration ratio (in ppb) to 16
dust mass concentration (in 𝜇g m−3). Although the shapes agree well, the BSC DREAM8b 17
model values are lower than GARRLiC and LIRIC, by a factor of 2. The BSC DREAM8b 18
underestimation when comparing to LIRIC is consistent with the findings of Binietoglou et al. 19
(2015) for relative low dust concentrations (as is the case here). The underestimation is shown 20
in the BSC DREAM8b dust AOD at 550 nm as well, with a value of ~0.2, which is half of the 21
sun-photometer-measured AOD at 500 nm, of 0.4. When we scale the BSC-DREAM8b 22
concentration with these AOD values (multiplying by a factor of 2) the bias is reduced to less 23
than 10% at 1 km and 50% at 3 km, relative to GARRLiC and LIRIC concentrations. The 24
GARRLiC and LIRIC mass concentrations are compared also with surface in situ PM10
25
measurements, showing the algorithms overestimating the particle concentration at the surface 26
level (Fig. 6b, right). We calculate the PM10 concentrations from GARRLiC and LIRIC mass
27
concentrations, as percentages of the particles with diameter less than 10 µm (i.e., 83% and 80% 28
of the total mass, respectively). Figure 6b (right) shows the GARRLiC and LIRIC PM10 surface
29
values (purple stars in plot), considering marine instead of dust particles at the surface, thus 30
using the marine particle density for the volume to mass conversion (i.e., 1.7 g cm−3 for dry 31
marine particles (Stock et al., 2011), since the measured RH at the surface is 16%). The 32
agreement with the surface in situ measurements is better now, but it is only indicatory, since 1
what we have at the surface is most probably a mixture of marine, continental and dust particles 2
as shown in Fig 3b. 3
Summarizing, the GARRLiC and LIRIC retrievals are performing well for the dust episode on 4
July 26, considering the consistency with the Klett retrievals, the BSC DREAM8b modelled 5
mass concentration profiles, the surface in situ measurements of the fine mode size distribution, 6
as well as the expected increase of the dust absorption in the ultraviolet. The discrepancies seen 7
for the retrieval closer to the surface and the PM10 at the surface level can be explained if we
8
consider the incomplete lidar information in the overlap region. 9
3.2 Marine and polluted continental particle case 10
On July 15 the lidar measurements at 12:30-14:30 UTC showed a low-AOD layer of non-11
depolarizing particles, extending up to 3 km (Fig. 7a). The lack of depolarization indicates 12
spherical (hydrated) marine particles which is also supported by our source-receptor analysis 13
(Fig. 7b). Specifically, FLEXPART-WRF simulations show that the particles above Finokalia 14
station have mainly a marine origin along the whole atmospheric column, with a possible 15
contribution of continental aerosol from Southern Italy. This scenario is further supported by 16
AERONET measurements at 13:24 UTC, of low AOD of ~0.06 at 500 nm, high Ångstrom 17
exponent of ~1.2 at 440/870 nm and low refractive index of ~1.4+i0.0005 at 440 nm, which are 18
within the climatological value ranges for marine particles and their mixtures, as reported from 19
Dubovik et al. (2002). 20
The low AOD is unfavourable for the GARRLiC and AERONET microphysical property 21
retrievals, especially for the spectral refractive index and SSA (Dubovik et al., 2000b; Lopatin 22
et al., 2013). The latter require an AOD of at least 0.4 at 440 nm for satisfactory accuracy in 23
case of sun-photometer-only retrieval (Dubovik et al., 2000b). The lidar information combined 24
with the sun-photometer measurements in GARRLiC is expected to improve the retrieval in 25
low AOD cases (Lopatin et al., 2013). Although the AOD requirements have not been 26
quantified yet for GARRLiC, an AOD of 0.3 at 440 nm is considered sufficient. As reported 27
in Dubovik et al. (2002) though, the marine particles rarely exceed the AOD of 0.15 at 440 nm, 28
thus we do not expect highly accurate refractive index and SSA retrievals from GARRLiC, or 29
from AERONET/LIRIC, for the marine particles. Even more so, the marine case analysed here 30
has a much lower AOD, thus we consider the refractive index and SSA retrievals to be only 31
indicative for this case. In addition, as seen in Fig. 7a, most of the aerosol load is located below 1
1 km, where the lidar incomplete overlap region is located, which challenges even more the 2
combined lidar/sun-photometer retrieval. 3
The GARRLiC and LIRIC retrievals used the lidar measurements at 12:30-14:30 UTC (red box 4
in Fig. 7a) and the sun-photometer measurements at 13:24 UTC. Figure 8 shows the retrieved 5
backscatter and extinction coefficients at 355, 532 and 1064 nm, and the corresponding 6
retrievals from the Klett method. For the latter we consider a LR of 50, 45 and 45, for 355, 532 7
and 1064, respectively, that closely reproduce the sun-photometer measured AODs of 0.1, 0.05 8
and 0.02 at 340, 500 and 1020 nm. The agreement between GARRLiC and LIRIC is satisfactory 9
within the LIRIC uncertainties. Above 550 m, this is also the case for GARRLiC and Klett 10
backscatter coefficient retrievals, whereas for the extinction coefficients the differences are 11
within 30% for 355 nm and 10-40% for 532 nm relative to GARRLiC values. In the marine 12
boundary layer (below 550 m) the Klett NF backscatter and extinction coefficients at 532 nm 13
show much larger values than the ones retrieved from GARRLiC and LIRIC. This highlights 14
very vividly the importance of the NF measurements in properly retrieving the marine particle 15
properties with lidars. 16
GARRLiC retrieves both fine and coarse particles in this case, which we consider to be mainly 17
of continental and marine origin, respectively. The fine particle volume size distribution shows 18
~10% more volume than the AERONET product (also used in LIRIC retrieval), as well as the 19
surface in situ SMPS measurements (Fig. 9, up left). The SMPS volume size distribution is 20
converted to μm3μm−2 considering that most particles reside from the surface up to ~ 1 km 21
(Fig. 7). The difference may be partly due to the instrument drying the particle sample, but the 22
effect is not expected to be that strong since the RH at the surface is 60% and the corresponding 23
hygroscopic growth is estimated at 1.17 (section 2.1.3, Eq. 2). For the coarse mode, GARRLiC 24
retrieves ~50% more volume than AERONET. The AERONET SSA and spectral refractive 25
index retrievals are the same with the GARRLiC fine mode retrievals, or within the retrieval 26
uncertainty (Fig. 9). These high values of SSA (close to 1) and the refractive index of 27
1.38±0.4+i0.0005±0.0003 are within the range of climatological values of continental particles, 28
according to Dubovik et al. (2002). For the GARRLiC coarse mode, the SSA and imaginary 29
part of the refractive index show very high values for marine particles, which are most probably 30
false, whereas the real part of the refractive index of ~1.36 agrees well with the climatological 31
value of 1.36±0.01 for marine particles (Dubovik et al., 2002). 32
Figure 10a shows the GARRLiC and LIRIC volume concentration profiles, which agree well 1
within the LIRIC retrieval uncertainties above 550 m, whereas below the GARRLiC 2
concentration for the coarse particles is larger. Assuming that the marine particles are comprised 3
only of coarse particles, we derive the marine mass concentration profiles from GARRLiC and 4
LIRIC as shown in Fig. 10b (left). The mass concentration profiles are calculated from the 5
coarse volume concentration profiles using a sea salt density of 1.3 g cm−3. This value denotes 6
the density of a sea salt solution at a RH of 50-60 % (Eq. 3 in Zhang et al. (2005)), with the RH 7
values provided from the RAMS model. Figure 10b (left) shows also the RAMS-ICLAMS sea 8
salt model mass concentration profile which presents lower values than GARRLiC and LIRIC, 9
with differences of ~80% and 60% at the surface, respectively. Moreover, GARRLiC and 10
LIRIC PM10 mass concentrations seem to agree well with the surface in situ PM10
11
measurements (Fig. 10b, right), within the time variability of the latter. The GARRLiC and 12
LIRIC PM10 values are calculated using the respective percentages of volume size distributions
13
for particles with diameter less than 10 µm (i.e., the sum of fine mode volume and 35% of 14
coarse mode volume for GARRLiC and 50% of total volume for AERONET/LIRIC). The 15
comparison with the in situ measurements should also consider the drying of the ambient 16
sample by the in situ instrument. We calculate the GARRLiC and LIRIC “dry” PM10,
17
considering a hygroscopic growth factor of 1.17 at RH=60% at the surface (section 2.1.3). The 18
“dry” values agree well with the in situ measurements, within the latter time variability. 19
Summarizing, GARRLiC retrieves more fine particles than AERONET and surface in situ 20
measurements. The fine particle SSA and refractive index is characteristic of continental 21
particles. The corresponding coarse mode retrieval probably fails for SSA and the imaginary 22
part of the refractive index, which are very difficult to be retrieved with low AODs, but the real 23
part of the refractive index properly assigns the refractive index of marine particles. Both 24
GARRLiC and LIRIC concentration profiles seem to agree well with the PM10 surface in situ
25
measurements. Since the marine-dominated scenes usually have very low AOD and low vertical 26
extent (Ho et al., 2015), it is challenging to obtain trustworthy retrievals from GARRLiC and 27
LIRIC for marine particle scenes. One way to improve the marine retrievals in future efforts 28
could be to try to increase the lidar information in the overlap region, utilizing for example the 29
NF lidar measurements, as discussed in section 3.1.1. 30
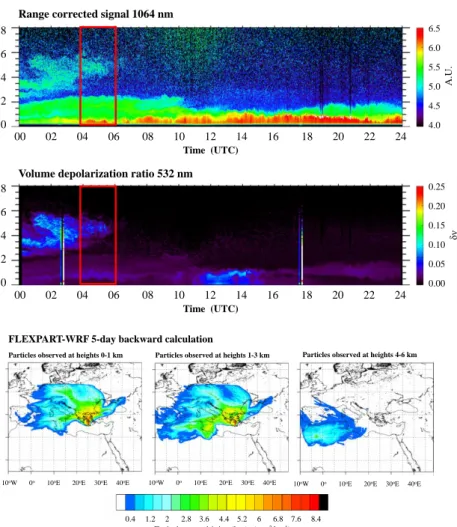
3.3 Dust and marine case 1
On July 4 a mixture of dust, marine and continental aerosols was observed at Finokalia station. 2
Figure 11a, shows at 4-6 UTC an advected depolarizing dust plume at 4-6 km and a less-3
depolarizing plume extending from the ground up to 2-3 km, with volume depolarization ratios 4
at 532 nm of 0.1 and <0.05, respectively. This is a weak dust episode, with a measured column 5
AOD of ~0.15 at 500 nm, which according to the AERONET and GARRLiC uncertainty 6
standards discussed in Section 4.2 should not be sufficient for a full characterization of the 7
particles. The dust and marine particle transport is supported by the BSC DREAM8b dust model 8
and RAMS-ICLAMS sea salt model simulations (Fig. 12b, left), respectively, as well as from 9
our FLEXPART-WRF source-receptor calculations (Fig. 11b). The latter show mainly Saharan 10
dust particles at 4-6 km, marine particles mostly from the Aegean Sea along with continental 11
particles from the Balkans up to 1 km, and a mixture of marine, continental and dust particles 12
at 1-3 km. 13
GARRLiC retrieves these three layers (Fig. 12a) but it cannot characterize them effectively in 14
terms of their refractive indices, since it is able to retrieve only one refractive index for each 15
mode. For example, the coarse mode of the dust/marine mixture contains dust particles with a 16
real part of refractive index of ~1.55-1.65 (e.g. Kandler et al., 2007) together with marine 17
particles of quite different refractive index, with a real part of ~1.35 (Dubovik et al., 2002). 18
Thus, what we get from GARRLiC as the refractive index of the mixture coarse mode is 19
possibly closer to an average of the refractive indices of dust and marine particles. This is shown 20
in Fig. 13 (down, right), with the GARRLiC coarse mode refractive index to have a value of 21
1.45 for the real part. The imaginary part of the coarse mode and the SSA show an unusual 22
increase and decrease, respectively, towards the longer wavelengths, which is most probably 23
false. The fine mode should contain mostly continental particles, but the retrieved refractive 24
index of 1.36+i0.001 is more characteristic for marine particles (Dubovik et al., 2002). The 25
AERONET retrieval (used in LIRIC algorithm), assigns a marine refractive index 26
(~1.35+i0.0005) to both fine and coarse particles. The fine mode size distribution compares 27
well with AERONET, but present slightly lower values than SMPS surface in-situ 28
measurements (Fig. 13, up left). With a surface RH of 75%, corresponding to a hygroscopic 29
growth factor of 1.3 (Eq. 2), the GARRLiC fine particle size distribution should be larger than 30
the SMPS dried particle measurements. 31
Figure 14 shows the potential of GARRLiC to retrieve the “marine” and “dust” components of 1
the mixture, by changing the definition of the two modes retrieved: instead of “fine” and 2
“coarse” mode GARRLiC is set to retrieve two modes that span the whole size range so as both 3
contain coarse particles, and it derives a “dust” mode that contains only coarse particles and a 4
“marine” mode that contains both fine and coarse particles, of bigger size than “dust”. Raptis 5
et al. (2015) showed similar results for the marine and dust size distribution using their 6
multimodal analysis for a different dust/marine mixture case during the CHARADMExp 7
campaign. The retrieved real part of the refractive index is ~1.33 for “marine” particles and 8
~1.47 for “dust” particles. Although these values are very close to the climatological values for 9
marine and dust particles, the retrievals of the imaginary part of the refractive index and the 10
volume concentration profiles are not satisfactory (not shown here). We believe that these 11
results show a potential for successful marine/dust mixture characterization from GARRLiC in 12
the future, if the new versions of the algorithm utilize the cross-polarized signals as well. As in 13
LIRIC, the polarization measurements will help to derive the spherical (marine) and non-14
spherical (dust) components of the mixture. 15
LIRIC provides the dust and marine vertical distribution, since it disentangles the coarse particle 16
volume concentration profile to its spherical (marine) and non-spherical (dust) components 17
(Fig. 12a, right). Assuming a very low contribution from dust and marine particles in the fine 18
mode we acquire the “marine” and “dust” concentration profiles from the spherical and non-19
spherical coarse particle concentration profiles, respectively. The left plot of Fig. 12b shows 20
that LIRIC marine and dust mass concentration profiles have larger values than the BSC 21
DREAM8b dust and the RAMS-ICLAMS sea salt models, respectively. In order to acquire the 22
mass concentration profiles, LIRIC dust and marine volume profiles are multiplied with the 23
density values of 2.6 g cm−3 (Reid et al., 2003) and 1.25 g cm−3, respectively. The marine 24
particle density corresponds to 60-80% RH (Zhang et al., 2005), as this is provided by the 25
RAMS model at 0-1 km. We believe that BSC DREAM8b model underestimates the dust 26
concentration, as for the dust case in section 4.1, since the model AOD of ~0.025 at 500 nm is 27
approximately 5 times lower than the sun-photometer measured AOD at 550 nm (not taking 28
into account the AOD contribution of the marine and continental particles). Multiplying the 29
BSC DREAM8b dust profile by 5 we get a better agreement with LIRIC dust profile at 4-6 km, 30
but in the mixed layer at 0-3 km this agreement is not satisfactory (not shown here). The RAMS-31
ICLAMS model show lower sea salt concentration than LIRIC (as in section 4.2), with ~60 % 32
differences at the surface level. The right plot in Fig. 12b shows that LIRIC PM10 values agree
1
well with the surface in situ measurements, within the latter time variability. The LIRIC PM10
2
is calculated using the volume percentage of the particles with diameter less than 10 µm (i.e., 3
60% of the total volume). Moreover, we calculate the LIRIC “dry” PM10 using Eq.1 and
4
considering a particle hygroscopic growth of 1.3 for RH=75% at the surface (Eq.2). The LIRIC 5
“dry” PM10 is lower than the surface in situ measurements, at ~50% of their mean value. For
6
GARRLiC the PM10 profile cannot be calculated, since the corresponding volume concentration
7
profile is a mixture of dust, marine and continental particles with unknown density. 8
Figure 15 shows the backscatter and extinction coefficients retrieved with GARRLiC, LIRIC 9
and Klett methods. GARRLiC and LIRIC agree well within the LIRIC uncertainties (Fig. 15, 10
first and second row). The agreement with Klett retrievals is satisfactory for the backscatter 11
coefficient at 532 and 1064 nm above 550 m, within their uncertainties, with 60-130% 12
differences seen for the 355 nm retrieval (Fig. 15, third row). As for the marine case in section 13
4.2, the NF backscatter coefficient at 532 nm show much larger values. The same holds for the 14
NF extinction coefficient at 532 nm. The Klett extinction coefficients at 1-3 km are up to 60% 15
and 50% lower than GARRLiC at 355 and 532 nm, respectively. 16
Overall, this is a challenging case for both GARRLiC and LIRIC algorithms. We can claim that 17
GARRLiC shows some potential in providing a successful dust and marine microphysical 18
property characterization in case more information (e.g. cross-polarized lidar signal) is included 19
in the retrieval. Moreover, the LIRIC capability of providing the vertical distribution of dust 20
and marine particles is mostly successful, comparing the results with our source-receptor 21
simulations and the surface in situ PM10 measurements. As is the case also for the marine
22
particle characterization in section 4.2, we believe that this retrieval will be greatly benefited 23
from NF measurements. 24
25
4 Summary and Conclusions 26
GARRLiC and LIRIC algorithms provide the great innovation of retrieving the vertical 27
distribution of aerosol microphysics utilizing the synergy of the elastic backscatter lidar and 28
sun-photometer techniques. This way, the algorithms show the potential to effectively 29
characterize the vertical distribution of fine, coarse spherical and coarse non-spherical particle 30
concentrations in the case of LIRIC, and the concentration profiles of fine and coarse particles, 31
along with their column-averaged size, shape and spectral refractive index, in case of 1
GARRLiC. 2
In this study we used both algorithms to characterize three cases of dust and marine presence 3
during the ESA-CHARADMExp experimental campaign. For the first case GARRLiC achieves 4
a successful retrieval of the dust vertical distribution and microphysical characterization that 5
agrees well with AERONET and climatological values for dust. Both LIRIC and GARRLiC 6
concentration profiles are found to be consistent with the BSC DREAM8b dust vertical 7
structure, showing though larger values from the surface in situ PM10 measurements. For the
8
second case consisting of mainly marine particles, both algorithms provide satisfactory 9
concentration retrievals comparing with the surface in situ PM10 measurements. The GARRLiC
10
microphysical property retrieval is mostly not successful for the marine particles. This is due to 11
the difficulties posed by the really low AOD and the insufficient lidar information in the overlap 12
region, where most of the marine aerosol load resides. Last, for the more challenging case of 13
dust and marine mixture, LIRIC provides the dust and marine particle vertical structure due to 14
its capability to retrieve the coarse mode spherical (marine) and non-spherical (dust) 15
components. GARRLiC shows potential in disentangling the marine and dust components, if 16
more information is included in the algorithm input. 17
The difficulties posed in retrieving the concentration profiles and the microphysical properties 18
of dust and marine particle mixtures in the atmospheric column have to do with the low AOD 19
of the marine plumes, the insufficient lidar information in the overlap region and the number of 20
modes considered from the retrievals. For GARRLiC, the retrieval of multiple modes would be 21
possibly feasible in the future with the incorporation of polarimetric measurements from the 22
sun-photometer and/or the cross-polarized and Raman signals from the lidar. Moreover, we 23
could try to increase the near-to-surface information from the lidar, performing the signal gluing 24
technique between the FF and NF measurements. We aim to continue investigating the 25
GARRLiC and LIRIC potential for aerosol characterization and follow related improvements 26
in the framework of the ACTRIS-2 project and the experimental campaigns that are dedicated 27 to that objective. 28 29 30 31
Acknowledgements 1
The research leading to these results has received funding from the European Union’s Horizon 2
2020 Research and Innovation Programme ACTRIS-2 (grant agreement no. 654109). The work 3
has been developed under the auspices of the ESA-ESTEC project “Characterization of Aerosol 4
mixtures of Dust And Marine origin” contract no. IPL-PSO/FF/lf/14.489. The publication was 5
supported by the European Union’s Horizon 2020 Research and Innovation programme under 6
grant agreement No 602014, project ECARS (East European Centre for Atmospheric Remote 7
Sensing). BSC-DREAM8b simulations were performed on the Mare Nostrum supercomputer 8
hosted by the Barcelona Supercomputing Center–Centro Nacional de Supercomputación 9
(BSC). 10
References 1
Althausen, D., Engelmann, R., Baars, H., Heese, B., Ansmann, A., Mueller, D., and Komppula, 2
M.: Portable Raman lidar PollyXT for automated profiling of aerosol backscatter, extinction, 3
and depolarization, Journal of Atmospheric and Oceanic Technology, 26, 2366–2378, 4
10.1175/2009JTECHA1304.1, 2009. 5
Amiridis, V., Kafatos, M., Pérez, C., Kazadzis, S., Gerasopoulos, E., Mamouri, R. E., 6
Papayannis, A., Kokkalis, P., Giannakaki, E., Basart, S., Daglis, I., and Zerefos, C.: The 7
potential of the synergistic use of passive and active remote sensing measurements for the 8
validation of a regional dust model, Ann. Geophys., 27, 3155–3164, doi:10.5194/angeo-27-9
3155-2009, 2009. 10
Amiridis, V., Wandinger, U., Marinou, E., Giannakaki, E., Tsekeri, A., Basart, S., Kazadzis, 11
S., Gkikas, A., Taylor, M., Baldasano, J., and Ansmann, A.: Optimizing Saharan dust 12
CALIPSO retrievals, Atmos. Chem. Phys. Discuss., 13, 14749–14795, doi:10.5194/acpd-13-13
14749-2013, 2013. 14
Ansmann, A., Riebesell, M., and Weitkamp, C.: Measurement of atmospheric aerosol 15
extinction profiles with a Raman lidar, Opt. Lett., 15, 746-748, 1990. 16
Ansmann, A., Tesche, M., Seifert, P., Groß, S., Freudenthaler, V., Apituley, A., Wilson, K. M., 17
Serikov, I., Linné, H., Heinold, B., Hiebsch, A., Schnell, F., Schmidt, J., Mattis, I., Wandinger, 18
U., and Wiegner, M.: Ash and fine-mode particle mass profiles from EARLINET-AERONET 19
observations over central Europe after the eruptions of the Eyjafjallajökull volcano in 2010, J. 20
Geophys. Res. Atmospheres, 116(D20), D00U02, doi:10.1029/2010JD015567, 2011. 21
Ansmann, A., Seifert, P., Tesche, M., and Wandinger, U.: Profiling of fine and coarse particle 22
mass: case studies of Saharan dust and Eyjafjallajökull/Grimsvötn volcanic plumes, Atmos 23
Chem Phys, 12(20), 9399–9415, doi:10.5194/acp-12-9399-2012, 2012. 24
Baars, H., Kanitz, T., Engelmann, R., Althausen, D., Heese, B., Komppula, M., Preißler, J., 25
Tesche, M., Ansmann, A., Wandinger, U., Lim, J.-H., Ahn, J. Y., Stachlewska, I. S., Amiridis, 26
V., Marinou, E., Seifert, P., Hofer, J., Skupin, A., Schneider, F., Bohlmann, S., Foth, A., Bley, 27
S., Pfüller, A., Giannakaki, E., Lihavainen, H., Viisanen, Y., Hooda, R. K., Pereira, S. N., 28
Bortoli, D., Wagner, F., Mattis, I., Janicka, L., Markowicz, K. M., Achtert, P., Artaxo, P., 29
Pauliquevis, T., Souza, R. A. F., Sharma, V. P., van Zyl, P. G., Beukes, J. P., Sun, J., Rohwer, 30
E. G., Deng, R., Mamouri, R.-E., and Zamorano, F.: An overview of the first decade of PollyNET:
an emerging network of automated Raman-polarization lidars for continuous aerosol profiling, 1
Atmos. Chem. Phys., 16, 5111-5137, doi:10.5194/acp-16-5111-2016, 2016. 2
Balis, D., Amiridis, V., Nickovic, S., Papayannis, A., and Zerefos, C.: Optical properties of 3
Saharan dust layers as detected by a Raman lidar at Thessaloniki, Greece, Geophysical 4
Research Letters, 31, L13104, doi:10.1029/2004GL019881, 2004. 5
Basart, S., Pérez García-Pando, C., Cuevas, E., Baldasano Recio, J. M., and Gobbi, P.: Aerosol 6
characterization in Northern Africa, Northeastern Atlantic, Mediterranean basin and Middle 7
East from direct-sun AERONET observations, Atmospheric Chemistry and Physics, 9(21), 8
8265-8282, 2009. 9
Basart, S., Pérez, C., Nickovic, S., Cuevas, E., and Baldasano, J. M.: Development and 10
evaluation of the BSC-DREAM8b dust regional model over Northern Africa, the 11
Mediterranean and the Middle East, Tellus B, 64, 18539, doi:10.3402/tellusb.v64i0.18539, 12
2012a. 13
Basart, S., Pay, M. T., Jorba, O., Pérez, C., Jiménez-Guerrero, P., Schulz, M., and Baldasano, 14
J. M.: Aerosols in the CALIOPE air quality modelling system: evaluation and analysis of PM 15
levels, optical depths and chemical composition over Europe, Atmos. Chem. Phys., 12, 3363– 16
3392, doi:10.5194/acp-12-3363-2012, 2012b. 17
Binietoglou, I., Basart, S., Alados-Arboledas, L., Amiridis, V., Argyrouli, A., Baars, H., 18
Baldasano, J. M., Balis, D., Belegante, L., Bravo-Aranda, J. A., Burlizzi, P., Carrasco, V., 19
Chaikovsky, A., Comerón, A., D'Amico, G., Filioglou, M., Granados-Muñoz, M. J., Guerrero-20
Rascado, J. L., Ilic, L., Kokkalis, P., Maurizi, A., Mona, L., Monti, F., Muñoz-Porcar, C., 21
Nicolae, D., Papayannis, A., Pappalardo, G., Pejanovic, G., Pereira, S. N., Perrone, M. R., 22
Pietruczuk, A., Posyniak, M., Rocadenbosch, F., Rodríguez-Gómez, A., Sicard, M., Siomos, N., 23
Szkop, A., Terradellas, E., Tsekeri, A., Vukovic, A., Wandinger, U., and Wagner, J.: A 24
methodology for investigating dust model performance using synergistic 25
EARLINET/AERONET dust concentration retrievals, Atmos. Meas. Tech., 8, 3577-3600, 26
doi:10.5194/amt-8-3577-2015, 2015. 27
Bezantakos, S., Barmpounis, K., Giamarelou, M., Bossioli, E., Tombrou, M., Mihalopoulos, N., 28
Eleftheriadis, K., Kalogiros, J., D. Allan, J., Bacak, A., Percival, C. J., Coe, H., and Biskos, G.: 29
Chemical composition and hygroscopic properties of aerosol particles over the Aegean Sea, 30
Atmos. Chem. Phys., 13, 11595-11608, doi:10.5194/acp-13-11595-2013, 2013. 31
Bovchaliuk, V., Goloub, P., Podvin, T., Veselovskii, I., Tanre, D., Chaikovsky, A., Dubovik, 1
O., Mortier, A., Lopatin, A., Korenskiy, M., and Victori, S.: Comparison of aerosol properties 2
retrieved using GARRLiC, LIRIC, and Raman algorithms applied to multi-wavelength LIDAR 3
and sun/sky-photometer data, Atmos. Meas. Tech. Discuss., doi:10.5194/amt-2016-40, in 4
review, 2016. 5
Brioude, J., Arnold, D., Stohl, A., Cassiani, M., Morton, D., Seibert, P., Angevine, W., Evan, 6
S., Dingwell, A., Fast, J. D., Easter, R. C., Pisso, I., Burkhart, J., and Wotawa, G.: The 7
Lagrangian particle dispersion model FLEXPART-WRF version 3.1, Geosci. Model Dev., 6, 8
1889-1904, doi:10.5194/gmd-6-1889-2013, 2013. 9
Chaikovsky, A., Dubovik, O., Holben, B., Bril, A., Goloub, P., Tanré, D., Pappalardo, G., 10
Wandinger, U., Chaikovskaya, L., Denisov, S., Grudo, J., Lopatin, A., Karol, Y., Lapyonok, T., 11
Amiridis, V., Ansmann, A., Apituley, A., Allados-Arboledas, L., Binietoglou, I., Boselli, A., 12
D'Amico, G., Freudenthaler, V., Giles, D., Granados-Muñoz, M. J., Kokkalis, P., Nicolae, D., 13
Oshchepkov, S., Papayannis, A., Perrone, M. R., Pietruczuk, A., Rocadenbosch, F., Sicard, M., 14
Slutsker, I., Talianu, C., De Tomasi, F., Tsekeri, A., Wagner, J., and Wang, X.: Lidar-15
Radiometer Inversion Code (LIRIC) for the retrieval of vertical aerosol properties from 16
combined lidar/radiometer data: development and distribution in EARLINET, Atmos. Meas. 17
Tech., 9, 1181-1205, doi:10.5194/amt-9-1181-2016, 2016. 18
Cotton, W. R., Pielke, Sr., R. A., Walko, R. L., Liston, G. E., Tremback, C. J., Jiang, H., 19
McAnelly, R. L., Harrington, J. Y., Nicholls, M. E., Carrio, G. G., and Mc Fadden, J. P.: 20
RAMS 2001: Current status and future directions, Meteorol. Atmos. Phys., 82, 5–29, 2003. 21
Dubovik, O. and King, M: A flexible inversion algorithm for retrieval of aerosol optical 22
properties from Sun and sky radiance measurements, J. Geophys. Res., 105, 20673–20696, 23
doi:10.1029/2000JD900282, 2000a. 24
Dubovik, O., Smirnov, A., Holben, B. N., King, M. D., Y. J. Kaufman, Eck, T. F., and Slutsker, 25
I.: Accuracy assessment of aerosol optical properties retrieval from AERONET sun and sky 26
radiance measurements, J. Geophys. Res., 105, 9791–9806, 2000b. 27
Dubovik, O., Holben, B., Eck, T., Smirnov, A., Kaufman, Y., King, M., Tanré, D., and Slutsker, 28
I.: Variability of absorption and optical properties of key aerosol types observed in worldwide 29
locations, J. Atmos. Sci., 59, 590–608, 2002. 30
Dubovik, O.: Optimization of Numerical Inversion in Photopolarimetric Remote Sensing, in: 1
Photopolarimetry in Remote Sensing, edited by: Videen, G., Yatskiv, Y., and Mishchenko, M., 2
Kluwer Academic Publishers, Dordrecht, the Netherlands, 65–106, 2004. 3
Dubovik, O., Sinyuk, A., Lapyonok, T., Holben, B. N., Mishchenko, M., Yang, P., Eck, T.F., 4
Volten, H., Muñoz, O., Veihelmann, B., van der Zande, W. J., Leon, J. -F., Sorokin, M., and 5
Slutsker, I.: Application of spheroid models to account for aerosol particle nonsphericity in 6
remote sensing of desert dust, J. Geophys. Res., 111, D11208, doi:10.1029/2005JD006619, 7
2006. 8
Dubovik, O., Lapyonok, T., Litvinov, P., Herman, M., Fuertes, D., Ducos, F., Lopatin, A., 9
Chaikovsky, A., Torres, B., Derimian, Y., Huang, X., Aspetsberger, M., and Federspiel, C.: 10
GRASP: a versatile algorithm for characterizing the atmosphere, SPIE: Newsroom, Sep., 2014. 11
Engelmann, R., Kanitz, T., Baars, H., Heese, B., Althausen, D., Skupin, A., Wandinger, U., 12
Komppula, M., Stachlewska, I. S., Amiridis, V., Marinou, E., Mattis, I., Linné, H., and 13
Ansmann, A.: The automated multiwavelength Raman polarization and water-vapor lidar 14
PollyXT: the neXT generation, Atmos. Meas. Tech., 9, 1767-1784,
doi:10.5194/amt-9-1767-15
2016, 2016. 16
Fernald, F. G., Herman, B. M., and Reagan, J. A.: Determination of aerosol height distributions 17
by lidar, J. Appl. Meteorol., 11, 482–489, 1972. 18
Gerasopoulos E., Kouvarakis G., Babasakalis P., Vrekoussis M., Putaud J.P., and Mihalopoulos 19
N.: Origin and variability of particulate matter (PM10) mass concentrations over the Eastern 20
Mediterranean, Atmos. Environ., 40, 4679-4690, 2006. 21
Gobbi, G. P., Angelini, F., Barnaba, F., Costabile, F., Baldasano, J. M., Basart, S., and 22
Bolignano, A.: Changes in particulate matter physical properties during Saharan advections 23
over Rome (Italy): a four-year study, 2001–2004. Atmospheric Chemistry and Physics, 13(15), 24
7395-7404, 2013. 25
Gong, S. L., Barrie, L. A., and Lazare, M.: Canadian Aerosol Module (CAM): a size-segregated 26
simulation of atmospheric aerosol processes for climate and air quality models. 2. Global 27
sea-salt aerosol and its budgets, J. Geophys. Res., 107(D24), 4779, doi:10.1029/2001JD002004, 28
2002. 29
Granados-Muñoz, M. J., Guerrero-Rascado, J. L., Bravo-Aranda, J. A., Navas-Guzmán, F., 1
Valenzuela, A., Lyamani, H., Chaikovsky, A., Wandinger, U., Ansmann, A., Dubovik, O., 2
Grudo, J., and Alados-Arboledas, L.: Retrieving aerosol microphysical properties by Lidar-3
Radiometer Inversion Code (LIRIC) for different aerosol types, J. Geophys. Res., 119, 4
4836–4858, doi:10.1002/2013JD021116, 2014. 5
Granados-Muñoz, M. J., Bravo-Aranda, J. A., Baumgardner, D., Guerrero-Rascado, J. L., 6
Pérez-Ramírez, D., Navas-Guzmán, F., Veselovskii, I., Lyamani, H., Valenzuela, A., Olmo, F. 7
J., Titos, G., Andrey, J., Chaikovsky, A., Dubovik, O., Gil-Ojeda, M., and Alados-Arboledas, 8
L.: Study of aerosol microphysical properties profiles retrieved from ground-based remote 9
sensing and aircraft in-situ measurements during a Saharan dust event, Atmos. Meas. Tech. 10
Discuss., 8, 9289–9338, doi:10.5194/amtd-8-9289-2015, 2015. 11
Granados-Muñoz, M. J., Navas-Guzmán, F., Guerrero-Rascado, J. L., Bravo-Aranda, J. A., 12
Binietoglou, I., Pereira, S. N., Basart, S., Baldasano, J. M., Belegante, L., Chaikovsky, A., 13
Comerón, A., D'Amico, G., Dubovik, O., Ilic, L., Kokkalis, P., Muñoz-Porcar, C., Nickovic, S., 14
Nicolae, D., Olmo, F. J., Papayannis, A., Pappalardo, G., Rodríguez, A., Schepanski, K., Sicard, 15
M., Vukovic, A., Wandinger, U., Dulac, F., and Alados-Arboledas, L.: Profiling of aerosol 16
microphysical properties at several EARLINET/AERONET sites during the July 2012 17
ChArMEx/EMEP campaign, Atmos. Chem. Phys., 16, 7043-7066, doi:10.5194/acp-16-7043-18
2016, 2016. 19
Haustein, K., Pérez, C., Baldasano, J. M., Müller, D., Tesche, M., Schladitz, A., Freudenthaler, 20
V., Heese, B., Esselborn, M., Weinzierl, B., Kandler, K., and von Hoyningen-Huene, W.: 21
Regional dust model performance during SAMUM 2006, Geophys. Res. Lett., 36, L03812, 22
doi:10.1029/2008GL036463, 2009. 23
Ho, S. -p., Peng, L., Anthes, R. A., Kuo, Y. -H., and Lin, H. -C.: Marine Boundary Layer Heights 24
and Their Longitudinal, Diurnal, and Interseasonal Variability in the Southeastern Pacific Using 25
COSMIC, CALIOP, and Radiosonde Data, Journal of Climate, 28, 2856, 2015. 26
Holben, B. N., Eck, T. F., Slutsker, I., Tanre, D., Buis, J. P., Setzer, A., Vermote, E., Reagan, 27
J. A., Kaufman, Y. J., Nakajima, T., Lavenu, F., Jankowiak, I., and Smirnov, A.: AERONET-28
A federated instrument network and data archive for aerosol characterization, Remote Sens. 29
Environ., 66(1), 1–16, doi:10.1016/S0034-4257(98)00031-5, 1998. 30