PAPER • OPEN ACCESS
The optimization of heating temperature for carbon extraction from peat
soil
To cite this article: FahrulRazi Md Jamien et al 2018 IOP Conf. Ser.: Mater. Sci. Eng. 298 012019
View the article online for updates and enhancements.
The optimization of heating temperature for carbon
extraction from peat soil
FahrulRazi Md Jamien1,a, Zaidi Embong1,2,b, Saiful Azhar Ahmad Tajudin1,3,
Salawati Ahmad4, Azwan Mat Lazim5
1
Faculty of Applied Science and Technology, Universiti Tun Hussein Onn Malaysia, Pagoh Education Hub, KM 1 Jalan Panchor, 86400 Muar, Johor, Malayisa
2
Research Centre for Soft Soil (RECESS), Office for Research, Innovation, Commercialization and Consultancy Management (ORICC), Universiti Tun Hussein Onn Malaysia
3
Faculty of Civil and Environment Engineering, Universiti Tun Hussein Onn Malaysia
4
Centre for Language Studies, Universiti Tun Hussein Onn Malaysia 5
School of Chemical Sciences and Food Technology, Universiti Kebangsaan Malaysia
a
Abstract. This study aims to find the optimised heating temperature for carbon extraction from peat soil. Ccarbon from peat soil was extracted by the pyrolisation process at temperature, T = 200, 300, 400, 500, 600 and 700°C for 5 hours. The carbon, C and silica, Si content extracted from peat soil at various heating temperatures were measured by using an Energy Dispersive X-Ray analyzer (EDX) at 3 points on the sample surface. High atomic percentage of carbon (95.44 %) was measured at T = 400°C, while the highest atomic percentage of silicon was recorded at T = 700°C (30.79 %). The surface morphology of peat soil was analysed using Scanning Electron Microscope (SEM) at 800 magnifying power, and it was clearly seen that peat fragments were pyrolised at high heating temperature with pores enhancement. The molecular structure parameter of the extracted carbon were identified using Laser Raman analysis. The peak positions of D-band and G-band for raw peat soil were observed at Raman shift of 1379.62 and 1549.02 cm-1, respectively. Meanwhile, the D-band for peat soil heated at temperature of 400°C was 1391.56 cm-1 whereas the G-band has peak position at 1562.16 cm-1. From the Raman spectra of the optimum heating temperature at 400°C, it was revealed that the carbon molecular structure from the peat soil is mainly attributed by graphite and diamond structure.
1. Introduction
2
chemical reagent such as concentrated acid or alkaline [5]. Activated carbon is very useful in various areas in science, especially in environmental remediation. In order to extract the carbon, peat soil needs to be heated at various temperature. Thus, peat soil can be used as a precursor for the production of activated carbon. Since peat soil has a high amount of carbon content, it is normally composed of a significant amount of graphite-like structure or sp2 dominant depending on the heating procedure in which it consist of high temperature thermal treatment [5] . However, appropriate heating temperature needs to be determined. Thus, the changes of carbon molecular structure in the sample will be observed and the temperature that contributes in extracting the highest content of carbon will be investigated in this study.
2. Methods
2.1 Sample Preparations
In this work, peat soil sample was collected at the depth of 0 – 30 cm from the surface at Parit Nipah Darat, Parit Raja, Johor. In order to prevent cross contamination and to keep moisture of the peat sample, polyethylene bag was used to keep the sample. The soil was then transported to the Research Centre for Soft Soil (RECESS), UTHM. The peat soil was taken out from the polyethylene bag and loaded into a steel loader for drying process.. The drying process was performed in the oven at 110°C for 24 hours. After the drying process, the samples were cooled at room temperature at 28°C. The samples then underwent pulverization with grinding machine and were sieved at 62 micron size particle. The process of sieving is important in order to obtain uniform size particle of samples. The sieved sample was loaded into crucible with lid and then proceed with pyrolisation process. The pyrolisation process undergoes no chemical reagents and an electric furnace was used (WiseTherm Laboratory Instrument) at various temperatures. The baking temperatures used in this study were 200, 300, 400, 500, 600 and 700°C, and the baking process for each temperature were performed within 5 hours period. The pyrolised samples were cooled at room temperature and kept in a dessicator for the next procedure.
2.2 SEM-EDX Analysis
Micrographs of the raw peat soil and pyrolysed peat surface area were acquired by using JEOL JSM-6380LA scanning electron microscope (SEM) facilited with EDX system. The samples were loaded onto carbon adhesive tape, then via into SEM coating system. A thin layer of gold was sputtered on the samples by using Fison Instrument SEM coating system in order to dissipate charge during scanning. The coated samples were then transferred into the specimen stage and viewed under SEM operating with an accelerating voltage of 10kV, and under low pressure at 8 Pa. The elemental analysis of carbon, C and silicon, Si were performed using SEM-EDX Analysis Station software.
2.3 Laser Raman Spectroscopy
Laser Raman spectroscopy was used to determine the molecular structure of pyrolised samples. Potassium bromide, KBr technique with impregnation ratio 1:100 was used to prepare the pellet. The pellet from KBr impregnation was then mounted on the sample stage of the spectroscopy instrument for analysis. The measurement was in the intensity. The analysis was carried out in a wave number range of 250-3000 cm-1. The wavelength and laser spot size were 532nm (green) and ~30μm of diameter. In this research, the laser exposure time for the sample was 15 seconds per sample. The deconvolution of Raman spectra to determine the D-band and G-band were conducted by using a Lorentzian curve-fitting procedure using Origin 8.0 software.
3. Results and Discussions
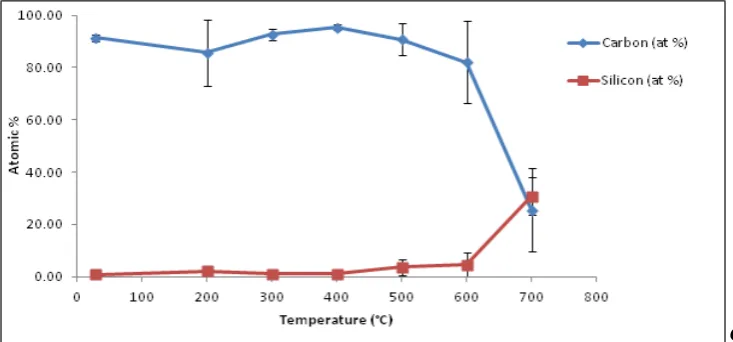
Figure 1 shows the changing of C and Si atomic percentage at various baking temperature. The concentration of carbon was gradually increased from 200°C to 400°C. Further baking at 400°C, exhibits maximum concentration of carbon, C was obtained at 95.44 at %. The maximum percentage of carbon, C was achieved due to the organic ,atter degradation from peat itself within the range of temperatures (optimum pyrolisation) at atmospheric pressure [6] . However, the concentration of carbon, C gradually decreases while the concentration of silicon, Si increases with respect to a higher temperature. At the maximum baking temperature, carbon content in the peat has the lowest atomic percentage for about 25.55 at %. The decline of carbon content at the higher temperature was due to the possible contamination of oxygen from the oven ambient [7] . Carbon content loss beginning at temperature of 500°C to 700°C were due to oxidation of carbon to form carbon dioxide (CO2) and carbon monoxide (CO) [9]. However, carbon content in untreated condition (raw peat) is slightly higher compared to the carbon content at temperature of 200°C (85.69 at % ) with atomic percentage of 91.34 at %. The silicon, Si content in untreated peat has a least concentration for only 0.77 at % compared to other various baking temperature. The concentration of silicon increases with respect to temperature from room temperature (raw peat) to 700°C. At 500°C, silicon concentration shows rapid increase to a higher temperature. At 700°, silicon shows the maximum concentration for about 30.79 at %.
Figure 1. C and Si elemental composition (at%) changes at baking temperature between 200°C to
700°C.
Figure 2 (a-b) shows the morphology structure of the sample from SEM untreated and treated at 400°C baking temperature. Figure 2(a) shows the surface of untreated peat soil that has a rough surface area. This could be from the peat fragments such as wood, bark or overground plant components[10]. However, the morphology of the sample for 400°C treated sample exhibits much fine surface and there is no deposits sticking on its surface. Those peat fragments were distinguished as pyrolised at high baking temperature beginning from 400°C.
4
[image:5.595.89.501.113.277.2](a) (b)
Figure 2. Surface morphology comparison between (a) untreated raw peat and (b) heat treated at
baking temperature, T = 400°C.
3.2 Molecular Structure Analysis for Carbon Compound at Optimum Heating Temperature Using Laser Raman.
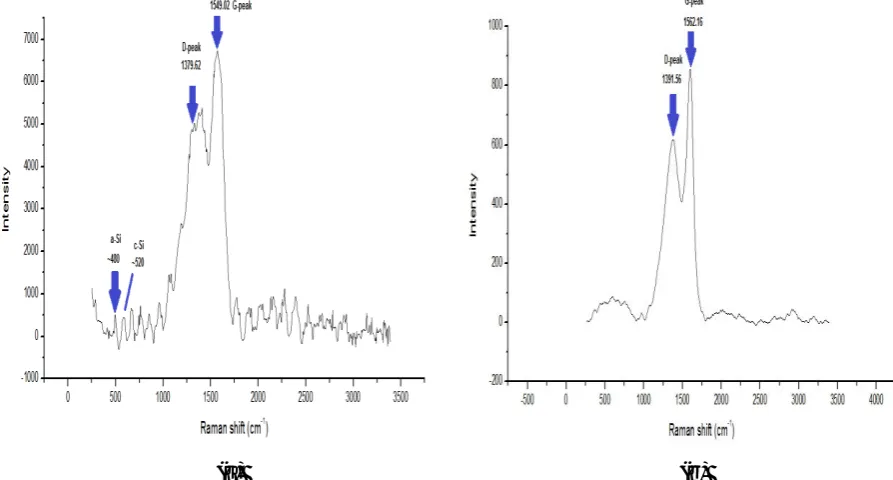
The raw peat and the treated samples at an optimum temperature, 400°C were analysed by using Laser Raman spectroscopy. Laser Raman spectroscopy was used in order to determine the molecular structure of carbon compound for treated sample. Figure 3 shows the Raman spectroscopy for untreated peat soil and heat treated peat at T = 400°C, respectively.
[image:5.595.68.515.422.662.2](a) (b)
Figure 3. Laser Raman spectrum for (a) untreated peat soil and (b) heat treated at baking temperature, T = 400°C
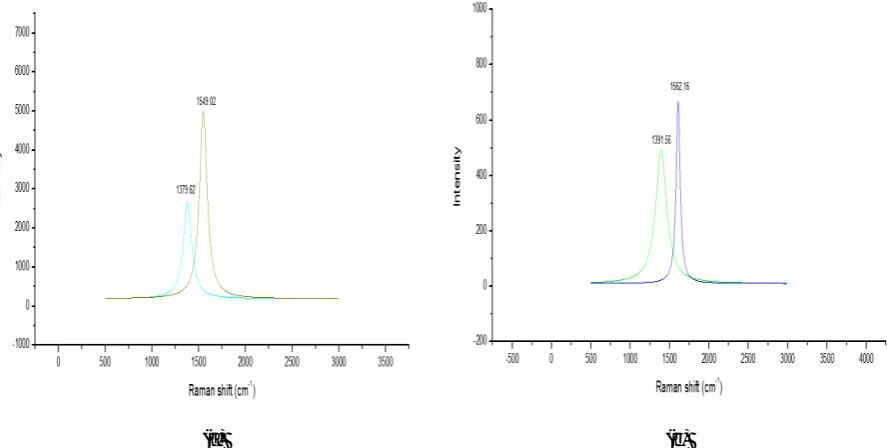
figure 1 which lies on approaching 700°C. Figure 4 shows Laser Raman spectrum deconvolution for untreated peat soil and heat treated at baking temperature 400°C.
(a) (b)
Figure 4. Laser Raman spectrum deconvolution for (a) untreated peat soil and (b) heat treated at baking temperature, T = 400°C.
In figure 4, the baking process affects the position of the Raman spectra is displayed. The spectrum deconvolution needs to perform in order to recover the features of the original spectrum although peaks are broadened. According to Qi Wang et al [11], the spectrum deconvolution is significance to monitor how each Raman shift changes when materials are heated. The D-bands were slightly changed from 1379.62 cm-1 to 1391.56 cm-1. The position of the D-band shifts to a higher wavenumber as the temperature increases. This is due to the changes of structure of carbon materials. The D-bands were broad spectrum indicating that carbon in both spectrums was consistent. But, there was a slight Raman shift observed between both, as shown in figure 4. However, D-band in Raman spectrum on peat at T=400°C was stiffer than the raw peat spectrum as shown at the base of spectrum. The stiffening reduction of band indicates carbon structure were somewhat similar [13]. Diamond-like (sp3) carbon network was identified in both Raman spectra which indicates structure defects [14]. The G-band shows the graphitic structure of carbon organisation. It can also be seen that there are some changes from 1549.02 cm-1 to 1562.16 cm-1. The G-band was also shifted to a higher wavenumber which means, more graphitisation (carbon, C arrangement into graphite formed) after being baked [15]. Graphitic-like (sp2) carbon network exist in both Raman spectrum.
6
4. Conclusion
Carbon, C from peat was extracted from peat. Highest carbon content was obtained at heating temperature of 400°C (95.44 at %). Carbon concentration increases with respect to high thermal energy but begins to decrease at temperature of 500°C, and carbon, C was expected to react with oxygen at high thermal energy forming carbon monoxide (CO) and carbon dioxide (CO2). Silicon obtains the highest concentration at maximum baking temperature of 700°C. Viewing of peat samples via SEM describes the surface morphology and mineral composition, thus verifies the degree of peat decomposition. The result of Raman spectra shows that two structures of graphitic-like (sp2) and diamond-like structure (sp3) were dominant in peat. The structural changes of carbon have been interpreted by the considerable changes of intensity ratio.
5. References
[1 ] Strack M. Peatlands and climate change. University of Calgary; 2008. [2 ] Spedding PJ. Peat. Fuel. 1988 Jul 1; 67(7):883–900
[3 ] Brown P., Gill S., Allen S. Metal removal from wastewater using peat. Elsevier. 2000; 34(16): 3907-3916
[4 ] Uraki Y, Tamai Y, Ogawa M, Gaman S, Tokura S. Preparation of activated carbon from peat. BioResources. 2008; 4(1):205–13
[5 ] Dias JM, Alvim-Ferraz MCM, Almeida MF, Rivera-Utrilla J, Sánchez-Polo M. Waste materials for activated carbon preparation and its use in aqueous-phase treatment: A review. J Environ Manage. 2007; 85(4): 833–846
[6 ] Lazzarini A, Piovano A, Pellegrini R, Agostini G, Rudić S, Lamberti C, et al. Graphitization of Activated Carbons: A Molecular-level Investigation by INS, DRIFT, XRD and Raman Techniques. Phys Procedia. 2016; 85:20–26
[7 ] Petsch ST. Carbon (Organic, Degradation). In Springer Netherlands; 2011. p. 234–238
[8 ] Chung CK, Wu BH. Reaction of carbon and silicon at high temperature deposition. In: 2008 3rd IEEE International Conference on Nano/Micro Engineered and Molecular Systems. IEEE; 2008; 136–139
[9 ] Maahs HG. Oxidation of carbon at high temperatures: or transport control reaction-rate control. Washington.D.C; 1972.
[10 ] Ryedelek P. Application of Scanning Electron Microscope (SEM) in Peat Studies. Polish J Environ Study. 2006;15(5):117–121
[11 ] Lua AC, Yang T, Guo J. Effects of pyrolysis conditions on the properties of activated carbons prepared from pistachio-nut shells. J Anal Appl Pyrolysis. 2004;72(2):279–287
[12 ] Qi Wang D, D.D. A, L.V. K. Deconvolution of the Raman spectrum of amorphous carbon. J Raman Spectrosc. 1995; 26(1):1039–1043
[13 ] Beyssac O. Raman spectra of carbonaceous material in metasediments : a new geothermometer. J Metamorph Geol. 2002; 20(9):859–871
[14 ] Beyssac O, Goffé B, Petitet J-P, Froigneux E, Moreau M, Rouzaud J-N. On the characterization of disordered and heterogeneous carbonaceous materials by Raman spectroscopy.
Spectrochim Acta Part A Mol Biomol Spectrosc. 2003; 59(10):2267–2276
[15 ] Pimenta, Dresselhaus, Dresselhaus, Cancado, Jorio, Saito. Studying disorder in grpahitic-based systems by Raman spectroscopy. Phys Chem. 2007; 9:1276–1291
[16 ] Roh J-S. Structural Study of the Activated Carbon Fiber using Laser Raman Spectroscopy. Carbon Lett. 2008; 9(2):127–30
Acknowledgements