Journal of Chemical and Pharmaceutical Research, 2015, 7(1):168-175
Research Article
ISSN : 0975-7384
CODEN(USA) : JCPRC5
Effects of processing techniques on physicotechnical parameters of
Paracetamol-Diclofenac combination formulation
Musibau A. Mustapha* and Michael U. Uhumwangho
Department of Pharmaceutics and Pharmaceutical Technology, Faculty of Pharmacy, University of Benin, Benin City, Edo State, Nigeria
_____________________________________________________________________________________________
ABSTRACT
Formulation of Paracetamol – Diclofenac combination tablets was designed to incorporate Diclofenac Potassium in 2 ways coded B-I (internally incorporated) and B-E (externally incorporated). Wet granulation technique was adopted and micromeritic properties were evaluated. Granules were compressed to tablets at different compression pressure and the physicotechnical parameters were then evaluated. Results showed a flow rate of ≥ 0.91 g/s, angle of repose of ≤ 15.3⁰, bulk density of 0.57 g/ml, tapped density of 0.70 g/ml, Hausner ratio of ≤ 1.245 and Carr’s index of ≤ 19.69%; all of which engendered excellent micromeritic characteristics. Minimal percentage relative standard deviation (%RSD) of ≤ 3.43 in weight variation, hardness of ≥ 9 Kp were achieved while timely disintegration was corroborated by disintegration time (DT) of 6.65 min in B-I, 3.12 min in B-E, although standard product (STD-P) failed this parameter (22.9 min). Fragmenting behaviours of the formulations resulted in high friability even though hardness/friability ratio of ≥ 6.49 was achieved suggesting that the tablets are mechanically strong. Physicotechnical parameters were better achieved in B-E compared to B-I and STD-P. Influence of increase in compression pressure was more pronounced on friability and hardness and least on DT. Although B-I and B-E consolidated by fragmentation during compaction, B-I seemed to be easier to compress than B-E giving mean yield pressures (Py) of 121.95 and 285.71 Kgfcm-2 respectively. Process capability index (CpK) demonstrated good performance only in DT and hardness and was better in B-I and B-E than STD-P.
Keywords: Analgesia, material attributes, Heckel plot, micromeritic properties, process performance.
_____________________________________________________________________________________________
INTRODUCTION
such CMAs and manufacturing processes must be properly understood to the extent that their effects on the final product are not deleterious [5 – 8]. Indeed, critical process parameters (CPPs) that are of utmost consequences must be identified and their impacts mitigated or controlled so that building quality into the product through different process stages will be assured [6, 9, 10].
The implications of defective and sub-optimal as well as improper articulation and implementation of drug formulation design have been reiterated in previous studies [4, 6, 7]. Knowledge and proper understanding of processing techniques must be brought to bear on combination formulation with a view to deliver quality performance as envisaged. In a situation where all starting materials are fine to crystalline powder, as was the case in this study, it behoves to adopt a process method that convert the starting materials from their inherent gritty characteristics to fluid, free flowing granules. Wet granulation process was chosen because of its versatility and usefulness in today’s pharmaceutical manufacture as recommended by other researchers [4, 6, 7, 11].
This study was put together to develop combination formulation of paracetamol and diclofenac by adopting 2 modes of incorporation (coded B-I and B-E) of diclofenac into the combination. B-I and B-E represent formulations with internally and externally incorporated diclofenac potassium. The 2 formulations were evaluated so as to know and select which one is better and then characterized with a view to elucidate quality profiles of final product that meet the requirements of the dosage form [12, 13]. Characterization indices recommended by other scientists were engaged in this work and included micromeritic parameters at granules stage and physicotechnical features of hardness, friability and disintegration at tablet level [4, 7, 9, 14, 15]. The compaction behaviours of the 2 formulations were also studied to know the effects of processing techniques on them and the final product profiles compared with a standard commercially manufactured tablets of similar strength of 500 / 50 mg of paracetamol / diclofenac potassium [16-18].Process capability index (CpK) was equally determined to know the extent to which the process is able to deliver quality performance in line with specification [19].
EXPERIMENTAL SECTION
2.1 Materials and formulation design
The formulations were designed to compose of pharmaceutical grade, 80.65% Paracetamol powder (Tianjin Co., China); 8.06% Diclofenac Potassium (Amoli Organics, India); 0.4% Microcrystalline cellulose (J. Rotten Maier and Sohnne, Germany); 0.14% Potassium sorbate (Globe chemicals, Germany); 9.95% Maize starch (Royal Ingredients, Holland); 0.32% Sodium lauryl sulfate (Vinamax organics Ltd., India); and 0.48% Magnesium stearate (S Kant Healthcare, India). All these materials were gifts from Edo Pharmaceuticals Ltd, Benin City, Nigeria. De-mineralized (DM) water was also used.
2.2 Preparation of granules
One after the other each material was properly weighed by means of Ohaus Precision weighing balance (Ohaus Corporation, USA) and manually pressed through mesh 1 mm size to remove lumps. Paracetamol, Diclofenac potassium, maize starch, Potassium sorbate were respectively triturated using mortar and pestle. About 52 % of total maize starch component was used to prepare paste in 30 ml boiling DM water for a total of 100 g batch size. Paste was added to mixture and triturated until uniform wet mass was gotten and pressed manually through 3 mm sieve to get uniform wet mass which was spread on tray and dried in oven (Manesty-Mitchell, England) at temperature of 55oC until moisture content of less than 3% as determined using Ohaus moisture analyzer (Ohaus, China) was achieved. Dried granules were pressed through 2 mm mesh to achieve free flowing particles and then added to microcrystalline cellulose, Sodium lauryl sulfate and Magnesium stearate. The mixture was mixed together manually in a nylon bag until homogeneity was achieved. The granules were properly stored for further processing. This was preparation method for formulation B-I while in the case of formulation B-E, Diclofenac potassium was added at dry stage externally together with lubricants.
2.3 Evaluation of granules
2.3.1 Flow rate and angle of repose
______________________________________________________________________________
heights and diameters of the cones were measured and the radii estimated. The angle of repose (θ⁰) was calculated using equation 1.
θ⁰ = Height ÷ Radius X tan-1 ________________1
Measurements were made in triplicate and standard deviation and mean calculated while the process was repeated for all formulations.
2.3.2 Bulk and tapped densities
About 10 g of granules was weighed and carefully poured into a 30 ml graduated measuring cylinder in a slanting position. The cylinder was carefully put upright and volume occupied by the granules was noted. The tapped density was evaluated by tapping the cylinder containing the granules 20 times on hard surface from height of 20 mm and volume was thereafter noted. The measurements were repeated for all the formulations, thrice in each case and mean and standard deviation estimated. Bulk and tapped densities were calculated using Equations 2-3.
Bulk density = Weight of granules (g) ÷ Bulk volume (ml) ______________2
Tapped density = Weight of tapped granules (g) ÷ Tapped volume (ml) ______________3
2.3.3 Carr’s index and Hausner ratio.
Estimation of Hausner ratio and Carr’s index (compressibility index) was carried out using the data from densities measurements. The under listed Equations 4 and 5 were utilized namely:
Hausner ratio = Tapped density ÷ Bulk density ______________4
Carr’s index (%) = Tapped density − Bulk density ÷Tapped density X 100 ______________5
2.4 Tablets preparation
Utilizing manually operated single punch tablet press (Type F-3, Manesty, England), fitted with 12.5mm die, upper and lower punches which are round with flat face and brake score in upper punch, granules were compressed into tablets with compression force set roughly at 5 different points of 25, 30, 35, 40 and 42 Kg. About 20 tablets were compressed at each point and for each formulation, and were properly stored for further evaluations.
2.4.1 Tablets evaluation
During compression of tablets, weight variation was monitored using Ohaus precision balance and only tablets within ± 5% of formulation weight were selected for further assessment. The hardness (crushing strength) of tablets was determined using Monsanto hardness tester (Model Monsanto, India), by singly determine diametral compression force of 5 tablets after storage for more than 24 hours, average and standard deviation of the values were computed. By means of Erweka friability tester (Erweka, Germany), friability of tablets was evaluated. Weight of tablets was determined before the test (Wb), and sample fed into friability tester which was rotated for 100 revolutions at speed of 25 rpm. Tablets were carefully removed, dusted and the weight rechecked after the test (Wa). Percentage friability was calculated as shown in Equation 6 for 3 replicates and mean and standard deviation computed.
% Friability = (Wb – Wa) / Wb X 100 ______________6
Assessment of disintegration time (DT) was carried out using a disintegration apparatus (Manesty, England). One tablet each was put in each of the tubes and hung on the apparatus to which container water has been poured at temperature of 37 ± 1oC. The apparatus was switched on and the time it took each tablet to break into particles smaller enough to pass through predetermined aperture of the mesh was determined. Mean and standard deviation were also estimated.
2.4.2 Evaluation of compaction behaviours of formulations
Tablet density (D) = Weight ÷ πr2h _______________7
Ln [1÷(1-D)] = KP + A _______________8
Adopting Heckel plot derived from equation 8, the relationship between compression force (P) and tablets density (D) was elucidated by plotting the graph of Ln [1÷(1-D)] versus P. Constants “K” and “A” were derived from slope and intercept of the linear portion of the graph respectively. Pharmaceutical properties of disintegration time and weight uniformity, hardness and friability were monitored to see the effects of increase in compression force on these parameters.
2.4.3 Comparison of formulations with standard product (STD-P)
A comparison of physicotechnical parameters of B-I and B-E such as disintegration time, friability, hardness and weight uniformity was done with an approved product of the same model drugs content. Diclopac plus caplet, a National Agency for Food and Drug Administration and Control (NAFDAC) registered product was procured at a local pharmacy in Benin City, Edo state, Nigeria with expiry date of March, 2015, was used as standard product and coded STD-P.
2.5 Computation of process capability index (CpK)
As this study focused on effects of process variable such as mode of incorporation of diclofenac into the formulations during processing, CpK which is a measure of capability of process to deliver within defined specification limits, was engaged to see how physicotechnical properties of final output have been achieved. CpK values of 1 and above are evidences that products from such process are less likely to be out of specification ranges. In fact experts opined that CpK value of 1.33 is equivalent to a 4 sigma level of process performance when using 6 sigma standards [19]. Equations 9-10 stated below were used to estimate the values of CpK.
CpK = X – LSL _______________9
CpK = USL – X _______________10
X is the mean of parameters being calculated, LSL and USL are lower and upper specification limits. Equation 9 is used if X is lower than mean of specification while Equation 10 is used if X is higher than average of specification.
RESULTS AND DISCUSSION
3.1 Pre-compression assessment of granules
______________________________________________________________________________
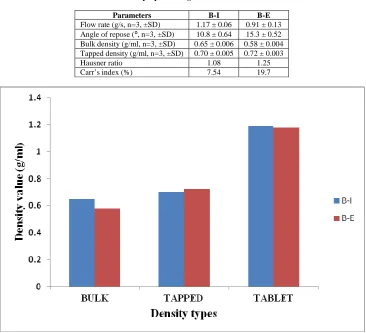
[image:5.595.116.482.145.478.2]density greater than 0.4 g/ml reported in literature to be minimum for granules that will be usable during tableting [7, 22].
Table 1: Flow properties of granules of formulations
Parameters B-I B-E
Flow rate (g/s, n=3, ±SD) 1.17 ± 0.06 0.91 ± 0.13 Angle of repose (⁰, n=3, ±SD) 10.8 ± 0.64 15.3 ± 0.52 Bulk density (g/ml, n=3, ±SD) 0.65 ± 0.006 0.58 ± 0.004 Tapped density (g/ml, n=3, ±SD) 0.70 ± 0.005 0.72 ± 0.003
Hausner ratio 1.08 1.25
Carr’s index (%) 7.54 19.7
Figure 1: Density profiles of formulations B-I and B-E
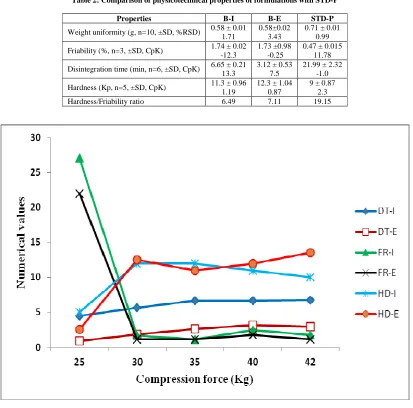
3.2 Post-compression evaluation of tablets of formulations and STD-P
range although it became stabilized as the pressure increases while the influence was marginal on the DT of both formulations as indicated in Figure 2.
Table 2: Comparison of physicotechnical properties of formulations with STD-P
Properties B-I B-E STD-P
Weight uniformity (g, n=10, ±SD, %RSD) 0.58 ± 0.01 1.71
0.58±0.02 3.43
0.71 ± 0.01 0.99
Friability (%, n=3, ±SD, CpK) 1.74 ± 0.02 -12.3 1.73 ±0.98 -0.25 0.47 ± 0.015 11.78
Disintegration time (min, n=6, ±SD, CpK) 6.65 ± 0.21 13.3
3.12 ± 0.53 7.5
21.99 ± 2.32 -1.0
Hardness (Kp, n=5, ±SD, CpK) 11.3 ± 0.96
1.19
12.3 ± 1.04 0.87
9 ± 0.87 2.3
Hardness/Friability ratio 6.49 7.11 19.15
Figure 2: Effects of increase in compression force on physicotechnical properties of DT= disintegration time (min); FR= friability (%); HD= hardness (Kp); I= B-I; E= B-E
3.3 Compaction characteristics of formulations
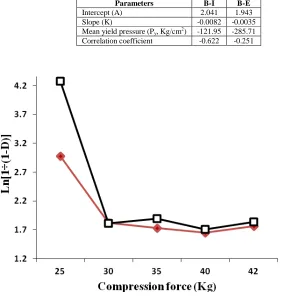
Table 3 contained key indices that characterized compaction behaviours of formulations B-I and B-E. Indices such as mean yield pressure (Py) which is a function of constant “K” (i.e. Py = 1/K) was obtained from the slope of linear portion of Heckel plot and another constant “A”, an intercept was also estimated from the graph. Computation of these parameters showed the extent to which the formulations were easily compressed into tablets. Giving the values of Py of 121.95 and 285.71 Kgfcm-2 respectively for B-I and B-E, it could be inferred that compaction of B-I was
______________________________________________________________________________
both formulations undergone consolidation by fragmentation rather than deformation and this also explained why Py
[image:7.595.129.422.213.516.2]values of both formulations were high [16, 24]. Corroboration for this assertion was provided by the graph in Figure 3 which was typical of multi component formulation that consolidated by fragmentation. At low compression force, the initial part of the graph was curve, characterized by a decline in tablet density due among others, to fragmentation which was followed latter by deformation as compression force is increased. In these multi component formulations B-I and B-E, it seemed compression at higher pressure as shown in the figure led to compaction behaviours that may be complex to interpret.
Table 3: Compaction parameters derived from Heckel plots
Parameters B-I B-E
Intercept (A) 2.041 1.943
Slope (K) -0.0082 -0.0035
Mean yield pressure (Py, Kg/cm2) -121.95 -285.71
Correlation coefficient -0.622 -0.251
Figure 3: Heckel plots of formulations B-I and B-E
3.4 Process capability index (CpK)
Computation and review of CpK which measures ability of a process to consistently deliver good performance showed that some parameters have not been delivered in line with specification limits. For example, except STD-P, the friability had CpK values that are far less than 1 as they ranged from -12.3 to -0.25 for B-I and B-E. Values of this nature are indications of other underlining problems in the formulations which processing cannot control. In this study, the fragmenting nature of the formulations as revealed by compaction behaviours may have been responsible for this high friability. Except the DT of STD-P, other parameters such as DT of B-I and B-E as well as hardness of all formulations including STD-P were reproducibly delivered as shown in Table 2. In general, CpK values greater than 1 is judged by experts as an evidence of a process that can consistently deliver quality performance within the specification limits [19, 26]. Products from such process are less likely to be out of specification ranges while it is important to closely monitor suboptimal process that deliver CpK of less than 1.
CONCLUSION
importance of processing in the development of drug products. The technique of external mode of addition of diclofenac seemed to provide superior quality characteristics much better than STD-P especially DT. Utilization of wet granulation method had resulted in granulates which micromeritic characteristics were excellent enough to give tablets which quality profiles were in line with specifications. Potential problems associated with the formulations were also brought to the fore especially the issue of fragmentation that among others, may have been the reason for high friability. The diverse values of CpK are indications that the process did not deliver good performance in some parameters and must therefore be properly monitored.
Acknowledgements
The authors acknowledged the supports received from management of Edo Pharmaceuticals Ltd, Benin City, Nigeria and are therefore grateful for assistance rendered by supplying the materials used in this study as free gifts.
REFERENCES
[1]P Martelletti, I Farinelli, G Coloprisco, FR Patacchioli. Drug Development Research (2007) 68: 276 -281. [2] Emdex: The complete drug formulary. Lagos, Lindoz Products Ltd (2010/2011).
[3]Martindale: The complete drug reference. Sweetman SC, (Ed). 36th Edition, Vol. 1, London, Pharmaceutical Press, 2009.
[4]MA Mustapha, OA Aluya and JE Ihunde. Int J Pharm Sci Res (2014) 5(3): 964-969.doi: 10.13040/IJPSR.0975-8232.5(3).964-69
[5]MZ Faruki, RE Rishikesh, MA Bhuiyan. Int J Pharm Sci Res (2013) 4(4): 1569-1574. [6] RP Patel, A Suthar. Pharm Tech (2009) 33(8): 53-59.
[7] MA Mustapha, CI Igwilo BO Silva. International Journal of Drug Formulation and Research (2011) 2(5): 320-332.
[8] MA Mustapha. Int J Pharm Sci Res (2013) 4(8): 3171-3174. doi: 10.13040/IJPSR. 0975-8232.4(8).3171-74 [9] V Kannan, R Kandarapu, S Garg. Pharm Tech (2003) 2(1): 74 – 90.
[10] R Seemanchala, KG Bijan, NB Nripendra, CD Harish. Int J App Pharm (2011) 3(3): 20 – 24. [11] MAA Saikh. Int J Pharm Sci Res (2013) 4(1): 55-67.
[12] British Pharmacopoeia, 2008. CD – ROM; Version 12. London. The Stationery Office, 2008
[13] The International Pharmacopoeia, 2008; 4th Edition. CD-ROM. Geneva, WHO Department of Essential Medicines and Pharmaceutical Policies, 2008.
[14] H Hou, CC Sun. J. Pharm. Sci (2008) 97(9): 4030- 4039.
[15] K Vinayagam, K Raghupathi, G Sanjay. Pharm Tech (2003) 1: 74 – 90.
[16] MA Mustapha, CI Igwilo, BO Silva. Medical Journal of Islamic World Academy of Sciences (2013) 21(3): 125-131
[17] BB Muhammed, AB Isah, MA Ibrahim. Nigerian Journal of Pharmaceutical Sciences (2009) 8(1): 80–88. [18] J Ilkka, P Paronen. Prediction of the compression behaviour of powder mixtures by the Heckel equation. International Journal of Pharmaceutics (1993) 94: 181–187. Available at www.sciencedirect.com. Accessed April 17, 2012.
[19] N Weichbrodt, M Camalo. Pharmaceutical Manufacturing, Special report (2012) 3-7
[20] JI Wells, ME Aulton. Preformulation. In: Aulton, ME. (ed), Pharmaceutics- the Science of Dosage Form
Design, Churchill Livingstone, Edinburgh (1993) pp.223-253.
[21] VH Dias, JF Pinto. J. Pharm. Sci. (2002) 19 (1): 273 – 281.
[22] BC Hancock, JT Colvin, MP Mullarney, AV Zinchuk. Pharm. Tech. (2003) 4: 64-80.
[23] C Sun, DJW Grant. Pharmaceutical development and technology (2001) 6(2): 193-200. Available at http://informahealthcare.com/doi/abs/10.1081/PDT-100000738. Accessed April 17, 2012.
[24] OA Odeku, OO Awe, B Popoola, MA Odeniyi, OA Itiola. Pharmaceutical Technology (2005) April issue: 82-90. Available at www.pharmtech.com. Accessed April, 17 2012.
[25] OA Itiola. Pharm World J. (1991) 8(3): 91–94