Procedia Computer Science 42 ( 2014 ) 206 – 213
1877-0509 © 2014 The Authors. Published by Elsevier B.V. This is an open access article under the CC BY-NC-ND license (http://creativecommons.org/licenses/by-nc-nd/3.0/).
Peer-review under responsibility of the Center for Humanoid Robots and Bio-Sensing (HuRoBs) doi: 10.1016/j.procs.2014.11.053
ScienceDirect
International Conference on Robot PRIDE 2013-2014 - Medical and Rehabilitation Robotics and
Instrumentation, ConfPRIDE 2013-2014
Computer Aided System for Red Blood Cell Classification in Blood
Smear Image
Razali Tomari
a,*, Wan Nurshazwani Wan Zakaria
a, Muhammad Mahadi Abdul Jamil
a,
Faridah Mohd Nor
b, Nik Farhan Nik Fuad
baFaculty of Electrical and Electronic Engineering, Universiti un Hussein Onn Malaysia, Parit Raja Batu Pahat 86400,Malaysia, bUKM Medical Centre, Jalan Yaacob Latif, Bandar Tun Razak, Cheras Kuala Lumpur 56000, Malaysia
Abstract
In vitro identification and counting of red blood cells (RBCs) is very important to diagnose blood related diseases such as malaria and anemia before a proper treatment can be proposed. The conventional practice for such procedure is executed manually by pathologist under light microscope. However, manual visual inspection is laborious task and depends on subjective assessment which leads to variation in the RBC identification and counting. In this paper a computer-aided systems is proposed to automate the process of detection and identification of RBC from blood smear image. Initially RBCs region are extracted from the background by using global threshold method applied on green channel color image. Next, noise and holes in the RBCs are
abolished by utilizing morphological filter and connected component labeling. Following that, information from the RBCs’ are
extracted based on its geometrical properties. Eventually, the RBCs were classified as normal/abnormal by using Artificial Neural Network (ANN) classifier. The proposed method has been tested on blood cell images and demonstrates a reliable and effective system for classifying normal and abnormal RBC.
© 2014 The Authors. Published by Elsevier B.V.
Peer-review under responsibility of the Center for Humanoid Robots and Bio-Sensing (HuRoBs).
Keywords:Red blood cell classification, image processing, geometrical properties, neural network.
* Corresponding author. Tel.: +6-07453-7518; fax: +607-453-6060. E-mail address:[email protected]
© 2014 The Authors. Published by Elsevier B.V. This is an open access article under the CC BY-NC-ND license (http://creativecommons.org/licenses/by-nc-nd/3.0/).
1.Introduction
In recent years, there has been an increasing interest in development of various algorithms for automated analysis of medical images in conjunction with advanced artificial intelligent, image processing and computer graphics techniques [1][2]. As consequences, several automatic medical diagnosis systems have been developed to help doctors to diagnose disease particularly in red blood (RBC) and white blood (WBC) cells of human that provides valuable information to pathologists. Red blood cell composition reveals important diagnostic to diagnose patient’s disease and subsequently facilitate doctors to determine an appropriate treatment to the patient. The RBC count analysis is performed to evaluate mean size and shape of the cells. Various diseases such as anemia, leukemia, malnutrition, chronic inflammation, a renal tumor and organs overloaded with iron can be indicated from abnormally high or low counts in blood cells [2][3].Generally, the microscopic-based evaluation was the standard method to perform RBC counting analysis. Despite its long clinical success, this method requires an expertise to manually classify the cells which is tedious, time-consuming and qualitative process [2]. In addition, the existing method contributes to inaccuracy, inconsistency and poor reliability diagnosis that may lead to false diagnosis situation. In order to overcome the problem, an image processing technique is increasingly recognized as a very useful technique for the automated RBC count analysis. The counting technique of microscopic smear image requires three main steps 1) segmentation, 2) features extraction and 3) classification [4][5].
The first segmentation step is very crucial because the accuracy of the subsequent feature extraction and classification steps depend on the correct segmentation of the solitary red blood cells. It is also a difficult and challenging problem due to the complex nature of the cells and uncertainty in microscopic image [1]. In most recent studies, various direct decision methods of segmentation technique have been developed. However, the main weaknesses of these methods lead to difficulties of correction process after a wrong decision has been made. As example in clustering process, the region between RBC, WBC and background is mixing together since both color components are very close to each other. In addition, a wrong clustering and scattering can lead to a similar color pixel between cell and plasma as a background. Consequently, contributing to unclear boundary between them [6][7]. Previous research has identified that the segmentation of blood cell is more exposed to errors in segmenting RBC from cytoplasm region of WBC due to a close color similarity between them in the complex nature of blood cells environment [8]. Thus, it was considered to examine boundary point and conduct a pixel adjustment. However, errors were found to occur in the process of differentiating color pixel in RGB color spaces for color segmentation. A statistical model approach has been successfully demonstrated as the most practical method for segmentation of image that has special boundaries and texture distribution [9].
In order to extract the feature of RBC, a morphological operation such as dilation and erosion were applied. Dilation adds pixels to the boundary of object in the image while erosion removes the pixels of boundary [10][11]. Morphological operators also include a few steps, which are filling holes, area calculation, template calculation, opening, closing, and reconstruction. Mathematical morphological operators used to segment RBC by eliminating WBC appearance [12][13]. It is used for extracting image components and useful in representing or describing the region of shape such as boundary, skeleton and texture [14].
The RBC classification can be generally formulated as pattern recognition problem. Several studies have reported that neural network method as an effective classifier than statistical pattern classification methods [1][15][16]. A variety of different neural network techniques are used to classify RBC. For instance, a moving back-propagation neural network (MBPN) technique is used to optimize the architecture of NN classifier [17]. There was a significant classification efficiency of 80% and 60% for normal and abnormal cell respectively. Its good reputation makes it one of the widely used classifier for RBC classification systems.
In this paper we propose a computer aided system for automatically detect, classify and counting normal and abnormal red blood cell (RBC) in blood smear image. The rest of the paper is organized as follows: Section 2 presents the architecture of the proposed system; Next, Section 3 shows experimental results with discussion; and finally, the conclusions and future research are presented in Section 4.
2.System Overview
captured RGB image is converted into a single component colour representation to make it convenient for the next processing. Next, the foreground is distinguished from the background by using adaptive global threshold method follow by low-level image post-processing methods in order to create a solid and noise-free foreground pixel map. Later, the connected regions of the foreground map are grouped together to identify overlapping and non-overlapping region before extracting individual object features such as moment values, area and perimeter. The object classification algorithm makes use of the extracted information before being used for training and testing session. For this project an Artificial Neural Network (ANN) classifier is implemented. Towards the end, the performances and accuracy of this classification method are evaluated.
2.1.Image acquisition
The images are acquired from light microscope that equipped with DinoEye Eyepiece Camera as shown in Fig. 1 (b), and the process of capturing the image will involve blood smear process to the prepared sample. Blood smear is a process of preparation blood specimen on the slide that observed under microscope. The process for displaying the RBC image will involve digitization of image from the optical image with 40 times (40X) objective which equal to approximately 400 magnification.
Fig. 1 : (a) Method Pipeline (b) Image Acquisition Equipment
2.2.Color Space Reduction
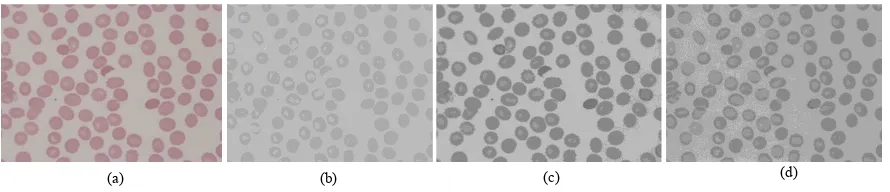
[image:3.544.70.481.258.382.2]For the red blood cell classification, the shape of objects plays an important role and colour information only gives small effect. Because of that, the RGB image is transformed into a single channel colour representation for an efficient computation of a look-up table. In this project, the individual component of red, green and blue channel is investigated to determine an optimal colour channel to distinguish between red blood cell and the background
Fig. 2: Color component selection. (a) RGB image (b) Red color component (c) Green color component (d) Blue color component Light Microscope
Camera Computer
(a) (b)
(a) (b) (c) (d)
Image acquisition using Light Microscope
Colour Space Reduction
Post Processing
Feature Extraction Normal/abnormal RBC classification and counting
[image:3.544.50.495.500.596.2]Fig. 2 shows sample of the results where (a) is the RGB image and (b), (c) and (d) indicate the corresponding component of red, green and blue in the RGB image. It can be seen that, the red colour component unable to precisely distinguish between the RBC and the background while the green and channel able to produce a better result. However, among the green and blue channel, qualitatively the green component gives the best contrast (appear darker) between the RBC and the background, and hence was selected for segmenting the RBC in the next section.
2.3.RBC Segmentation and Post Processing
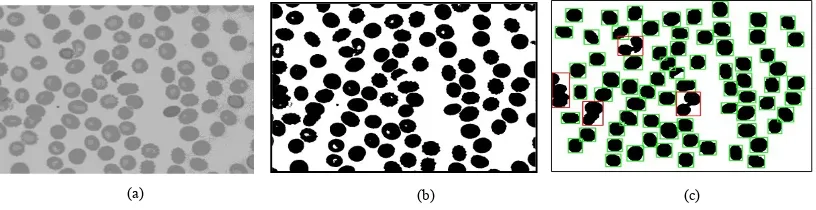
The image segmentation process is mainly implemented to partition an image into a region of homogenous representation corresponds to the object of interest in the image. Overall performance of an automated RBC classification system is considerably depends on its ability to segment the RBC region in the observed image accurately. A subsequent action, such as analyzing or identifying objects, requires an accurate extraction of the foreground objects, making the image segmentation a crucial part of the system. In this paper, an Otsu adaptive threshold strategy [18] is applied in the green channel of the RBC image to separating between two classes of region. This method works by finding threshold value that minimizes the weighted within class variance. Sample of the produced binary image as a result of Otsu segmentation process of green channel image (Fig. 3 (a)) is shown in Fig. 3 (b). It can be seen that, even though the attained image capable to detect the RBC region, there are noise, holes and cell in border exist. To overcome such problems, a series of post processing method is applied.
Fig. 3: (a) Green channel image (b) Segmentation using Otsu Method (c) Result after series of post-processing operation
The main purpose for applying the post processing is to remove noise and unwanted foreground cell from the segmented image. This process is crucial since the noise can significantly affect system ability to identify and classify the extracted object accurately. In this paper, we use three methods which are morphological operation, connected component labelling (CCL) and bounding box filter to remove the unnecessary items.
Morphological operation works on binary image to change the size, shape, structure and connectivity of objects by using a structuring element and a set operator define by Erosion and Dilation. Erosion plays the role to ‘shrinks’ and ‘thins’ objects in image while dilation used to ‘grows’ and ‘thickens’ objects in image. The combination of both operators can be use to removes, break connection, clearing border and filling up holes. In this project, a sequence of two times of Erosion, two times of Dilation and contour filling algorithm is used to diminish the small noise and holes inside the cell. Once such cells are in hand, the object candidates are labelled via connected component labelling (CCL). The bounding boxes indicate the minimum and maximum rectangular cell location in the image. Since cell object in the border does not provide valuable information, it was removed by detecting minimum and maximum x and y bounding box locations that touch the image boundary. Eventually, the overlap cell is identified by calculating cell area that significantly large with respect to the normal cell. Fig. 3 (c) shows result after performing the mentioned process. The overlapping cell will be marked while the remaining will be processed further to extract valuable information for classification purpose.
[image:4.544.68.476.281.386.2]2.4.Feature Extraction
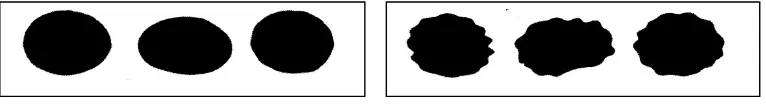
The recognition of objects from imagery may be accomplished for many applications by identifying an unknown object as a member of a set of well-known objects. Such characterizations are typically defined by measuring object features extracted from various imagery types. The ability of an object features technique to uniquely represent the object uniquely from the available information determines the effectiveness of the recognition task. In this project, the object information is extracted from a sample of normal/abnormal cell shown in Fig. 4 by relying on the object’s geometrical features which are compactness and moment invariant.
[image:5.544.80.463.157.209.2]
Fig. 4: Sample of normal RBC image in the left side and abnormal RBC in the right side
Compactness is a common shape measurement technique based on the information from the perimeter (L) and area (A). The compactness provides information about how the object is form in term of the smoothness circle shape. When the compact value become higher, it shows that the object’s shapes is more complex. Such property is really useful to distinguish between the normal and abnormal cell since for our case the abnormal cell shape is quite complex compare to the normal cell. However relying on a compactness value alone is not enough since when cell shape becomes more oval, the compactness value become higher even though the shape is not complex. Because of that, a second feature information is extracted which is moment invariant values.
Formerly, moment method has been used in the analysis and recognition of object shape. One advantage suggested by moment method is that they can easily, equipped to be invariant in 2D transformation such as translation, rotation, reflection and scaling. This property is very convenient since such transformations are very common for RBCs in blood smeared images. Furthermore, because the invariant do not provide any or less information than the original moment values, the features that might be require for classification is reduced, and thus decrease the complexity of the learning problem. For this project, we use seven HU moment features [19] to represent the RBC shape.
2.5.RBC Classification
In order to be able to discriminate between normal and abnormal RBC in the image by using the selected features, a robust classifier should be used. The classification module is performed by using artificial neural network (ANN) classifier. The ANNs are a mathematical approximation of a biological brain, and have been identified as a useful framework for precise modelling of nonlinear response. It comprises a number of neurons connected together to form a network. The weights that linked between the neurons, i.e. Wij and Wjk are where the functionality of the network resides.
Before the network can be useful, it needs to be trained. Basically the training session will alter the weights so that the error between the inputs and targets can be minimized. One of the fastest training approaches is Levenberg Marquardt algorithm with mean square error (MSE) cost function. Here we feed the data from the RBC features, i.e. [compactness and seven HU moments invariant], to the input neurons, and normal/abnormal RBC type to the targets neuron during the training process. The networks setting is consider optimal for the highest recognition rate in both training and validation set.
3.Experimental Results
In this section, the performance of proposed RBC classification system is evaluated for recognizing the RBC cell type obtained from the smear blood image. The system is tested in four samples of blood cell image obtained from the light microscope. Initially we assess the ANN performance.
set (VDs), the optimal ANN structure is configured. We tuned it across a number of hidden nodes (HN) selection, with two different activation functions which are sigmoid(S) and tangent sigmoid (T). Table 1 summarizes our results. It can be seen that, the highest performance for training the TDs and VDs is 100 percent and it was achieved with ANN configuration of four (2L-4S-S) and six (2L-6S-S) hidden nodes when using sigmoid activation function. When using the tangent sigmoid the performance for VDs deteriorate significantly as the number of hidden node increased. Since lower hidden nodes means the less computation complexity, the setting of 2L-4S-S was selected as the optimal networks for classifying the normal and abnormal RBC.
Table 1. Neural network performance when simulate with training dataset (TDs) and validation dataset (VD)
Sigmoid Activation function Tangent Sigmoid Activation function
HN 2 3 4 5 6 7 8 9 2 3 4 5 6 7 8 9
TDs 96 100 100 100 100 100 100 100 96 96 100 100 100 100 100 100
VDs 100 90 100 90 100 90 81 81 81 100 63 54 54 36 36 36
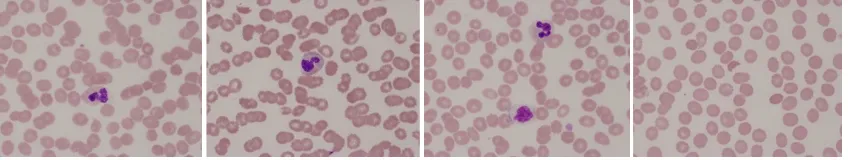
Next, we present an experiment conducted for assessing the RBC classification system performance. The system was developed using Microsoft Visual Studio with OpenCV 2.4.7 and runs on 2.4 GHz i5-450M processor. We measured the performance on four different blood cell images labelled im_1, im_2, im_3, and im_4 as shown in Fig. 5 based on the ability to correctly identify and count the number of normal RBC cell and abnormal RBC cell. For each of the classes, the quantitative measurement is performed based on True Positive (TP), False Positive (FP), True Negative (TN), and False Negative parameters. Eventually the precision, recall, and accuracy are calculated by using equation (1). Precision provides information about how many of the detected fraction cells are correct, and recall tells how many cells are correctly detected in each class from the whole image. The accuracy on the other hand, gives evaluation about how well the overall system performance with respect to the ground truth data.
FP TP
TP ecision
Pr ;
FN TP
TP call
Re ;
FN TN FP TP
TN TP Accuracy
(1)
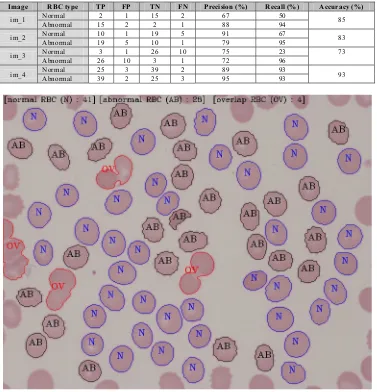
[image:6.544.61.485.507.587.2]Table 2 summarizes our results. Overall the proposed method performs quite well with an average accuracy of 83%, 82% of average normal precision and 76% of average recall. This means that most of the object classes are correctly identified with an acceptable error rate. It also can be seen that the system provide a good detection result for the abnormal RBC detection compare to the normal one. This is due to the fact that the complexity of the abnormal RBC boundary is quite significant and easy to distinguish. On the other hand, the normal RBC is usually misidentified because of the imperfect in segmentation and post processing process. In the meantime, images im_1 and im_3 gave the lowest performance in term of recall rate with 50% and 23% respectively. The main reason for the lower recall rate is that the acquired images are quite blurred and hence it is quite confusing to distinguish between both cells. Such problem can be improve later on by carefully tune the microscope reading. Sample result of the proposed method during performing the testing is shown in Fig.6. The identified RBCs clusters were overlaid on its corresponding original image. As can be seen, the system capable to labelled the location of overlapping cell, normal RBC and abnormal and give a total number of such cells found in the image. The results show a promising outcome of the proposed system for completing its task in the captured images.
Table 2. Result for identifying and count the number of normal and abnormal RBC
Image RBC type TP FP TN FN Precision (%) Recall (%) Accuracy (%)
im_1 Normal 2 1 15 2 67 50 85
Abnormal 15 2 2 1 88 94
im_2 Normal 10 1 19 5 91 67 83
Abnormal 19 5 10 1 79 95
im_3 Normal 3 1 26 10 75 23 73
Abnormal 26 10 3 1 72 96
im_4 Normal Abnormal 25 39 3 2 39 25 2 3 89 95 93 93 93
Fig. 6. Examples system result for identifying and counting overlapping cell, normal RBC and abnormal RBC
4.Conclusion
Acceptable complexity when using four hidden nodes with sigmoid activation. The framework was tested to classify the RBC in blood cell images, and the results are encouraging with an average of 83% accuracy, 82% average precision and 76% average recall.
In future, the system can be improved by recognizing and counting the number of cells in the overlap region. It can be done by using marker based watershed segmentation with distance transform. We also plan to evaluate the system with more sample sets to determine the generality of the proposed framework.
Acknowledgements
The authors would like to thank to Ministry of Education (MOE) and Universiti Tun Hussein onn Malaysia (UTHM) for supporting this research under Research Acculturation Collaborative Effort (Vot. no. 1448).
References
1. Kim, K., et al., Automatic Cell Classification in Human’s Peripheral Blood Images Based on Morphological Image Processing, in AI 2001:
Advances in Artificial Intelligence, M. Stumptner, D. Corbett, and M. Brooks, Editors. 2001, Springer Berlin Heidelberg. p. 225-236. 2. Venkatalakshmi, B. and K. Thilagavathi. Automatic red blood cell counting using Hough transform., 2013 IEEE Conference on Information
& Communication Technologies (ICT). 2013.
3. Bunn HF. Approach to the anemias. In: Goldman L, Schafer AI, eds. Cecil Medicine. 24th ed. Philadelphia, Pa: Saunders Elsevier; 2011:chap 161.
4. Habibzadeh, M., A. Krzyżak, and T. Fevens, Comparative study of shape, intensity and texture features and support vector machine for white blood cell classification. Journal of Theoretical and Applied Computer Science, 2013. 7(1): p. 20-35.
5. E. A. Mohammed, M. M. Mohamed, B. H. Far, and C. Naugler, "Peripheral blood smear image analysis: A comprehensive review," Journal of pathology informatics, vol. 5, 2014.
6. K. P. Rane, G. D. Zope, and A. Rane, "Blood Cell Segmentation–A Review," International Journal of Advanced Electronics and Communication Systems, 2014.
7. S. Chinwaraphat, A. Sanpanich, C. Pintavirooj, M. Sangworasil, and P. Tosranon, "A modified fuzzy clustering for white blood cell segmentation," in 3rd International Symposium On Biomedical Engineering, 2008, pp. 356-359.
8. S. S. Poon, R. K. Ward, and B. Palcic, "Automated image detection and segmentation in blood smears," Cytometry, vol. 13, pp. 766-774, 1992.
9. C. Rongtai, W. QingXiang, Z. Rui, F. Lijuan, and R. Chengmei, "Red blood cell segmentation using Active Appearance Model," in Signal Processing (ICSP), 2012 IEEE 11th International Conference on, 2012, pp. 1641-1644.
10.M. Hamghalam and A. Ayatollahi, "Automatic counting of leukocytes in giemsa-stained images of peripheral blood smear," in Digital Image Processing, 2009 International Conference on, 2009, pp. 13-16.
11.J. Angulo and G. Flandrin, "Automated detection of working area of peripheral blood smears using mathematical morphology," Analytical cellular pathology, vol. 25, pp. 37-49, 2003.
12.J. M. Sharif, M. Miswan, M. Ngadi, M. S. H. Salam, and M. Mahadi bin Abdul Jamil, "Red blood cell segmentation using masking and watershed algorithm: A preliminary study," in Biomedical Engineering (ICoBE), 2012 International Conference on, 2012, pp. 258-262. 13.S. S. Adagale and S. S. Pawar, "Image segmentation using PCNN and template matching for blood cell counting," in Computational
Intelligence and Computing Research (ICCIC), 2013 IEEE International Conference on, 2013, pp. 1-5.
14.C. Di Rubeto, A. Dempster, S. Khan, and B. Jarra, "Segmentation of blood images using morphological operators," in Pattern Recognition, 2000. Proceedings. 15th International Conference on, 2000, pp. 397-400 vol.3.
15.A. Hamouda, A. Y. Khedr, and R. A. Ramadan, "Automated red blood cell counting," Int. J. Comput. Sci, vol. 1, 2012. 16.N. D. Jambhekar, "Red blood cells classification using image processing," Science Research Reporter, vol. 1, pp. 151-154, 2011.
17.M. Veluchamy, K. Perumal, and T. Ponuchamy, "Feature extraction and classification of blood cells using artificial neural network," American Journal of Applied Sciences, vol. 9, p. 615, 201
18. N. Otsu, “A Threshold Selection Method from Grat-Level Histograms”, IEEE Transaction on System, Man and Cybernetics, vol. 9(1), pp. 62-66, 1979.