Drivers Lane Changing Behaviour at Urban Intersection by Using Gap
Acceptance Approach
Mohd Erwan Sanik
1,2,a *,
Joewono Prasetijo
2,b,
Fajaruddin Mustakim
2,c, Nor
Baizura Hamid
1,2,d, Ahmad Hakimi Mat Nor
1,eand Mohd Safberi Che Ani
2,f1
Centre for Diploma Studies, Universiti Tun Hussein Onn Malaysia, 86400 Parit Raja, Johor, Malaysia
2
Smart Driving Research Centre, Faculty of Civil and Environmental Engineering, Universiti Tun Hussein Onn Malaysia, 86400 Parit Raja, Johor, Malaysia
a
[email protected], [email protected], [email protected],
d
[email protected], [email protected], [email protected]
Keywords: critical gap, gap acceptance, lane changing, maximum likelihood method
Abstract. A lane changing event can be defined as a purposeful and considerable move in the
sideways position of a vehicle on a carriageway. This paper discusses driver's lane changing behaviour at urban signalized intersections with respect to critical gap analysis. The objectives of this study are to determine the lane changing factors with regards to the vehicle and geometrical characteristics as well as to determine critical gap of drivers whom change lane. This study were carried out at study locations which lane changing activities are identified as a frequent event due to presence of trap lanes and also due to drivers tendency to seek for shortest queue’s lane. In this study, the maximum likelihood method is used to determine critical gap. Based on the observation, the main factor which influences lane changing event is the flow rate of vehicle movements. Other factors that might as well influence are lane width of the roadway and traffic composition. The critical gap values are varying from 2.4 to 2.7 seconds which generally shows the aggressive behaviour of drivers. Aggressive driving behaviour may contribute to road accident and therefore with the findings in this study, responsible authority should consider a proper road safety intervention as accident mitigation measure.
Introduction
Lane changing activity is a common phenomenon committed by drivers on the road. A lane change can be defined as a purposeful and considerable move in the sideways position of a vehicle. Lane changes can occur for a variety of reasons, such as entering the roadway, preparing to exit the roadway, anticipating vehicles merging onto the roadway, anticipating a slowing lead vehicle, a change in the number of lanes available, and many more. Of the most common types of lane change is a manoeuvre in which a driver changes lanes to pass a slower lead vehicle to maintain the current speed [1, 2].
The decision-making process in lane change is very complicated to be studied because it depends on the nature of a driver and diversity of factors that motivate drivers. Careless in lane changing was listed in 10th out of 25 driver’s behaviour ranking as the cause of the accident happened in highway [3]. Amiruddin [4] states that many drivers change to the shortest queue lane at the start of red at a signalised intersection. This study will be carried out at study locations which lane changing activities are identified as a frequent event due to presence of trap lanes as well as drivers seek for lane with the shortest queue. Lane change can be studied using capacity approach such as gap acceptance in order to determine the critical gap used by local drivers. The value of critical gap shall justify the level of aggressiveness of the drivers. Therefore, this study is focused on investigation of lane changing activity at selected urban intersections by using the gap acceptance approach.
vehicle and geometry and to determine critical gap of drivers when changing the lane. This study was carried out at Jalan Kluang - Jalan Tan Swee Hoe and Jalan Kluang - Jalan Bakau Condong intersections. The study periods are during the morning and evening rush hours. Videotaping method was used to record the lane changing behaviour at study locations. The accepted gap and rejected gap values were then retrieved from the video and analysed using the maximum likelihood method.
Related Works
Lane change
A lane change has been defined as a deliberate and substantial shift in the lateral position of a vehicle described a lane change in three parts: the head portion is the time and distance required for a vehicle to move from a straight-ahead path to the first intercept of the lane line. The actual lane change starts when a vehicle first encroaches on the lane line between the current and adjacent lanes. The manoeuvre ends once the vehicle has completely crossed that line. The tail portion of the manoeuvre is the time and distance required for a vehicle to return to a straight-ahead path in the destination lane after crossing the lane line. Another view [5] describes three sequential phases of the lane-change manoeuvre based on steering. The first phase is an initial turn of the steering wheel to maximum angle. The second phase begins when the steering wheel is turned in the opposite direction and ends when the vehicle heading approaches a maximum that occurs when the steering wheel angle passes through zero (straight-ahead). During the third phase, the steering wheel is turned to a maximum angle in the opposite direction to stabilize the vehicle in the new lane. This definition is useful when only steering data is available. However, lane changes performed in curves may not be captured if the driver does not reverse the angle of the steering wheel. Consideration for road geometry is also required to operationally define a lane change.
Gap Acceptance Concepts
A driver entering into or going across a traffic stream must evaluate the space between a potentially conflicting vehicle and itself and decide whether to cross or enter or not [6]. “Gap” means the time and space that a subject vehicle needs to merge adequately safely between two vehicles. Gap acceptance is the minimum gap required to finish lane changing safely. Gap acceptance is also an important element in most lane changing modes [7]. Therefore, a gap acceptance model can help describe how a driver judges whether to accept or not. The general assumption is that drivers consider only the adjacent gap that is headway between a lead vehicle and a lag vehicle over the object lane to which it wishes to change to. In the case of a merge into an adjacent lane, if the driver can accept both lead headway and lag headway, the gap is accepted and the lane change is accomplished [8]. “Rejected gap” is the time interval that subject vehicle fails to enter a main lane due to the main lane’s vehicle obstacle flow. “Maximum rejected gap” is the largest rejected gap in the middle of the reject gaps of the individual vehicles. The accept gap is the time interval for a subject vehicle in the current lane to enter the traffic stream on the main lane without main lane’s vehicle obstacle flow. Therefore, it is possible to measure an individual vehicle’s accepting gap and rejecting gap of a vehicle can be measured realistically, but it is possible to measure its critical gap. The critical gap can be estimated, however, as more than the maximum reject gap and equal to or less than the minimum accept gap.
Critical Gap
stream have enough space or time for vehicles from the minor flow interrupted in the middle of the two vehicles is called the tc seconds. Hence the value of tc is also the critical gap, which means the
minimum time interval in which the driver preference flows at the minor road ready for the majors entering the conflict area. Meanwhile, according to the United States Highway Capacity Manual 2000 (U.S. HCM 2000) [10], the critical gap, tc is defined as the minimum time specified in the
major stream that allows vehicles to enter or exit into or from the minor flow, respectively, then the smallest value will be considered. Drivers in particular, will push the value gap is smaller than the critical gap and accept value greater than or equal to the critical gap. The main principle in estimating the value of a critical gap was based on the observation of the rejected gap of critical gap and small accepted gap of an intersection [10]. In this study, however, the critical gap is defined as the minimum gap that accepted by all drivers to maneuver from the origin to the desired lanes.
Maximum Likelihood Method
Since critical gap could not be observed directly from field, the gap acceptance data which consist of the accepted gap and the largest rejected gap were measured and analysed using the maximum likelihood method [11]. The effectiveness of the maximum likelihood method has been evaluated in further studies by Brilon [9] and Troutbeck [12]. The maximum likelihood technique can reliabily reproduce the real critical gap of driver population without depending on external parameters. The procedure as proposed by Troutbeck [12] can be used to estimate the critical gap under traffic conditions that are not necessarily oversaturated.
The maximum likelihood method of estimating the critical gap distribution is based on the fact that a driver critical gap is greater than his or her largest rejected gap and smaller than his or her accepted gap. The first step is to assume a probabilistic distribution for the critical gaps. For most cases this can be assumed to be log-normal. This distribution is skewed to the right and has non-negative values, as would be expected in these circumstances. The distribution is reasonably general and is acceptable for most studies. First, a function F, which represents the distribution of the critical gaps, is assumed in applying the maximum likelihood method. A log-normal function is proposed for this purpose by other research. The likelihood function is defined as the probability that the critical gap distribution lies between the observed distribution of the largest rejected gaps and accepted gaps as shown by Eq. 1.
(1) Where,
L = maximum likelihood function
yi = logarithm of the accepted gap of driver i
xi = logarithm of the largest rejected gap of driver
F (..) = cumulative distribution function for normal distribution
By maximizing this equation, mean (µ) and variance (σ) of the gap acceptance distribution are estimated. In this way, the distribution of critical gaps as well as their mean and variance can be derived. The critical gap and the mean of the gap acceptance distribution are related in the case where the gap acceptance distribution is normal distribution. The relationship to estimate critical gap is given by Eq. 2 and q is the flow of vehicles in both directions on the major road.
2
2
q
tc =µ−σ − (2)
tc = critical gap
µ = median σ 2
= variance
q = volume in major road (veh/sec)
Methodology
Data collection method
The videotaping method is used in data collection. The video is used to observe overall behavior of drivers as well as to measure gap in order to estimate critical gap. The video recorder was placed in a high point of view the studied segment and zoomed in to capture the movement of each vehicle within the lane changing section.
At each site, four hours of data were collected during rush hour. This study period consist of two hours in morning and evening rush hours. Accuracy in video data is mainly due to the fact that the researcher is viewing the recorded video more than one time. Therefore, the researcher can concentrate on a single movement and then rewinding the tape to recheck data when finished.
Method of data analysis
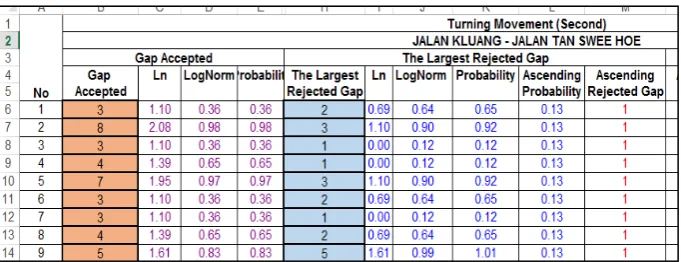
[image:4.595.122.463.383.514.2]Two important parameters need to be extracted from the recorded video are the accepted gap and rejected gap. Video is played repeatedly to obtain the necessary data. Fig. 1 shows an example of data that was extracted from the video and analyzed using maximum likelihood method.
Figure 1: Example of accepted gap and rejected gap data that went through maximum likelihood method analysis
Calculation of the Critical Gap
There are several factors that should be taken into consideration in determining the critical gap which are the number of vehicles on adjacent flow, intersection geometry and the nature of the owner driver in determining safe to come out and in the intersection or make way for other drivers to get in and out intersection. All these factors will have an impact, indirectly, to the critical gap and make the assumption that the accepted gap is still critical of each driver may vary according to the type of vehicle. The value of critical gap is between the largest gaps of less critical and the smallest gap received critically [13]. However in this study, the analysis was carried out only for passenger car due to lack of data for other classes of vehicle. The extracted data were then analyzed using the maximum likelihood method.
Vehicle Composition
Fig. 2 and 3 show the composition of through traffic flow at studied segment of Jalan Kluang – Jalan Bakau Chondong and Jalan Kluang – Jalan Tan Swee Hoe intersections, respectively.
[image:5.595.172.425.135.259.2][image:5.595.171.428.299.426.2]
Figure 2: Percentage of Vehicle at Jalan Kluang - Jalan Bakau Condong Intersection
Figure 3: Percentage of Vehicle at Jalan Kluang – Jalan Tan Swee Hoe Intersection
Classes 1 to 3 are light vehicles while class 4 refers to heavy vehicles such as trucks and buses. Light vehicles in class 1, 2 and 3 can be referred to motorcycle, passenger car and vehicle such as vans, small Lorries and MPVs, respectively. Referring to those figures, light vehicles show the highest percentage of the vehicles volume for both intersections.
Traffic Volume at Adjacent Lanes
Traffic movements at Jalan Kluang – Jalan Tan Swee Hoe and Jalan Kluang – Jalan Bakau Condong intersections were recorded for four hours during rush hour, from 7.00 – 9.00 a.m and 5.00 – 7.00 p.m. Traffic volume data of major stream were collected and recorded in Table 1. Table 1 shows that volume of vehicle in major road during four hours for the both intersections.
Table 1: Volume of traffic at adjacent lanes
Intersection Jalan Kluang – Jalan Tan Swee
Hoe Jalan Kluang – Jalan Bakau Condong
Rush Hour Morning Evening Morning Evening
Number of vehicle 3572 3756 3489 3679
Volume (veh/hour) 1786 1878 1745 1840
Volume (veh/sec) 0.49 0.52 0.48 0.51
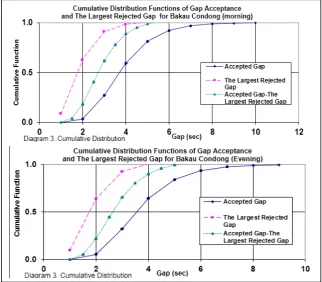
[image:5.595.57.531.621.716.2]The resulting gaps varied within relatively wide margins, illustrated in Fig. 4 and 5. In the maximum likelihood procedure, the largest rejected gap of each vehicle determines the lower limit of critical gap value.
Figure 4: Cumulative Distribution Function of Jalan Kluang – Jalan Tan Swee Hoe Intersection
Figure 5: Cumulative Distribution Function of Jalan Kluang – Jalan Bakau Condong Intersection
Referring to Fig. 4, critical gap can be determined by marking a straight line across the middle of the cumulative function y axis is a value 0.50. By using the formula, where the μ (mean) is the
[image:6.595.136.459.441.723.2]accepted gap - the largest rejected gap. The σ, standard deviation obtained by using the formula and q is flow of vehicles on major routes. Referring to Fig. 4, accepted gap is 3.80 seconds, the value of rejected gap is 1.88 second, the mean value is 2.88 and the calculated standard deviation is 0.96. The critical gap value can be calculated by using Eq. 2,
Critical gap, tc = 2.88 – (0.96 2 – 0.52) = 2.7 seconds
2
Summary of the result of critical gaps using maximum likelihood method is as presented in Table 2.
Table 2: Critical gap values using the maximum likelihood method
During the observation, it was found that most of the lanes changing events were performed by male drivers. In addition, weather conditions also play an important role. When raining, drivers difficult to get a suitable gap to change lane. The speed of vehicles on the adjacent lane may also influence the process of changing lanes where drivers on the current lane.
Conclusion
Based on the observation, the main factor which influences lane changing event is the flow rate of vehicle movements. Other factors that might as well influence are lane width of the roadway and traffic composition. The critical gap values are varying from 2.4 to 2.7 seconds which considerably small thus more likely reflect the aggressiveness of drivers in executing lane changing. Aggressive driving behavior may contribute to road accident and therefore with the findings in this study, responsible authority should consider a proper road safety intervention as accident mitigation measure such as provision of flexible posts between lanes in order to give safer channelization to drivers.
References
[1] P. Fancher, Report on Tasks: S-1, Analysis of Driver Response Delays and S-2, Lane Changes: Analysis of Data on Speed-Change and Lane-Change Behavior in Manual of ACC driving, (UMTRI-99-23), National Highway Traffic Safety Administration Technical Report. Washington, DC (1999)
[2] S. Hetrick, Examination of Driver Lane Change Behavior and the Potential Effectiveness of Warning Onset Rules for Lane Change or "Side" Crash Avoidance Systems. Unpublished master's thesis, Virginia Polytechnic Institute and State University, Blacksburg, Virginia (1997)
[3] J.M. Mason, K. Fitzpatrick Jr., D.L. Seneca and T.B. Davinroy, Identification of Inappropriate Driving Behaviors, Journal of Transpn. Engrg, ASCE, Vol. 118, No. 2, 1992, pp. 281-298 (1992)
[4] Amiruddin Ismail, Kasmiran Jumari and Ahmad Farhan Mohd Sadullah, Lane Changing Models Development for Urban Areas. Department of Civil and Structural Engineering, Faculty of Engineering, Universiti Kebangsaan Malaysia (2000)
Intersection
Critical Gap (s) Morning
Rush Hours
Evening Rush Hours
Jalan Kluang – Jalan Tan Swee Hoe 2.4 2.7
[5] W. Van Winsum, D. De Waard and K.A. Brookhuis, Lane Change Maneuvers and Safety Margins, Transportation Research Part F 2, 139-149. Amsterdam (1999)
[6] Sun Yon Hwang and Chang Ho Park, Modelling of the Gap Acceptance Behavior at Merging Section of Urban Freeway, School of Civil, Urban and Geosystem Engineering, Seoul National University 151-742 Korea (2005)
[7] Tomer Toledo, Haris N koutsopoulos, and Moshe E. Ben-Akiva, Modeling Integrated Lane Changing Behavior. Massachusetts Institute of Technology Paper No. 03-3391 (2003)
[8] Charisma F. Choudhury, Varun Ramanujam, and Moshe E. Ben-Akiva, A Lane Changing Model for Urban Arterials, Department of Civil and Environment Engineering, Massachusetts Institute of Technology, 77 Massachusetts Ave, 1-49 Cambridge MA 02129 (2009)
[9] W. Brilon, Delay At Oversatureted Unsignalised Intersections Based On Reserve Capacities, Transportation Research, Part A, No 33,(1999) pp. 161.
[10] Transportation Research Board, United States Highway Capacity Manual 2000, Washington D.C (2000)
[11] A. Asmi, Estimate of Gap Acceptance and Follow-Up Time for Unsignalised intersection Based on Malaysia Road Condition, Master’s Thesis, Universiti Sains Malaysia (2003)
[12] R.J. Troutbeck, Estimating the Critical Acceptance Gap from Traffic Movement, Physical Infrastructure Center Report, Queensland University of Technology Australia (1992)