DESIGN OPTIMIZATION FOR THE TWO-STAGE BIVARIATE PATTERN RECOGNITION SCHEME .
MOHD SHUKRI BIN MOKHTAR
A thesis submitted in partial fulfilment of the requirements for the award of the degree of
Masters of Mechanical Engineering
Faculty of Mechanical and Manufacturing Engineering Universiti Tun Hussein Onn Malaysia
v
ABSTRACT
ABSTRAK
vii
CONTENTS
TITLE i
DECLARATION ii
ACKNOWLEDGEMENT iv
ABSTRACT v
ABSTRAK vi CONTENTS vii
LIST OF TABLES xi
LIST OF FIGURES xii
LIST OF ABBREVIATIONS xiv CHAPTER 1 INTRODUCTION 1.1 Introduction 1
1.2 Statement of Problem 2
1.3 Objectives 3
1.4 Scopes 3
1.5 Definitions of Terms 4
1.6 Expected Result 6
CHAPTER 2 LITERATURE REVIEW
2.1 Introduction 7
2.2 Univariate Control Chart 10
2.2.1 Shewhart Control Chart 10
2.2.2 EWMA Control Chart 11
2.2.3 CUSUM Control Chart 12
2.3 Multivariate Control Chart 13
2.3.1 Hotelling T2 Control Charts 13
2.3.2 MCUSUM Control Charts 14
2.3.3 MEWMA Control Charts 15
2.4 Average Run Length (ARL) 17
2.5 Multivariate Pattern Recognition Scheme and ANN 18
2.6 ANN Recognizer Design 19
2.7 Artificial Neural Network (ANN) 21
2.8 Monitoring Bivariate Process Variation 22
2.9 Summary 24
CHAPTER 3 METHODOLOGY 3.1 Introduction 25
3.2 An Integrated MEWMA-ANN Structure 26
3.3 Synergistic-ANN Model Pattern Recognizer 27
3.4 Research Methodology 29
ix
CHAPTER 4 RESULT AND DISCUSSION
4.1 Introduction 31
4.2 Integrated MEWMA-ANN Scheme 32
4.3 Bivariate Patterns 34
4.4 Data Generator 35
4.5 ANN Trainer 38
4.6 Performance Results and Evaluation 40
4.6.1 Bivariate Normal Pattern 41 4.6.2 Bivariate Shift Pattern 42
4.6.3 Design parameters for MEWMA control chart 44
( λ = 0.05, H=7.35) 4.6.4 Design parameters for MEWMA control chart 45
( λ = 0.10, H=8.64) 4.6.5 Design parameters for MEWMA control chart 46
( λ = 0.20, H=9.65) 4.6.6 Design parameters for MEWMA control chart 47
( λ = 0.30, H=10.08) 4.6.7 Design parameters for MEWMA control chart 48
( λ = 0.40, H=10.31) 4.7 Comparison with Previous Research 49 4.8 Overall Performance of MEWMA Control 51
CHAPTER 5 CONCLUSION AND RECOMMENDTION
5.1 Conclusion 55
5.2 Recommendation 56
REFERENCE 57
xi
LIST OF TABLES
Table 2.1 : Conditions of Bivariate Correlated Pattern 24 Table 3.1 : Research question and solution in relation to objective 29
Table 4.1 : Data Generator 35
Table 4.2 : ANN Trainer 38
Table 4.3 : ARL0 for MEWMA Parameter 41
LIST OF FIGURES
Figure 2.1 : Chances and Assignable Cause of Variation 8 Figure 2.2 : Tools for monitoring process variation 9 Figure 2.3 : The Shape of the Run Length Distribution 17 Figure 2.4 : Novelty detector-ANN recognizer 19
Figure 2.5 : Ensemble-ANN 20
Figure 2.6 : Perfomance and capability improvement for
ANN-Based CCPR schemes 21
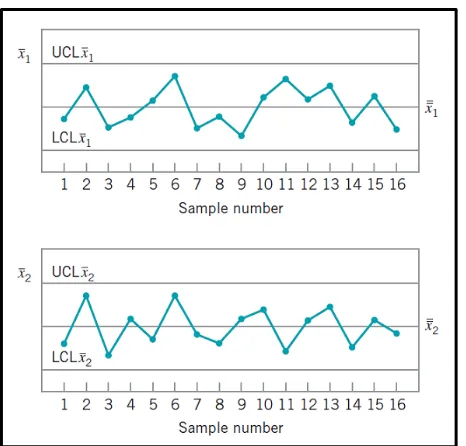
Figure 2.7 : Independent monitoring 23
Figure 2.8 : Joint monitoring 23
Figure 3.1 : MEWMA-ANN recognizer scheme 26
Figure 3.2 : Synergistic-ANN model 27
Figure 3.3 : Raw data-based ANN 28
Figure 3.4 : Feature-based ANN 28
xiii
LIST OF ABBREVIATIONS
SPC - Statistical Process Control
MSPC - Multivariate Statistical Process Control
MEWMA - Multivariate Exponentially Weighted Moving Average MCUSUM - Multivariate cumulative sum
ANN - Artificial Neural Network BQC - Bivariate Quality Control
EWMA - Exponentially Weighted Moving Average CUSUM - Cumulative Sum
CCP - Control Chart Patterns
CCPR - Control Chart Pattern Recognition ARL - Average Run Lengths
ARL0 - Average Run Lengths for in-control process ARL1 - Average Run Length for out-of-control process RA - Recognition Accuracy
MLP - Multi-layer perceptrons LVQ - Learning vector quantization RBF - Radial basis function
ART - Adaptive resonance theory
CHAPTER 1
INTRODUCTION
1.1 Introduction
Nowadays, quality control is important to ensure the product that produce is satisfied with the customer requirement. In order to achieve good quality, manufacturer has faces a lot of obstacles during the manufacturing process. One of the critical parts is the process variation. The process variation is always exist and inherent along the production process. Therefore, to ensure that the quality is good and satisfied the customer need, many company or industrial practitioner has been implemented the powerful tools which is statistical process control (SPC). The common tool that has been used is control chart. As such is Shewhart control chart that was developed by Walter A. Shewhart in 1920s at the Bell Telephone Laboratories. However, not all the quality can be monitored by the Shewhart control chart. This is because the Shewhart control has a limitation in which this type of control chart only able to detect the large shifts of process means. In detecting the small shifts of process mean, the Shewhart control chart is unable to trace or slower.
using the MEWMA – ANN pattern recognition scheme in terms of monitoring and diagnosis the quality control. This scheme involve two-stage of monitoring which are multivariate exponentially moving average (MEWMA) and the second stage is artificial neural network (ANN) which is namely as a synergistic ANN. The design and modelling of input data representation in training and pre – testing ANN – based model are based on Lehman (1977) model, whereas the validation tests are performed using actual manufacturing process data. In this research also mainly used the MATLAB software to evaluate the performance of the MEWMA-ANN schemes. Whereas the design parameter for MEWMA control chart was determine according to the Prabhu and Rungger (1997).
1.2 Statement of Problem
3
1.3 Objectives
The objectives of this study are:
i. To develop a two-stage pattern recognition scheme for recognizing bivariate process variation.
ii. To investigate an optimal design parameter for the two-stage pattern recognition scheme.
iii. To evaluate the recognition performance of the proposed design.
1.4 Scopes
The scope of this research are as listed below:
i. The bivariate process variables are dependent to each other based on linear cross correlation (p).
ii. The predictable patterns of process variation are limited to sudden shifts (upward shifts and downward shifts).
iii. Magnitudes of variation (sudden shifts) are limited within ± 3 standard deviations based on control limits of Shewhart control chart iv. Design and modelling of input data representation in training and
1.5 Definition of Terms
The following terms are important and frequently used in this research:
(a) Process monitoring and diagnosis.
Process monitoring refers to the identification of process status either it is running within a statistically in-control or has become a statistically out-of-control. While, process diagnosis refers to the identification of sources of variation in relation to a statistically out-of-control process.
(b) Sources of variation.
Sources of variation refers to a component variable or group of component variables that indicate a bivariate process has become out-of-control. In this research, it is focused on sudden shift in process mean (process mean shifts). This information is useful towards diagnosing the root cause error.
(c) On-line process.
5
(d) De facto level (de facto monitoring level).
De facto level refers to a widely acceptable average run length value for the first false alarm to occur in monitoring process variable or quality characteristics. Specifically, it refers to ARL0 ≥ 370 based on the traditional univariate SPC charting schemes such as Shewhart, CUSUM and EWMA control charts.
(e) Control chart patterns (CCPs).
Refer to the patterns of univariate process data streams that can be indicated graphically using Shewhart control chart.
(f) Bivariate patterns.
Bivariate patterns refer to the unified patterns that are able to indicate the linear correlation between two dependent variables.
(g) Accurate diagnosis.
Accurate diagnosis refers to a desirable diagnosis performance, that is, effective to correctly identify the source of variation with high recognition accuracy (≥ 95%).
(h) Pattern recognition.
(i) Pattern recognition scheme.
Pattern recognition scheme refers to a set of related procedures formulated and presented in a unified manner for addressing the problem of control chart pattern recognition (Hassan, 2002).
1.6 Expected Result
In this project, the design parameters for MEWMA control chart has been chosen based on Prabhu and Runger 1997. The proposed design was evaluated based on average run length (ARL0, ARL1) and recognition accuracy (RA).
1.7 Summary
CHAPTER 2
LITERATURE REVIEW
2.1 Introduction
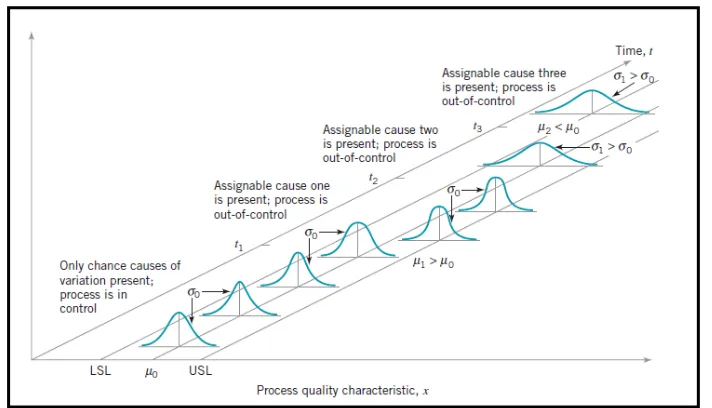
Figure 2.1 : Chances and assignable cause of variation (Montgomery, 2009).
Figure 2.1 shows that from initial time t0 until certain period t1, the process shown in statistical control that is only chance causes are present. Within this period, process mean and standard deviation are in control value, µ0 and σ0. There are three variation possibility may be happen in the process environment. As shown at time t1, an assignable cause may shift the process mean (µ1>µ0) but maintain the dispersion (σ0). While at time t2, other assignable cause may effect the dispersion (σ2>σ0) but maintain the mean (µ0). Lastly as shown at t3, other assignable cause may effects both process mean and dispersion shifts normally to be out-of-control, µ3<µ0 and σ3>σ0.
9
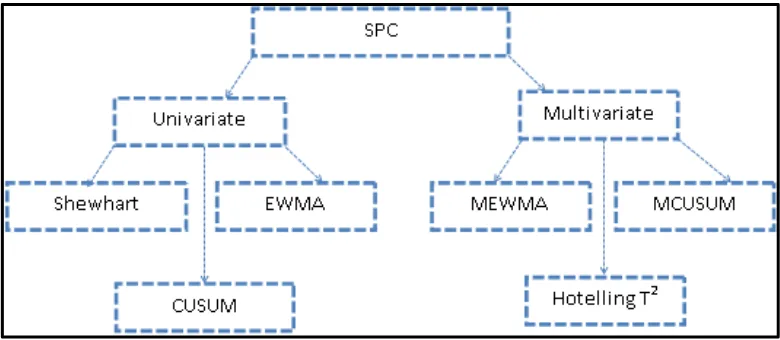
detect large shift of process mean and insensitive for small shifts (about 1.5σ or less). In general, the use of statistical tools in monitoring process variation can be visualised as follows:
[image:20.595.120.510.142.312.2]As mention earlier, process variation is a major source of poor quality products. As such, monitoring and diagnosis of variation is essential towards continuous quality improvement. The selection of statistical process control scheme becomes more critical and challenging when involving two correlated variables. The existing traditional SPC schemes for bivariate quality control were designed for rapid detection with limited capability in avoiding false alarm. This situation is imbalanced monitoring performances and another issue is the difficulty in identifying the soured of unnatural variation. To give the better performance, the analysis of bivariate quality control has been used two-stage intelligent monitoring scheme (Masood and Hassan, 2014). The two-stage intelligent is the combination between MEWMA and ANN scheme which is synergistic ANN. The design parameters for MEWMA control chart has been investigated to obtained the optimal design parameter. In this research, the author has utilize different design parameters for MEWMA control chart according to the design proposed by Prabhu and Runger (1997).
2.2 Univariate Control Charts
The univariate control charts are used to monitor a single quality characteristic. These kinds of control chart have been popular and widely implement in industry due to their simplicity. Shewhart control chart, the exponentially weighted moving average (EWMA) control chart and the cumulative sum (CUSUM) chart are classified into univariate control chart.
2.2.1 Shewhart Control Chart
The Shewhart control chart also known as X-bar control chart in which this sort of control chart widely utilize in manufacturing industry due to the simplicity. The basic concepts that lies in the Shewhart control chart is the difference of controlled variation and uncontrolled variation. The Shewhart control chart can be defined as follows:
̅
Consider that the mean µ and the standard deviation σ value is known. Hence the quality characteristic is normally distributed. So the average of the sample is as the above equation. To construct the Shewhart control chart control limit (Montgomery, 2009):
̿ ̅ 2.2
̿ 2.3
11
2.2.2 EWMA Control Chart
An exponentially weighted moving average (EWMA) control scheme was introduced by Roberts (1959). In these charts, the each of plotted point is representing the weighted average of current and all previous subgroup values. Despite of knowing to have optimal properties in some forecasting and control application, the EWMA had been ignored as tool by quality control analysis (Lucas and Saccucci, 1990). Lucas and Saccucci, 1990 has evaluate the properties of EWMA control scheme and finding out that EWMA control scheme is more sensitive to start-up problems due to the fast initial response feature. The EWMA control schemes can be defined as follows:
( ) 2.5
Where 0 < λ ≤ 1 is constant and the starting value is the process target, so that the value of .
The EWMA sometimes known as a geometric moving average because can be equivalently written as a moving average of the current and past observations:
∑( ) ( )
2.2.3 CUSUM Control Chart
In general, the cumulative sum or CUSUM control chart was developed by Page in 1954. In these chart, it plots the cumulative sums of the sample values deviations of a quality characteristic from a target value against time. Previously, the researchers has stated that CUSUM control chart is more effective and efficient rather than Shewhart control chart for detecting smaller variation in the average. The tabular CUSUM work by accumulating derivations from µ0 in which there are above target with one statistic C+ another one is that are below target with statistic C-. Both of C+ and C- statistics are called one-sided upper and lower cusums respectively. They can be defined as follows:
, ( ) - 2.7
, ( ) - 2.8
Where the starting values are . The K notation is representing the reference value and basically it is often chosen halfway between the target µ0 and the shift of mean which one is interested in detecting. Hence,
| |
Both values of and in the CUSUM are accumulate deviation from the target value µ0 in which there are greater than K. If any of them that are exceed the decision interval H, totally it can be said that the process is out-of-control. In CUSUM control scheme, it is important for proper selection of these two parameter K and H respectively. The proper selection of this parameter will determine the performance of the CUSUM. A reasonable value of H is five times the process standard deviation σ. According to the Montgomery, the parameters of the CUSUM chart are as follows:
2.10
13
2.3 Multivariate Control Charts
Nowadays, the quality engineering aspect becomes more challenging and critical in manufacturing engineering process. Due to this, the importance of multivariate control charts has been escalated because more quality features are measured in mass production than ever before. The most common multivariate control chart are multivariate exponentially weighted moving average (MEWMA) control chart, multivariate cumulative sum (MCUSUM) control chart and multivariate Shewhart control chart. In this dissertation, the author will study the optimal design parameter for MEWMA.
2.3.1 Hotelling T2 Control Charts
In general, the Hotelling T2 chart is a direct analog of the univariate Shewhart ̅ chart. This kind of control chart is can be considered the most popular multivariate control chart for monitoring several quality characteristics. The Hotelling T2 chart was proposed by Hotelling H, 1947. There are two types of the Hotelling T2 chart which are sub-grouped data and the other one is individual observations. The most frequent observation in industry process is involving individual observations. Consider that m samples, each of size n = 1 are available and that ρ is the number of quality characteristics observed in each sample. Let ̅ and S be the sample mean vector and covariance matrix of these observations respectively. Then the Hotelling can be as follows;
( ̅) ( ̅) 2.12
Whereas for the upper control limit (UCL) and lower control limit (LCL) for monitoring processes are
( )( )
Where is the upper α percentage point of F distribution with parameters p and m-p. However, the Hotelling T2 is not effective in detecting small and moderate mean shifts as the variable process is increases it lose the efficiency in detection of process variation.
2.3.2 MCUSUM Control Charts
The introduction of MCUSUM and MEWMA is appear as an alternatives to the Hotelling T2 chart. This is due to the effectiveness between both control chart which are sensitive to small and moderate shifts. In 1988, Crosier has proposed two multivariate CUSUM procedures. The one with the best ARL performance is based on the statistic:
*( ) (
)+ ⁄ 2.15
Where,
( ) {(
) . / 2.16
With S0 = 0, and k > 0. An out of control signal is generated when;
( ) 2.17
Which the value of both k and H represents the reference value and decision interval for the procedure respectively. Pignatiello and Runger (1990), has come out with two proposed different forms of the multivariate CUSUM. Their best performing control chart is based on the following vectors of cumulative sums:
∑ 2.18
And
15
Where k > 0, li = li-1 + 1 if MCi-1 > 0 and li = 1 otherwise. An out of control signal is generated if MCi > H.
2.3.3 MEWMA Control Charts
Although the Shewhart control chart is widely implemented today, there is some limitation of this control chart. The Shewhart control chart is relatively insensitive to small and moderate shifts in the mean vector. Meanwhile, both of the cumulative sum and EWMA control charts were developed to trigger the small shifts in the univariate case. This will led to the development of a multivariate EWMA control chart (Lowry et al. 1992). The MEWMA is a logical extension of the univariate EWMA and is defined as follow (Montgomery, 2009) :
( ) 2.20
where, λ is a smoothing parameter (0 < λ ≤ 1) and it is assumed . The MEWMA control chart give a warning signal when,
∑ 2.21
where H is a specified control limit and the covariance matrix, ∑ is given as :
, ( ) - 2.22
In the bivariate case, the MEWMA statistics can be defined as follows (Masood, 2014) :
[ ( ) ( ) ( )( )]
( ) 2.23
( ) ( ) 2.24
Covariance matrix of MEWMA :
∑ ( )[
]
2.26
17
2.4 Average Run length (ARL)
Basically, the statistical process control chart was developed to detect process shifts as faster as possible when the process signal out-of-control. Another method to trace the out-of-control process rather than control chart is the average run length (ARL) of the control chart. In general, the ARL is the number of points average in which it must be plotted before the point indicates an out-of-control condition. Note that for a Shewhart control chart ARL can be defined as follow:
Which is the notation of ρ is represent the probability any point that exceeds the control limit. Thus, the same equation can be used to evaluate the control chart performances (Montgomery, 2009). There are in control distributions for the MEWMA chart with ARL0 = 200, 400, and 600 respectively (Huh, 2014).
In monitoring aspects, the ARL0 values measure how long it could maintain stable process running without false alarm. While the values of ARL1 measure how fast it could detect the mean shift. These values were computed based on the correctly classified patterns (Masood and Hassan, 2012). In other words, it can be said that ARL0 is in control process whereas ARL1 is out of control process. In bivariate process, Masood and Hassan (2014) has compared the ARLs and recognition accuracy (RA) between the proposed scheme with the traditional MSPC. As a resulted, it shows that the proposed design gave the superior performance than the traditional MSPC.
2.5 Multivariate Pattern Recognition Scheme and ANN
Nowadays, the pattern recognition has widely use and utilize in various field of area research. In manufacturing processes, pattern recognition is act to reveal potential quality problems. One of the approaches for recognizing different control chart patterns is develop the various shape features of the patterns. This approach will help and assist the users to easily can understand how a particular pattern is identified. To make it more effective, the artificial neural network (ANN) will analyse the pattern recognition from the shape feature that they read. ANN with feature extracted from the process data as input vector representation can facilitate efficient pattern recognition. There are various models of ANN and it can be categorized into single model and combined model. Multi-layer perceptrons (MLP), learning vector quantization (LVQ), radial basis function (RBF), adaptive resonance theory (ART) and Kohonen self-organizing mapping (SOM) can be classified as single ANN models. The application of single ANN models are commonly limited to simple recognition cases. This is different for the combined ANN models. The combined ANN models were investigated for dealing with more complex cases.
19
(SPCPR). (Pham and Oztemel, 1993; Hwang and Hubele, 1993; Cheng 1995; 1997; Guh et al., 1999a; 1999b; Guh and Tannock, 1999; Guh and Hsieh, 1999; Perry et al., 2001; Hassan et al., 2003; Al-Assaf, 2004; Al-Assaf and Assaleh, 2005; Gauri and Chakraborty, 2006; 2008) as well as for bivariate pattern recognition (Niaki and Abbasi, 2005; Guh, 2007).
2.6 ANN Recognizer Design
[image:30.595.170.437.514.746.2]The existing multivariate pattern recognition schemes are categorized into two which are ANN-Based model and Integrated MSPC-ANN model based on external structures. Generally, the ANN-based models are designed to perform simultaneously for monitoring and diagnosis process. Zorriassatine et al. (2003) has come out with the designing of a novelty detector-ANN which functions for recognizing normal pattern and sudden shift patterns namely upward shift and downward shift. Only two sources of variation investigate which are upward shift (1,0) and upward shift (0,1). The upward shift (1,0) class represents only variable-1 is shifted, meanwhile upward shift (0,1) class represents only variable-2 is shifted. The performance of the scheme was evaluated based on recognition accuracy (RA) and no performance based on average run length (ARL0, ARL1) reported.
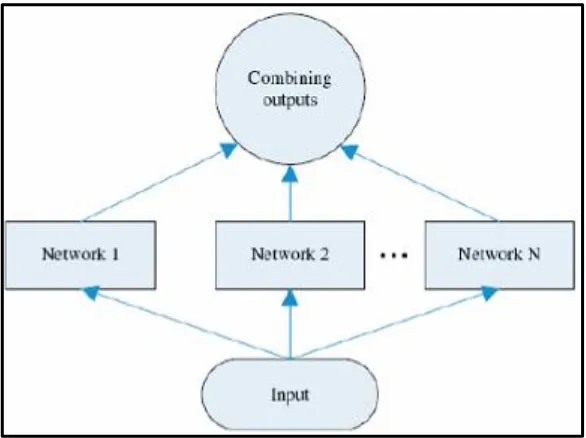
Yu and Xi (2009) designed ensemble-ANN for monitoring and diagnosis of bivariate process mean shifts. The sources of variation are limited to three which consists of upward shift (1,0), upward shift (0,1) and upward shift (1,1). The upward shift (1,0) pattern represents only variable-1 is shifted, upward shift (0,1) pattern represents only variable-2 shifted whereas upward shift (1,1) patterns represents both variables are shifted. The performance measurements were based on average run length (ARL0, ARL1) and recognition accuracy.
21
2.7 Artificial Neural Network (ANN)
Artificial Neural Networks (ANN) now is widely used in many fields. It is become well established and viable. In quality control engineering field, it becomes well known as many researchers today has utilize the ANN in their research project. ANN has been applied to statistical process control (SPC) since late 1980s. One of the main reasons for the application of ANN to SPC is to automate the SPC charts interpretation. The proposed ANN will act as an automatic decision making in SPC towards replacing the human interpretation. The aim is to diagnose the source of variation with minimum human intervention. Control chart pattern recognition (CCPR) has become an active area of research since late 1980s. Zorriassatine and Tannock (1998) has provided a useful review on the application of ANN for CCPR. Around late 1980s also and early in the 1990s, the application of ANN has started to replace the rule based expert system in recognition and interpretation of univariate control chart patterns (CCP). This has extend to the further investigation on ANN application to SPC. The following figure shows the performance and capability improvement of ANN-Based CCPR schemes.
2.8 Monitoring Bivariate Process Variation
In manufacturing industries, an appropriate SPC charting scheme is necessary when the quality feature of the product involves two correlated variables also as known as bivariate. It is important to monitor and diagnose these variables jointly. Monitoring process can be describe as an identification of process condition either in a statistically in-control or out-of-control, while diagnosis process is refers to the identification of the source variables for out-of-control condition.
23
Figure 2.7 : Independent monitoring (Montgomery, 2009)
Generally, bivariate process is the simplest case in multivariate quality control when only two variables are being monitored dependently.
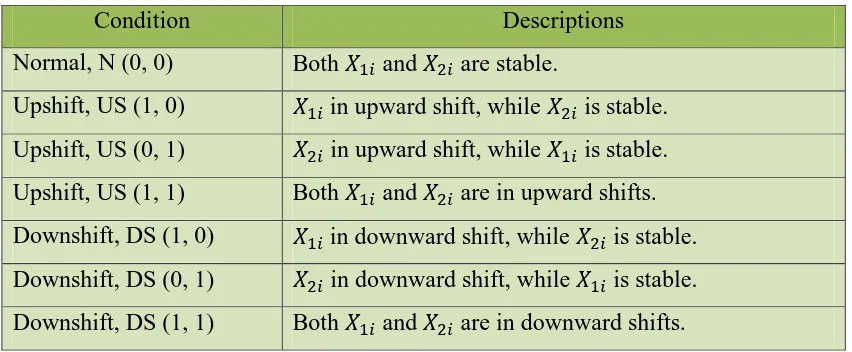
In this study, seven possible categories of bivariate pattern were considered in representing the bivariate process variation in mean shifts as follows (Masood and Hassan, 2012):
Table 2.1 : Conditions of Bivariate Correlated Pattern.
Bivariate shift patterns references are based on mean shifts ± 0.75 - 3.00 standard deviation. Further explanations and discussion can be refer to the Masood and Hassan (2014).
2.9 Summary
This chapter reviews the general knowledge about process variation, control chart categories and the development of control chart pattern recognition and artificial neural networks (ANN). It also reveals the previous researchers study on the monitoring and diagnosis of multivariate process. In general, the existing scheme has shown the lack of diagnosis, thus the investigation of optimal design parameter shall be made to obtain the better performance.
Condition Descriptions
Normal, N (0, 0) Both and are stable.
REFERENCES
Al-Assaf, Y. (2004). “Recognition of Control Chart Patterns Using Multi-Resolution Wavelets Analysis and Neural Networks.” Computers and Industrial Engineering. Vol. 47. pp. 17 − 29.
Assaleh, K. and Al-Assaf, Y. (2005). “Features Extraction and Analysis for Classifying Causable Patterns in Control Charts.” Computers and Industrial Engineering. Vol. 49. pp. 168 − 181.
Chen, L. H. and Wang, T. Y. (2004). “Artificial Neural Networks to Classify Mean Shifts from Multivariate χ2 Chart Signals.” Computers and Industrial Engineering. Vol. 47. pp. 195 − 205.
Cheng, C. S. (1995). “A Multi-Layer Neural Network Model for Detecting Changes in The Process Mean.” Computers and Industrial Engineering. Vol. 28 No. 1. pp. 51 − 61.
Cheng, C. S. (1997). “A Neural Network Approach for the Analysis of Control Chart Patterns.” International Journal of Production Research. Vol. 35 No. 3. pp. 667 − 697.
Crosier, R. B. (1988). Multivariate generalizations of cumulative sum quality-control
El-Midany, T. T., El-Baz, M. A. and Abd-Elwahed, M. S. (2010). “A Proposed Framework for Control Chart Pattern Recognition in Multivariate Process Using Artificial Neural Networks.” Expert Systems with Applications. Vol. 37. pp. 1035 − 1042.
Gauri, S. K. and Chakraborty, S. (2006). “Feature-Based Recognition of Control Chart Patterns.” Computers and Industrial Engineering. Vol. 51. pp. 726 − 742. Gauri, S. K. and Chakraborty, S. (2008). “Improved Recognition of Control Chart Patterns Using Artificial Neural Networks.” International Journal of Advanced Manufacturing Technology. Vol. 36. pp. 1191 − 1201.
Guh, R. S., Tannock, J. D. T., & O'Brien, C. (1999a). IntelliSPC: a hybrid intelligent tool for on-line economical statistical process control. Expert Systems with
Applications, 17(3), 195-212.
Guh, R. S., Zorriassatine, F., Tannock, J. D. T. and O’Brien, C. (1999b). “On-Line Control Chart Pattern Detection and Discrimination - A Neural Network Approach.”
Artificial Intelligence in Engineering. Vol. 13. pp. 413 − 425.
Guh, R. S. and Tannock, J. D. T. (1999). “Recognition of Control Chart Concurrent Patterns Using a Neural Network Approach.” International Journal of Production Research. Vol. 37 No. 8. pp. 1743 − 1765.
Guh, R. S. and Hsieh, Y. C. (1999). “A Neural Network Based Model for Abnormal Pattern Recognition of Control Charts.” Computers and Industrial Engineering. Vol. 36. pp. 97 − 108.
Guh, R. S. (2007). “On-Line Identification and Quantification of Mean Shifts in Bivariate Processes Using a Neural Network-Based Approach.” Quality and Reliability Engineering International. Vol. 23. pp. 367 − 385.
Hassan, A., Nabi Baksh, M. S., Shaharoun, A. M. and Jamaludin, H. (2003). “Improved SPC Chart Pattern Recognition Using Statistical Features.” International Journal of Production Research. Vol. 41 No. 7. pp. 1587 − 1603.
59
Hotelling, H. H. (1947). Multivariate quality control. In C. Eisenhart, M. W. Hastay, & W. A. Wallis (Eds.), Techniques of statistical analysis. New York: McGraw-Hill.
Hwang, H. B. and Hubele, N. F. (1993). “Back-Propagation Pattern Recognizers for X-bar Control Charts: Methodology and Performance.” Computers and Industrial Engineering. Vol. 24 No. 2. pp. 219 − 235.
Hwarng, H. B. (1997). “A Neural Network Approach to Identifying Cyclic Behaviour on Control Charts: A Comparative Study.” International Journal of Systems Science. Vol. 28 No. 1. pp. 99 − 112.
Ick Huh (2014) “Optimal Monitoring Methods for Univariate and Multivariate EWMA Control Charts.” McMaster University: Ph.D. Thesis.
Lehman, R. S. (1977). “Computer Simulation and Modeling: An Introduction.” London: Lawrence Erlbaum.
Lowry, C. A., Woodall, W. H., Champ, C. W. and Rigdon, S. E. (1992). “A Multivariate Exponentially Weighted Moving Average Control Chart.”
Technometrics. Vol. 34. No 1. pp. 46 − 53.
Lucas, J. M. and Saccucci, M. S. (1990). “Exponentially Weighted Moving Average Control Schemes: Properties and Enhancements.” Technometrics. Vol. 32. No. 1. pp. 1 − 29.
Masood. I. (2004) “SPC Charting Procedure for Monitoring of Small and Large Shifts in Process Mean”. Universiti Teknologi Malaysia: Masters Thesis.
Masood, I., & Hassan, A. (2012). An Integrated MEWMA-ANN scheme towards
balanced monitoring and accurate diagnosis of bivariate process mean shifts.Journal
of King Saud University-Computer and Information Sciences, 24(2), 93-100.
Masood, I., & Hassan, A. (2014). Bivariate quality control using two-stage intelligent
monitoring scheme. Expert Systems with Applications, 41(16), 7579-7595.
Montgomery, D. C. (2009). Introduction to statistical quality control. John Wiley &
Niaki, S. T. A. and Abbasi, B. (2005). “Fault Diagnosis in Multivariate Control Charts Using Artificial Neural Networks.” Quality and Reliability Engineering International. Vol. 21. pp. 825 − 840.
Perry M. B., Spoerre, J. K. and Velasco, T. (2001). “Control Chart Pattern Recognition Using Back Propagation Artificial Neural Networks.” International Journal of Production Research. Vol. 39 No. 15. pp. 3399 − 3418.
Pignatiello, J. J., & Runger, G. C. (1990). Comparisons of multivariate CUSUM
charts. Journal of quality technology, 22(3), 173-186.
Pham, D. T. and Oztemel, E. (1993). “Control Chart Pattern Recognition Using Combinations of Multilayer Perceptrons and Learning Vector Quantization Neural Networks.” Proc. Instn. Mech. Engrs. Vol. 207. pp. 113 − 118.
Prabhu, S. S. and Runger, G. C. (1997). “Designing a Multivariate EWMA Control Chart.” Journal of Quality Technology. Vol. 29 No. 1. pp. 8 − 15.
Yu, J. B., Xi, L. F. and Zhou, X. J. (2009). “Identifying Source(s) of Out-of-Control Signals in Multivariate Manufacturing Processes Using Selective Neural Network Ensemble.” Engineering Applications of Artificial Intelligence. Vol. 22. pp. 141 − 152.
Yu, J. B. and Xi, L. F. (2009). “A Neural Network Ensemble-Based Model for On-Line Monitoring and Diagnosis of Out-of-Control Signals in Multivariate Manufacturing Processes.” Expert Systems with Applications. Vol. 36. pp. 909 − 921.
Zorriassatine, F., & Tannock, J. D. T. (1998). A review of neural networks for
statistical process control. Journal of intelligent manufacturing, 9(3), 209-224.