International Journal of Emerging Technology and Advanced Engineering Website: www.ijetae.com (ISSN 2250-2459, Volume 2, Issue 8, August 2012)
482
Effects of Compression Ratios, Fuels And Specific Heats
On The Energy Distribution in Spark- Ignition Engine
Sandeep kumar kamboj1, Munawar Nawab Kairimi2
1,2
Department of Mechanical Engineering, Faculty of Engineering and Technology Jamia Millia Islamia, New Delhi- 110 025 (India)
Abstract- This paper presents a fundamental thermodynamic approach to study spark - ignition engine. A thermodynamic model is developed to study the energy distribution of alternative fuels that is methanol, ethanol, iso- octane and liquefied petroleum gas (LPG). The energy of the fuels are distributed with work, heat transfer through the wall and energy with the exhaust gases. In addition to this, specific heats of air fuel mixture of alternative fuels are calculated with the change in compression ratios during compression, combustion, expansion and exhaust. This study shows that the major portion of energy goes waste with the exhaust. The results also showed that the energy with the exhaust gases decreases with the increase in compression ratio and energy with work and heat transfer increases with the increase in compression ratio for all the fuels examined. The specific heats of all the fuels increase from compression to the combustion and decreases slightly during exhaust stroke. This variation in specific heats is taken into consideration while calculating energy distribution. The specific heats of hydrocarbon fuels are lower than the oxygenated fuels during compression, combustion and exhaust. Energy with work for methanol and LPG are higher about 2.21% from ethanol and iso-octane because of their higher adiabatic flame temperature. Energy with exhaust gases of methanol are higher about 4%, 4.78% and 3.83% for iso-octane, LPG, and ethanol respectively. Energy with heat loss of iso-octane are higher about 1.78%, 19.86% and 1.36% for LPG, methanol and ethanol respectively.
Key Words: Ethanol, Methanol, LPG, Iso-octane, Energy, compression ratio
I. INTRODUCTION
Today’s energy crises and environmental problems have concentrated the investigations on
International Journal of Emerging Technology and Advanced Engineering Website: www.ijetae.com (ISSN 2250-2459, Volume 2, Issue 8, August 2012)
[image:2.612.68.538.153.287.2]483
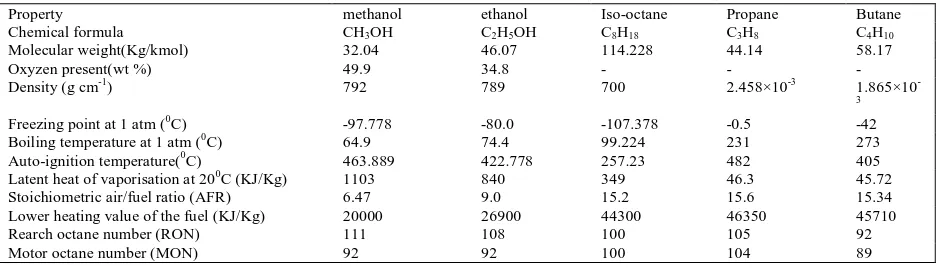
Table 1.0 Comparision of selected fuels properties :
Property methanol ethanol Iso-octane Propane Butane
Chemical formula CH3OH C2H5OH C8H18 C3H8 C4H10
Molecular weight(Kg/kmol) 32.04 46.07 114.228 44.14 58.17
Oxyzen present(wt %) 49.9 34.8 - - -
Density (g cm-1) 792 789 700 2.458×10⁻³ 1.865×10
-3
Freezing point at 1 atm (0C) -97.778 -80.0 -107.378 -0.5 -42
Boiling temperature at 1 atm (0C) 64.9 74.4 99.224 231 273
Auto-ignition temperature(0C) 463.889 422.778 257.23 482 405
Latent heat of vaporisation at 200C (KJ/Kg) 1103 840 349 46.3 45.72
Stoichiometric air/fuel ratio (AFR) 6.47 9.0 15.2 15.6 15.34
Lower heating value of the fuel (KJ/Kg) 20000 26900 44300 46350 45710
Rearch octane number (RON) 111 108 100 105 92
Motor octane number (MON) 92 92 100 104 89
II. SYSTEM DESCRIPTION
Fig.1 shows the temperature entropy diagram of the air standard Otto cycle with the internal irreversibilities. Thermodynamic cycle 1-2s-3-4s-1 denotes the air standard Otto cycle without internal irreversibilities while cycle 1-2-3-4-1 designates the air standard Otto cycle with internal irreversibilities. The cycle considered for analysis is a complete representation of the four stroke SI engine including the compression, combustion, expansion and exhaust processes and as shown in Figure.1. Process 1-2s is a reversible adiabatic compression, while process 1-2 is an irreversible adiabatic process that takes into account the internal irreversibilities in the real compression process. The heat addition is a constant volume process 2-3 process 3-4s is a reversible adiabatic expansion, while 3-4 is an adiabatic process that takes into account the internal irreversibilities in the real expansion process. The heat rejection is at a constant
volume process 4-19-11.
Figure 1. (Four stroke SI cycle )
2.1 Chemical equations:
The following chemical equations are used during combustion of fuels at stoichiometric condition.
(i) CH3OH + 1.5O2 + 5.65 N2 CO2
International Journal of Emerging Technology and Advanced Engineering Website: www.ijetae.com (ISSN 2250-2459, Volume 2, Issue 8, August 2012)
484
(ii) C2H5OH + 3O2 + 11.28 N2
2CO2 +3H2O + 11.28N2 (ethanol
fuel)
(iii) C8H18 +12.5O2 + 47 N2 8CO2
+9H2O + 47N2 (iso-octane fuel)
(iv) 0.8C3H8 + 0.2 C4 H10 + 5.3O2 + 27.32 N2
3.2CO2 +4.2H2O + 27.32 N2 (LPG fuel)
III. THERMODYNAMIC MODEL
Process 1-2:
The specific heat of the mixture at constant pressure is find out by the relation
(CP)mix = 𝑚𝑖𝑐𝑝𝑖
𝑛
𝑖=1 (1)
The specific heat of the mixture at constant volume is find out by the relation
(cv)mix = 𝑛𝑖=1𝑚𝑖 𝑐𝑣 𝑖 (2)
The characteristic gas constant is found out by the relation
R= Cp- Cv (3)
R= 𝑅
𝑀 (4)
Where M is the molecular weight of the fuel.
m = MN (5)
Where m is the mass of the fuel in air fuel
mixture.
Temperature at the end of the process is given by
T2/T1 = (V1/V2)n-1 = (r)n-1 (6)
Process (2-3):
During process 2-3, combustion of fuels takes place, the of Cp and Cv are calculated at the
average temperature ( temperature after compression + adiabatic flame temperature) / 2
Values of Cp and Cv of different fuels are
calculated using the following equations. Specific heats as a function of temperature are represented as
Cp = a + bT + cT2 + dT3 ( T in K, Cp in kj / kmol
. k)
Substance a b c d
Methanol 19.0 9.152 × 10⁻² -1.22 × 10⁻⁵ -8.039 × 10⁻⁹ Ethanol 19.9 20.96 × 10⁻² -10.38 × 10⁻⁵ 20.05 × 10⁻⁹ Iso-octane -0.053 6.75 × 10⁻³ -3.67× 10⁻⁶ -0.39 × 10⁻⁹ Propane -4.04 30.48 × 10⁻² -15.72 × 10⁻⁵ 31.74 × 10⁻⁹ Butane 3.96 37.15 × 10⁻² -18.34 × 10⁻⁵ 35.00 × 10⁻⁹
Qin =mf × LHV of the fuel and
mf ×LHV = m Cv (T3-T2) (7)
International Journal of Emerging Technology and Advanced Engineering Website: www.ijetae.com (ISSN 2250-2459, Volume 2, Issue 8, August 2012)
485
The adiabatic flame temperature T3 is
calculated after using the energy balance over the heat addition process as
3.1 Wall heat transfer calculations
The wall heat losses in SI engine are different for different fuels depending upon the thermal conductivity and buring rates in addition to the quenching distances.
In general the instantaneous convective heat transfer coefficient for gas to wall heat exchange is modeled by using Annands & Woschnis correlation12-16.
hc=3.26p0.8B-0.2U0.8 (8)
where, U is the characteristic gas velocity and is given by
U = 2.285 sp+ 0.00324 To Vd/Vo ×∆p/po
The surface area of the engine combustion chamber exposed to the heat at the given crank angle is
Aw(θ) = Ahead +Apiston + Acy(θ) (9)
Acy(θ) is the area of the cylinder, and at given
crank angle θ it may be presented as
Acy(θ) = πBL(R+1-cosθ – (R2-sin2θ)1/2) (10)
Where R = 2L/B and L is the stroke length and B is the bore .
Therefore using the above parameters the amount of heat lost from gas to the wall heat transfer in the combustion chamber is given by
Qw =hwAw ∆T (11)
Process 3- 4:
Work done during expansion process is calculated by:
W3-4=mR(T3-T4)/n-1 (12)
Where n is the polytropic index and R is the
characteristic gas constant.
Process 4-1:
The energy lost with the exhaust gases are calculated by using the following equation.
Qout=mCv(T4–T1) (13)
IV. RESULTS AND DISCUSSIONS
4.1 Energy Distributions of Iso-octane
International Journal of Emerging Technology and Advanced Engineering Website: www.ijetae.com (ISSN 2250-2459, Volume 2, Issue 8, August 2012)
486
4.2 energy distribution of LPG:
Figure 3 shows effects of the change in compression ratio on the energy with work, energy with exhaust gases and heat loss for the LPG. The results shows that the energy with the exhaust gases decreases with the increase in compression ratios and energy with work and heat transfer increases with the increase in compression ratio for the LPG. It is because of
the reason that pressure and temperature increases which results in increased heat loss through the cylinder wall and more indicated power is produced during expansion process. The exhaust gases cooled down with the increase in compression ratios because most of the energy goes with work and heat transfer through wall which results in less energy transfer with the exhaust gases.
53.9 51.9 50.1 48.06 46.35
12.02 13.2
14.6 15.64
17.05
34.08 34.9
35.3 36.34 36.61
0 10 20 30 40 50 60
8 9 10 11 12
Fig.2 Energy distribution for Iso -octane
C
o
m
p
res
si
o
n
ra
ti
o
8 9 10 11 12
work 34.08 34.9 35.3 36.34 36.61
Heat loss 12.02 13.2 14.6 15.64 17.05
Transfer with exhaust to
enviroment 53.9 51.9 50.1 48.06 46.35
work
Heat loss
International Journal of Emerging Technology and Advanced Engineering Website: www.ijetae.com (ISSN 2250-2459, Volume 2, Issue 8, August 2012)
487 4.3 Energy distribution of methanol
:
Figure 4 shows effects of the change in compression ratio on the energy with work, energy with exhaust gases and heat loss for the methanol. The results shows that the energy with the exhaust gases decreases with the increase in compression ratios and energy with work and heat transfer increases with the increase in compression ratio for the methanol.
It is because of the reason that pressure and temperature increases which results in increased heat loss through the cylinder wall and more indicated power is produced during expansion. The exhaust gases cooled down with the increase in compression ratios because most of the energy goes with work and heat transfer through wall which results in less energy transfer with the exhaust gases.
54.2
51.8 49.7 48.16 46.6
11.4 12.7 14.34
15.26 16.38
34.4 35.15
35.96 36.58
37.02
0 10 20 30 40 50 60
8 9 10 11 12
Fig.3 Energy distribution for LPG
C
o
m
p
res
si
o
n
ra
ti
o
8 9 10 11 12
Work 34.4 35.15 35.96 36.58 37.02
Heat loss 11.4 12.7 14.34 15.26 16.38
Transfer with exhaust to
enviroment 54.2 51.8 49.7 48.16 46.6
Work
Heat loss
International Journal of Emerging Technology and Advanced Engineering Website: www.ijetae.com (ISSN 2250-2459, Volume 2, Issue 8, August 2012)
488 4.4 Energy Distribution of Ethanol
:
Figure 5 shows effects of the change in compression ratio on the energy with work, energy with exhaust gases and heat loss for the ethanol. The results shows that the energy with the exhaust gases decreases with the increase in compression ratios and energy with work and heat transfer increases with the increase in compression ratio for
the ethanol. It is because of the reason that pressure and temperature increases which results in increased heat loss through the cylinder wall and more indicated power is produced during expansion. The exhaust gases cooled down with the increase in compression ratios because most of the energy goes with work and heat transfer through wall which results in less energy transfer with the exhaust gases
.
56.20% 54.06% 52.20% 49.20% 47.80%
9.50% 10.70% 11.70% 14.10%
15.00%
34.30% 35.32%
36.10% 36.70%
37.20%
0.00% 20.00% 40.00% 60.00%
8 9 10 11 12
Fig.4 Energy distribution for Methanol
C
o
m
p
res
si
o
n
ra
ti
o
8 9 10 11 12
Work 34.30% 35.32% 36.10% 36.70% 37.20%
Heat loss 9.50% 10.70% 11.70% 14.10% 15.00%
Transfer with exhaust to
enviroment 56.20% 54.06% 52.20% 49.20% 47.80%
Work
Heat loss
International Journal of Emerging Technology and Advanced Engineering Website: www.ijetae.com (ISSN 2250-2459, Volume 2, Issue 8, August 2012)
489 4.5 Specific heats of different fuels
:
Figure 6, 7, 8, and 9 shows the change in specific heats at constant pressure and constant volume for the ethanol, methanol, iso-octane and LPG during compression, combustion, expansion and exhaust processes for the air fuel mixture. The values of specific heats increases with the increase in temperature of the air fuel mixture of all the fuels examined which results in more specific heats during combustion which is calculated at mean temperature of T2+T3/2. The
values of specific heats for the iso-octane and
LPG are significantly lower than the ethanol and methanol during compression, combustion and exhaust. The specific heat of ethanol during compression is 0.59% higher than methanol and 1.9% greater than the iso-octane and LPG. The specific heats of methanol during combustion are 0.6%, 4.59% and 2.16% higher than ethanol, iso-octane and LPG respectively. The specific heats of methanol during exhaust are 2.2%, 5.4% and 4.1% higher than ethanol, iso-octane and LPG respectively.
54.5 51.9 50.3 48.7 46.8
12.4 13.7
14.4 15.5 17.1
33.1 34.4
35.3 35.8 36.1
0 10 20 30 40 50 60
8 9 10 11 12
Fig.5 Energy distribution for Ethanol
C
o
m
p
res
si
o
n
ra
ti
o
8 9 10 11 12
Work 33.1 34.4 35.3 35.8 36.1
Heat los 12.4 13.7 14.4 15.5 17.1
Transfer with exhaust to
enviroment 54.5 51.9 50.3 48.7 46.8
Work
Heat los
International Journal of Emerging Technology and Advanced Engineering Website: www.ijetae.com (ISSN 2250-2459, Volume 2, Issue 8, August 2012)
490
V. CONCLUSIONS
It is concluded from this study that the energy with the exhaust gases decreases with the increase in compression ratio and energy with work and heat transfer increases with the increase in compression ratio for all the fuels examined. The specific heats of all the fuels increases from compression to the combustion and decreases slightly during exhaust stroke. This variation in specific heats are taken into consideration while calculating energy distribution in different
processes of otto cycle. Energy with work are almost close to each other for all the fuels examined and energy with work for methanol and LPG are higher about 2.21% from ethanol and iso-octane because of their higher adiabatic flame temperature. Energy with exhaust gases of methanol are higher about 4%, 4.78% and 3.83% for iso-octane, LPG, and ethanol respectively. It is because of the reason that specific heat at constant volume is lower for iso-octane and LPG 0 0.2 0.4 0.6 0.8 1 1.2 1.4 1.6
0 2 4
Va lu es o f C p & C v (k j/k gk )
Fig.6 1. compression 2. Combustion 3. Exhaust
Ethanol Cp Cv 0 0.2 0.4 0.6 0.8 1 1.2 1.4 1.6
0 1 2 3 4
Va lu es o f C p & c v ( Kg/k jK)
Fig.7 1. Compression, 2. Combustion, 3. Exhaust
Methanol Cp Cv 0 0.2 0.4 0.6 0.8 1 1.2 1.4 1.6
0 1 2 3 4
V al u es o f Cp & c v ( K g/k jK )
Fig.8 1. Compression, 2. Combustion, 3. Exhaust
Iso-octane Cp Cv 0 0.2 0.4 0.6 0.8 1 1.2 1.4 1.6
0 1 2 3 4
V al u es o f C p & c v ( Kg/kj K)
Fig.9 1. Compression, 2. Combustion, 3. Exhaust LPG
Cp
International Journal of Emerging Technology and Advanced Engineering Website: www.ijetae.com (ISSN 2250-2459, Volume 2, Issue 8, August 2012)
491
than the oxygenated fuels. Energy with heat loss of iso-octane are higher about 1.78%, 19.86% and 1.36% for LPG, methanol and ethanol, respectively. Ethanol, methanol, and LPG can be used as alternative fuels in spark ignition engines as a pure fuel or as a blending with iso-octane.
REFERENCES:
[1] Al-Baghdadi, M. A. R. S. 2006 A simulation model for a single cylinder four-stroke spark ignition engine fueled with alternative fuels. Turk. J. Eng.Environ. Sc.
Vol. 30, pp. 331–350.
[2] Kowalewicz, A., and Wojtyniak. M.2005 Alternative fuels and their application to combustion engines. Proc. Inst. Mech. Eng., Part D, Vol.219, pp. 103–124. [3] Ahouissoussi, N. B. C., and Wetzstein, M. E. A.1997
comparative cost analysis of biodiesel, compressed natural gas, methanol and diesel for transit bus system.
Resour. Energy Econ, Vol. 20, pp. 1–15.
[4] Sezer, I., and Bilgin, A.2008 Effects of methyl tert -butyl ether addition to base gasoline on the performance and CO emissions of a spark ignition engine. Energy Fuels, Vol. 22 No.2, pp. 1341–1348.
[5] Sezer, I.2002 Experimental investigation of the effects of blending methanol and MTBE with regular gasoline on performance and exhaust emissions of SI engines. M.S. Thesis, Karadeniz Technical University,Trabzon, Turkey, (in Turkish).
[6] Shenghua, L., Clemente, E. R. C., Tiegang, H., and Yanjv, W.2007 Study of spark ignition engine fueled with methanol/gasoline fuel blends. Appl Therm. Eng,
Vol. 27 No.11-12, pp. 1904–1910.
[7] Bayraktar, H.2005 Experimental and theoretical investigation of using gasoline-ethanol blends in spark-ignition engines. Renewable Energy, 2005,
[8] Gao, J., Jiang, D., and Huang, Z, Spray 2007 properties of alternative fuels: A comparative analysis of ethanol-gasoline blends and ethanol-gasoline, Fuel, Vol. 86, pp. 1645– 1650.
[9] Heywood, J.B.1988 Internal combustion engine fundamentals, McGraw-Hill, New York.
[10] Taylor, C.F.1966 The internal combustion engine in theory and practice, MIT Press, Cambridge, Mass. [11] Sobiesiak, A., Zhang S. The first and second law
analysis of spark ignition engine fuelled with compressed natural gas, SAE paper.
[12] Moran M.J.1989 Avalability analysis – a guide to efficient energy use. Corrected ed, The American Society of Mechanical Engineers: New York.
[13] Demirba, A.2005 Fuel properties of hydrogen, liquefied petroleum gas (LPG), and compressed natural gas for transportation, Energy SourcesPart A : Vol 27.. [14] Annand, W.J.D.1963, Heat transfer in the cylinder of
reciprocating internal combustion engines, proc. Inst. Mech. Eng, Vol. 177 No.36, pp. 937-990.
[15] Mohammadi, A., Yaghoubi, M. and Rashidi, M. 2008 Analysis of local convective heat transfer in a spark ignition engine, International communication in Heat and Mass Transfer,Vol. 35, 2008, pp. 215-224. [16] Woschni, A.1963 A universal applicable equation for