INSTRUMENTATION OF CERAMIC/ METAL
INTERFACES IN NEXT GENERATION AERO
GAS TURBINES
Richard Stephen Shepherd
Centre for Advanced Materials and Surface
Engineering
University of Salford, Salford, UK
This report is submitted as partial fulfilment of a Total Technology PhD course. The aims of the Total Technology course are to bring together the best aspects of a conventional PhD with the commercial focus generated by linking the research with a major industrial enterprise. The practice of engineering comprises people, planning, research, development, design, production, finance and marketing. These aspects of industry-based research projects are recognised by a Total Technology course. The situation may naturally arise that the needs of the company are reasonably taken into account when formulating the overall research programme. In this case the author is a full time employee of Rolls-Royce based in Derby. The author's responsibility includes the setting up and day-to-day management of a corporate facility for the production of thin film sensors. This involves the application of low temperature sensors when required by engine development projects and the co-ordination of the research strategy for high temperature research.
TABLE OF CONTENTS
Preface I
Contents II
List of tables VIII
List of illustrations X
Acknowledgements XVI
Nomenclature XVII
Abbreviations used XVIII
Abstract XIX
Aims and objectives XX
CHAPTER 1 INTRODUCTION
1.1 Introduction 1
1.2 Use of measurement techniques during aero gas turbine
development 3
1.2.1 Temperature measurements 3
1.2.2 Vibration measurements 5
CHAPTER 2 REVIEW OF STRAIN GAUGES AND MATERIALS
2.1 Principles of a strain gauge 9
2.2 Strain gauge materials 11
2.3 Rolls-Royce produced high temperature strain gauges 14
2.4 Limitations of conventional strain gauging 16
CHAPTER 3 REVIEW OF TEMPERATURE MEASUREMENT TECHNIQUES
3.1 Component temperature measurement methods 19
3.2 Thermocouple sensor theory 21
3.3 Thermocouple materials 22
3.4 Embedded thermocouples 24
3.5 Uncertainty analysis of embedded thermocouple sensors 25
CHAPTER 4 LITERATURE REVIEW-THIN FILM SENSORS
AND PROCESSES
4.1 Thin film sensors 27
4.1.1 Strain gauge measurements 29
4.1.2 Temperature measurements 30
4.2 Sputter deposition techniques
4.2.1 Diode sputtering 32
4.2.2 Magnetron sputtering 33
4.2.3 Film purity 34
4.2.4 Film structure 35
4.2.5 Deposition of multi-component alloys 36
4.3 Insulator coatings
4.3.1 Choice of materials 37
4.3.2 Reactive sputtering 40
4.3.3 Arcing during reactive sputtering 41
4.3.4 Pulsed de power supplies 43
CHAPTER 5 PROJECT PROPOSAL
5.1 Introduction 47
5.2 Feasibility study 47
5.3 Feasibility study trial 54
5.4 Statement of Originality 56
5.5 Conclusions 56
CHAPTER 6 FACILITIES USED AND PROJECT
MANAGEMENT ACTIVITIES
6.1 Introduction 58
6.2 Deposition facilities 58
6.3 Patterning facilities 61
6.4 Thin film analysis techniques 63
6.4.1 Auger Electron Spectroscopy 63
6.4.2 Energy Dispersive Spectroscopy 64
6.4.3 Choice of analysis technique 66
6.4.4 Talysurf profiler 66
6.5 Facilities upgraded for this project 67
6.6 Project plan 69
6.7 Risk Management 73
6.7.1 Risk assessment 74
6.7.2 Risk monitoring 76
CHAPTER 7 MAGNETRON SPUTTERING OF NiCoCrAlY
7.1 Introduction 77
7.2 Design of experiment 78
7.3 Experimental detail 81
7.3.2 Coating details 82
7.3.3 Measurement of deposition rate 83
7.3.4 Assessment of film structure 84
7.3.5 Measurement of film composition 84
7.3.6 Analysis of results from experiment design trial 84
7.4 Results 87
7.4.1 Analysis of deposition rate 87
7.4.2 Analysis of film structure 89
7.4.3 Analysis of film composition 99
7.5 Discussion of results 101
CHAPTER 8 OPTIMISATION OF NiCoCrAlY PROCESS
8.1 Introduction 103
8.2 Further coating assessment work 104
8.2.1 Heat treatment of samples 104
8.2.2 Evaluation of substrate preparation 107
8.3 Transfer of process to Sinfin-A site system 111
8.4 Improvement in Al content 115
8.5 Deposition problems associated with target wear 117
8.5.1 Test of magnetic field strength, H, of
AJA A-330 3-inch diameter cathodes 118
8.6 Conclusions 121
CHAPTER 9 DEPOSITION OF INSULATOR COATING
9.1 Introduction 123
9.2 Setting up of power supply and system 124
9.2.1 Arcing problems encountered during process 126 9.3 Evaluation of coatings produced by reactive sputtering process 129
9.3.2 Results 130
9.4 Evidence for nodular defect growth 131
9.5 Effect of substrate roughness on nodular defect growth 132 9.6 Effect of bias voltage on nodular defect growth 134
9.6.1 Experimental detail 134
9.6.2 Results 134
9.7 Conclusions 138
CHAPTER 10 SENSOR DEVELOPMENT
10.1 Introduction 140
10.2 Development of patterning techniques
10.2.1 Lift-off patterning process 141
10.2.2 Application of photoresist 143
10.2.3 Positioning of mask on component 147
10.2.4 Summary of patterning techniques 148
10.3 Platinum-Rhodium deposition and sensor evaluation
10.3.1 Initial work 148
10.3.2 Results of initial work 150
10.3.3 Calibration of Pt-Rh thermocouple against
wire thermocouple 152
10.3.4 Conclusions 155
10.4 Platinum-Tungsten deposition and evaluation
10.4.1 Initial testing 156
10.4.2 Temperature testing of Pt-W thin film sensors 157 10.4.3 Calculation of gauge sensitivity of
as-deposited Pt-W gauges 159
10.4.4 Investigation of the effects of deposition
parameters and gauge design on gauge sensitivity 160
10.4.5 Conclusions 163
10.5 Palladium-Chromium deposition and sensor evaluation
10.7 Conclusions 171
CHAPTER 11 INTEGRATION OF PROCESSES INTO SENSOR
PACKAGE
11.1 Introduction 173
11.2 Batch 1 trial
11.2.1 Experimental detail 173
11.2.2 Batch 1 results 177
11.3 Batch 2 trial
11.3.1 Experimental detail 182
11.3.2 Results 185
11.4 Batch 3 trial
11.4.1 Experimental detail 189
11.4.2 Results 191
11.5 Conclusions 194
CHAPTER 12 PROJECT CONCLUSION AND
RECOMMENDATIONS FOR FUTURE WORK
12.1 Project Summary 197
12.2 Project conclusion 201
12.3 Recommended future work 203
CHAPTER 13 REFERENCES 205
LIST OF TABLES
TABLE DESCRIPTION
2.01 Relevant portion of periodic table of elements (Bertodo)
2.02 Effect of variation of composition on electrical properties of Pt-W strain gauges
3.01 Comparison of various thermocouple types (taken from Bedwell) 4.01 Sputter yields of various materials relative to Al (taken from CVC
information bulletin)
5.01 Thermal barrier coat processing route
6.01 Likelihood and consequence chart for the project 6.02 Selected risks from the project
7.01 Process parameters that could be varied during the deposition of metallic coatings
7.02 Experiment parameters with high and low level values
7.03 The 16 treatment combinations divided into two blocks for a fractional factorial experiment
7.04 Experiment design showing the levels of each parameter for the eight coating runs
7.05 Composition of NiCoCrAlY powder, (Rolls-Royce specification MSRR 9537/1), used to form sputtering target
7.06 Composition of CMSX-4 single crystal blade alloy (MSRR 7248) 7.07 Coating details of NiCoCrAlY trials
7.08 Expanded Yates table gives values for interactions of variables in terms of experiment results
7.09 Table of results showing the deposition rate, qualitative assessment of structure and composition of coatings
deposited on differently prepared CMSX-4 substrates 8.02 Percentage of Al in NiCoCrAlY . coating for various runs
8.03 Results from measurement of magnetic field strength of AJA cathode 9.01 Summary of coating parameters
9.02 Analysis of composition of aluminium oxide coating by AES 9.03 Results from bias trials on nodular defect growth
10.01 Study of parameters used to deposit PtRh by dc magnetron sputtering 10.02 Results of compositional analysis of PtRh coatings deposited using
different parameter levels
10.03 Deposition parameters for PtRh thermocouple
10.04 Measurement of gauge factor of Pt8%W thin film gauges 10.05 Study of parameters used to deposit PtW strain gauges 10.06 Results of experiment design
10.07 Deposition conditions for thin film coatings on hydraulic pipe fitting 10.08 Deposition sequence for stage 6 stator PtW dynamic strain gauges 11.01 Process parameters for batch 1 samples
11.02 Comparison of Al content in NiCoCrAlY coating runs on sample 1 of batch 1
-11.03 Deposition parameters for batch 2 samples 11.04 Deposition parameters for batch 3 coatings
LIST OF ILLUSTRATIONS
FIGURE DESCRIPTION
1.01 General layout and temperatures of an older (lower temperature)
RB211 engine (taken from Loftus)
1.02 Blade cooling arrangement on a turbine component (taken from The Jet Engine)
1.03 Vibration modes for a compressor blade (taken from Smailes)
1.04 Campbell diagram of vibration frequencies against engine speed (taken from Smailes)
2.01 General view of a strain gauge
2.02 Conventional high temperature strain gauge 3.01 Turbine temperature measurement techniques
3.02 Variations in thermoelectric power of some elements and alloys relative to platinum with cold junction at 0°C. (taken from Greenwood)
3.03 A simple thermocouple circuit and electrical equivalent (taken from Bedwell)
3.04 Embedded thermocouple
4.01 Thin film and conventional ceramic cement strain gauges mounted on the surface of compressor blades.
4.02 Magnetic field line arrangement in magnetron sputtering (taken from CVC training material)
4.03 Influence of substrate temperature and argon pressure on microstructure of sputtered metallic coatings (taken from Thornton) 4.04 Variation of electrical conductivity for insulation materials
(Information from Bauer)
4.05 Effect on deposition rate of oxygen partial pressure. Values shown are from previous Rolls-Royce work.
4.07 Simple model of arcing formation during a reactive sputter process (taken from Schiller)
4.08 Principle of pulsed DC sputtering to prevent arcing on target face. Upper (charging of insulating film to positive potential). Lower (preferential sputtering of insulating film). Taken from ENI technical note.
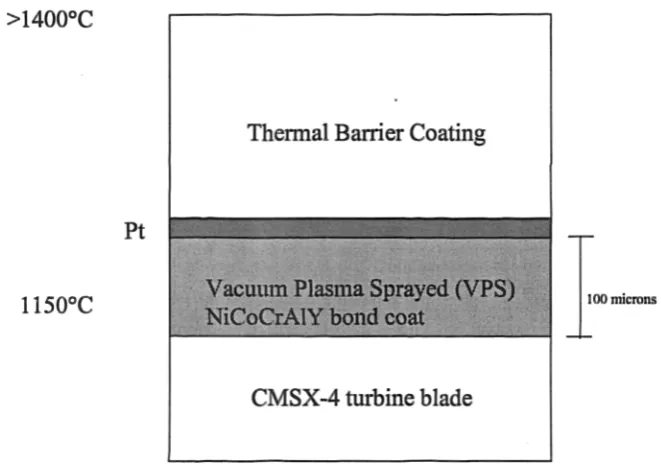
4.09 Processing route for low temperature dynamic strain gauge patterning 5.01 Thermal barrier coat arrangement
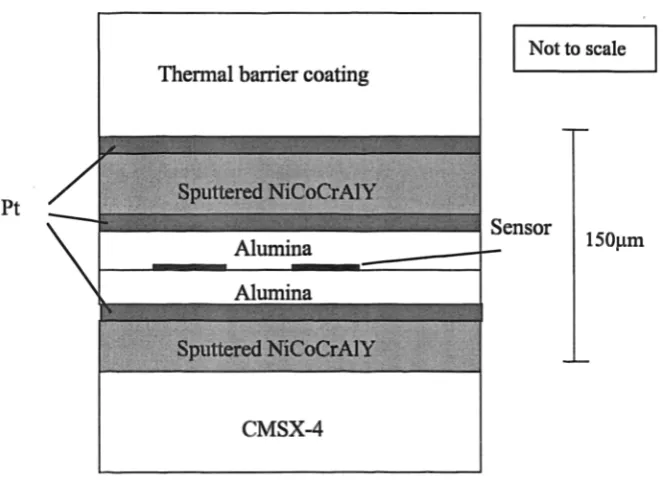
5.02 Proposed sensor package
5.03 Variation of insulation resistance of aluminium oxide with temperature
5.04 Effect of leakage resistance on potentiometric circuits
5.05 Feasibility study sample heated to 1100°C for 1 hour in vacuum 6.01 Sinfin-A site CVC 703S deposition chamber
6.02 Substrate geometry of the CVC system (taken from CVC operating manual)
6.03 Class 100 laminar flow chemical workstation
6.04 Project plan
6.05 Risk monitoring during the project 7.01 Proposed sensor package
7.02 Effect of parameters on deposition rate of NiCoCrAlY
7.03a Scanning electron microscope image of NiCoCrAlY coating for qualitative assessment of coating structure: Run 371, graded 10/10 7.03b Scanning electron microscope image of NiCoCrAlY coating for
qualitative assessment of coating structure: Run 374, graded 9/10 7.03c Scanning electron microscope image of NiCoCrAlY coating for
qualitative assessment of coating structure: Run 370, graded 7/10 7.03d Scanning electron microscope image of NiCoCrAlY coating for
qualitative assessment of coating structure: Run 376, graded 6/10 7.03e Scanning electron microscope image of NiCoCrAlY coating for
7.03f Scanning electron microscope image of NiCoCrAlY coating for qualitative assessment of coating structure: Run 373, graded 4/10 7.03g Scanning electron microscope image of NiCoCrAlY coating for
qualitative assessment of coating structure: Run 375, graded 2/10 7.03h Scanning electron microscope image of NiCoCrAlY coating for
qualitative assessment of coating structure: Run 369, graded 1/10 7.04 Effect of parameters on NiCoCrAlY structure
7.05a Effect of parameters on Al content of NiCoCrAlY coating 7.05b Effect of parameters on yttrium content of NiCoCrAlY coating
8.01a Heat-treated NiCoCrAlY coatings on vapour blasted substrates. Upper (run 371 graded 10/10), middle (run 373 graded 4/10) and lower (run 374 graded 9/10)
8.01b Heat-treated NiCoCrAlY coatings on vapour blasted substrates. Upper (run 368 graded 5/10), middle (run 369 graded 1/10) and lower (run 370 graded 7/10)
8.01c Heat-treated NiCoCrAlY coatings on vapour blasted substrates. Upper (run 375 graded 2/10) and lower (run 376 graded 6/10)
8.02 Comparison of interface voids from run 371 with vapour blast (top) and dryblast (lower) prepared substrates
8.03 Comparison of number of voids after heat treatment at CMSX-4 — NiCoCrAlY interface from different ion cleaning times prior to deposition on of NiCoCrAlY coating: 30 minutes (top), 60 minutes (middle) and 90 minutes (lower)
8.04 NiCoCrAlY coatings deposited on 120/220 grit dryblast substrate without bias (upper) and with 100V bias (lower) during deposition 8.05 NiCoCrAlY deposited onto CMSX-4 substrate prepared to 240
(upper) and 400 grade (lower) abrasive paper
8.06 NiCoCrAlY coating deposited onto CMSX-4 substrate prepared to 240 grade abrasive paper (upper) and 400 grade abrasive paper with 100V bias during deposition (lower)
8.09 Magnetic field strength of AJA cathode with various targets 9.01 EM RPG-50 power supply connection diagram
9.02 Voltage and current waveforms of EM RPG-50 power supply at 100kHz
9.03 Al sputtering target showing arcing sites and oxide band 9.04 Photograph of arc sites and race track defects on Al target 9.05 Nodular defect in aluminium oxide coating
9.06 Scanning electron microscope image of aluminium oxide coating 9.07 Aluminium oxide coating deposited onto glass slide (upper) and
silicon wafer (lower)
9.08 Aluminium oxide coating deposited onto glass slide with 60 volts radio frequency bias
9.09 Aluminium oxide coating deposited onto glass slide with 100 volts radio frequency bias
9.10 Aluminium oxide coating deposited onto glass slide with 140 volts radio frequency bias
9.11 Aluminium oxide coating deposited onto glass slide with 180 volts radio frequency bias
10.01 Lift-off patterning technique
10.02 Photoresist spinner with mechanical clamp to hold small complex shaped components during photoresist application
10.03 Dipping machine for the application of photoresist on large and heavy components
10.04 Variation of photoresist thickness with dipping machine speed and photoresist viscosity
10.05 Latex glove vacuum clamp used to hold mask patterns against sample 10.06 Composition depth profile of failure interface of PtRh to aluminium
oxide using an adhesion promotion layer of nickel
10.08 Flow chart for production of one leg of the thermocouple circuit 10.09 Thermoelectric output of thin film and conventional wire
thermocouples
10.10 Temperature coefficient of resistance of PtW strain gauges Where Rh=hot resistance and Re=cold resistance.
10.11 Time-dependent change of resistance of PtW strain gauge at 600°C 10.12 Comparison of different gauge designs used
10.13 Surface defects on PdCr coating on glass slide
10.14 Hydraulic pipe fitting with NiCr strain gauges shown as an example on patterning on a complex component
10.15 Compressor stator with PtW strain gauges as an example of patterning on a complex component
10.16 AES depth profiling of component surface in area of sensor failure 11.01 Summary of the batch trials
11.02 Summary of batch 1
11.03 Processing route for the batch 1 samples. The NiCoCrAlY coated and heat-treated CMSX-4 substrates were taken from earlier work.
11.04 Heat-treated batch 1 samples; sample 2 (upper) and sample 1 (lower) 11.05 Optical microscope photograph of cross-section through sample 1 of
the batch 1 sensor package
11.06 Cross-section through sensor package of sample 1 in batch 1 11.07 Cross-section through sensor package showing aluminium oxide
removal
11.08 CMSX-4 substrate, NiCoCrAlY +Pt +oxide and upper oxide layers near a sectioned edge showing machining marks (left) and upper aluminium oxide film (right)
11.09 Scanning electron microscope image of machining marks as seen on surface of CMSX-4 (right) and aluminium oxide film (left)
11.10 Summary of batch 2
11.11 Processing route for batch 2 samples 11.12 Photograph of a batch 2 sample
coating
11.15 Cross-section through the sensor showing metallic coating defining the top of the oxide layer
11.16 Cross-section of substrate showing insufficient removal of aluminium oxide coating
11.17 Summary of the batch 3 package 11.18 Processing route for batch 3 samples 11.19 Photograph of a batch 3 sample
11.20 Surface features of NiCoCrAlY upper coating showing cracks and a large number of defects
A-1 Rf filter unit
A-2 Amplifier/Isolator unit
A-3 Display/Power module
The author particularly wishes to thank Professor R. D. Arne11 and Mr. P. Loftus for their support throughout the project.
The author is grateful to his local and senior management at Rolls-Royce for the opportunity and funding to pursue this work as a three year Ph.D. Financial support from the E.P.S.R.0 is also acknowledged. The advice and support of the author's colleagues at Rolls-Royce has been greatly appreciated on many occasions. Particular thanks go to Mr. J. Gent and Mr. M. Keogh for their assistance with the NiCoCrAlY deposition trials, Mr. E. Brown and Mr. B. Hollingworth for their assistance with the sensor patterning works and Mr. M. Marshall for assistance in running the thin film facility. Also the author would like to thank Dr. G.W. Critchlow from Loughborough University for this assistance with the Auger analysis.
ATP Absolute Thermoelectric Power (Chapter 3) !WPC
B Magnetic Flux Density Tela
E electron charge Coulomb
D strain gauge wire diameter m
EMF Electromotive force V
H Magnetic Intensity kAim
I Gauge excitation current Amps
/ Gauge length m
m Mass of an electron kg
r radius of electron orbit m
R Electrical resistance Q
Ra Average surface roughness m
St Gauge sensitivity dimensionless
t Time s
T Temperature °C
AT Temperature change °C
Te Cold thermocouple junction temperature °C
Th Hold thermocouple junction temperature °C
T. Melting temperature °C
3 Target potential Volt
a Temperature coefficient of electrical resistance SI/D-/° C
AE Apparent strain dimensionless
d Wire gauge diameter m
I Excitation current Ampere
p Gauge resistivity S-2m
Pw Temperature coefficient of expansion of
gauge element m/m/°C
13. Temperature coefficient of expansion of
AES Auger Electron Spectroscopy
ATP Approved Technical Package (Chapter 6)
DC Direct Current
CAD Computer Aided Design
CMSX-4 Cannon-Muskegon Single crystal no. 4 material EDM Electro Discharge Machining
EDS Energy Dispersive Spectroscopy
GE General Electric Inc, USA
HP High pressure
IHI Ishikawajima-Harima Heavy Industries, Japan INCO Inconel blade alloy
Karma Trade name for nickel chromium alloy with other additives
rpm
Institute of Precious Metals, ChinaLP Low pressure
ME Measuring element
MSRR Rolls-Royce material specification
MTU Motoren-und Turbinen-Union, Germany
NASA National Aeronautical and Space Administration, USA NiCoCrAlY Nickel-Cobalt-Chromium-Aluminium-Yttrium alloy
ONERA Office National d'Etudes et de Recherches Aerspatiales, France PVD Physical vapour deposition
RF Radio frequency (13.56 MHz)
SEM Scanning electron microscope TBC Thermal barrier coating
VPS Vacuum Plasma Spray
Zone I-III Movchan-Demchishin zones from Thornton model A-F Parameters or interactions in experiment design
The growth of thrust and improved aeroengine efficiency has been gained by increased temperatures throughout the engine. This has been achieved by improved material technology and the continuous cooling of components complemented by the addition of thermal barrier coatings (TBC) to turbine and combustion chamber components. The aggressive nature of the application process of the TBC has previously made the measurement of metal surface temperature and strain exceedingly difficult on components to which it is applied.
In the present study magnetron sputter-deposited thin film sensor techniques have been developed specifically for compressor and turbine applications of noble metal thermocouples and strain gauges. The deposition, patterning and evaluation of reactively sputtered aluminium oxide, type R platinum thermocouples as well as PdCr and PtW dynamic strain gauges is reported. A sputtered NiCoCrAlY coating has been developed to replace the vacuum plasma spray process currently used in the TBC system. The most favourable location for the thin film sensor is at the metal/ceramic interface of the TBC system. However, in order to protect the sensor from the aggressive TBC process, the sensor has been deposited in a novel installation between two layers of NiCoCrAlY bond coat. Several trials have been performed to fabricate this package on turbine blade material substrates.
The work was carried out as a total technology PhD and was therefore broad in basis. In this case, the aim was to develop a solution to the problem of measuring temperature and strain on thermal barrier coated components. The solution identified and studied in this work involved developing a process to apply thin film sensors to the turbine components prior to the application of thermal barrier coatings.
In order to achieve this, a number of supporting processes needed to be developed. These included:
1. The magnetron sputtering of several layers of NiCoCrAlY to replace the currently used VPS process.
2. The development of a defect free high temperature electrical insulation layer based on the reactive sputtering of aluminium oxide.
3. The deposition, patterning and evaluation of Pt-8%W & Pd-13%Cr for high temperature dynamic strain gauges.
4. The deposition, patterning and evaluation of Pt/PtRh thin film thermocouples for turbine temperature measurements.
5. Improvement of the sensor patterning technique and more specifically the development of a lift-off patterning technique.
6. The integration of these processes into a sensor package
Chapter 1: Introduction
1.1 Introduction
The rapid expansion in civilian air transport since the 1950's has been, in part, due to the development of the gas turbine (jet) engine enabling easier long distance travel. This has fuelled a boom in tourism, both for commercial and leisure purposes. Developed in the 1930's for military uses, the jet engine now forms the basis for long distance transportation on fixed wing aircraft, short haul transport (with helicopters) and has been adapted for military ship propulsion, power generation and industrial oil and gas compression pumping.
Rolls-Royce is one of the world leaders in the design and manufacture of aero gas turbines. Founded in 1906 by the Hon. Charles Stuart Rolls and Henry Royce, the company initially produced high quality motor cars but diversified into aircraft propulsion through internal combustion driven propeller engines, then later gas turbine engines. Now a multinational company operating in a number of sectors due to the acquisition of other companies, Rolls-Royce has a multibillion pound turnover.
Derby, the original site of the car producing company, is now the centre for commercial aero gas turbine development and production. Here, new engines for airframes such as Boeing and Airbus are designed and tested through to civil and federal aviation authority certification.
A key element in this, is development testing of new and existing engines. This is the main function of the experimental site. It is necessary to extract the maximum amount of information about the engine performance as early as possible in the test programme in order to reduce the number of tests required and the cost of the programme. It is also necessary to rigorously verify computer models of component performance on research rigs, in order to improve the design method and obtain a better product. Associated with this is a vast range of support services, one of which is the use (research, design and production) of sensor technology.
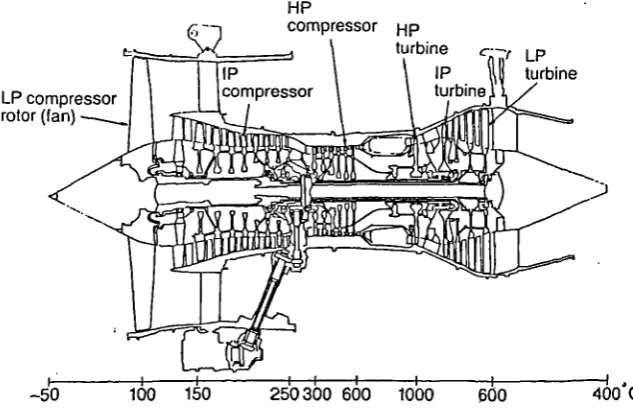
The environment in the engine can be quite arduous, with temperatures, for the latest Trent engine, ranging from -50°C to around 1480°C at the first turbine stage. The blades experience centripetal accelerations up to around 100,000g and dust particles impacting the surface at high velocity.
One area which has received a great deal of attention over the years has been aerofoil mounted instrumentation which provides information on, for example, temperature and strain. Lately, increased effort has been put into minimising the disturbance to the flow passing over the sensor, and to the component under test. A requirement had previously been established to develop a new sensor application technique, thin film sensors, to apply dynamic strain gauge sensors to compressor components. A corporate facility was set up by the author to research this technique and provide a sensor fabrication service using techniques that had previously been demonstrated by several subcontractors.
A new and growing requirement is to measure component temperature and strain on TBC components. This cannot be done using the conventional methods currently available. Without this, the risk to new engine development programmes, such as the Trent 500 engine for the Airbus A340, is increased.
HP
compressor
LP compressor rotor (fan)
HP
turbine c---7 LP IP turbine turbine
100 150
I f
250 300 600 1000
—50 600 400C.
[image:24.595.135.452.137.344.2]withstand the subsequent application of the TBC and the conditions; temperature and vibration, found in the High Pressure (HP) turbine (see figure 1.01).
Figure 1.01: General layout and temperatures of an older RB211 engine (taken from Loftus')
The current strain gauge and thermocouple methods were reviewed. The limitations of these sensors for high temperature turbine use were assessed, with particular reference to instrumentation on thermally barrier coated components. The benefits of thin film sensors for strain and temperature measurement were reviewed and a brief description of the application processes given.
..•
TURBINE BLADE
NOZZLE GUIDE VANE
▪ H.P. cooling air ▪ LP cooling air
PRE-SWIRL NOZZLES
1.2 Use of measurement techniques during aero gas turbine
development
1.2.1 Temperature measurements
[image:25.595.151.430.338.654.2]The growth of engine thrusts and improvement in thermal propulsive engine efficiency, have been partially gained by increased temperatures throughout the engine. This has been achieved by improved material technology and the continuous cooling of components so that operating temperatures can be increased without affecting blade and vane integrity (see figure 1.02). The component cooling is complemented by the addition of TBC to the turbine and combustion chamber.
Other improvements in engine design have been gained from 3-D compressor blades, manufacturing techniques such as the wide chord fan blade and the reduction in weight throughout the engine.
The measurement of surface metal temperatures can therefore asses the performance of these cooling measures and highlight hot spots in the combustion and turbine area. Future designs will increasingly involve reduced component cross-section and complexity of the cooling techniques. Most of the conventional methods for measuring surface temperature perturb the heat flow to and within the component. TBCs are also becoming increasingly used in modern engines to complement the air cooling of components. The aggressive nature of the bond coat process and temperature and atmosphere of the TBC process have previously made the measurement of metal surface temperature exceedingly difficult on components to which it is applied.
1.2.2 Vibration measurements
One of the most widely used measurement techniques at Rolls-Royce is component vibration analysis, normally by strain gauging. The main aim is to avoid any serious failures in the engine development process and to validate models on component behaviour that are used to set life in service figures. The secondary damage from a component failure in the multistage axial flow compressor or turbine of an aeroengine can be very severe. However, requirements for reducing vibration come into conflict with those of improving efficiency and reducing weight, the selling points of engines. Components are designed, for maximum efficiency, to have the minimum amount of airflow blockage and to be as light as possible. This makes them susceptible to high cycle fatigue.
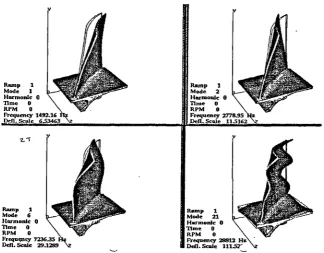
Ramp 1 Mode 1 Harmonic 0 Time 0 RPM 0 Frequency 1492.16 Dell. Scale 6.53463
Ramp 1 Mode 2 Harmonic 0 Time 0 RPM 0 Frequency 2778.95 Dell. Scale 115162
Ramp 1 Mode 6 Harmonic 0 Time 0 RPM 0 Frequvacy 723635 Del. Scale 29.1284)
Ramp 1 Mode 21 Harmonic 0 Time 0 RPM 0 Frequency 28812 He Deli. Scale
[image:27.595.128.453.392.645.2]11151-then becomes "which resonances can be lived with, and which are intolerable". Remedial action must then be taken to move the intolerable resonant frequencies. Each rotating blade is clamped at the root and will have a number of natural vibration modes. The modes have discrete vibration frequencies and deflected shapes. The mode shapes can be flap, bowstring, torsion and edgewise. (See figure 1.03). Some modes involve platform deflections as well as aerofoil deflections. Stationary stator vanes also have vibration modes, but these are bowstring-based because the stator is fixed at both ends. The vibration modes can be computer modelled for each component design, and the node positions and frequencies predicted. However, these frequencies can change whilst running-in an engine. The component material stiffness will reduce with increasing temperature. Therefore, the vibration frequency reduces with engine speed for small hot compressor components. Large cool blades experience stiffening under rotational forces. In this case flap frequencies increase with speed but torsion modes remain unaffected.
Figure 1.03: Vibration modes for a compressor blade (taken from Smailes3)
1.) z 2
a2n 4
cc 4(
• u. 3
resonance, compressor surge and component stall are less easy to predict, either in terms of the point of occurrence or the effect on the components. This necessitates experimental testing of the engine through the entire range of possible running conditions with a number of strain gauges fitted for safety monitoring of each blade vibration mode.
The components are excited at a number of frequencies, which are engine speed related. Each component will be excited by wakes of the stages upstream of it and interactions from components downstream. The number of components in the stage and engine speed determines the frequency of excitation. Each stage normally has different component numbers to avoid these problems. The number of components in a stage gives the 'engine order' number. The most significant engine orders are normally generated by rotor/stator interactions.
2nd. ToRSICA— ____7
_ _
•
140001,
3rd. BEND
TORSION
_1st.
— .
rioradipP
4_,
0111
Aden,WIM'oligi
r..,..,....ie
,-,_..o...
___
•-••-•
—glii ..,.__ --- _
i
l3:.
4 0I : 7 "--
FUNDA 'igjac:r=•
Fo
MAXIMUM SPEED .
• 0
0 40 - 60 80 100
•
FREQUENCY DIAGRAM FOR LARGE BLADE
[image:28.595.104.466.379.642.2]• . ORIGINAL VERSION
Figure 1.04: Campbell diagram of vibration frequencies against engine speed (taken from Smailes3)
a number of modes. Also, interactions; the sum and differences of engine orders will excite the component. Therefore two, rotor stages with 31 and 38 blades will produce engine orders of 31, 38, 7 and 69. Engine orders and interactions with stages far upstream or downstream are normally less likely to excite a component. Because the wakes of the components are non-sinusoidal, harmonics will also be present.
The engine orders and modes are represented on a Campbell diagram as shown in figure 1.043 . This shows a Campbell diagram for a large blade. The torsion modes can be seen to remain constant with engine speed while the flap modes increase in frequency with speed. The engine orders are seen increasing with engine speed. Many resonance positions are shown. Usually the higher frequency events are dismissed. This is because the exciting force tends to diminish with frequency. Also for high frequency modes the components are split into a number of zones which move in different directions. Generally, the forces on a component increase with airflow velocity or engine speed. Attention is thus focused on the lower right side of the Campbell diagram.
Of particular concern here would be the following:
1. The fundamental frequency approaches the engine rotational frequency. 2. The second bending mode is in resonance with two engine orders. 3. The 1st torsion mode is in resonance at 87% speed.
ME GAUGE
BACKING
GAUGE LENGTH
Chapter 2: Review of strain gauges and materials
2.1 Principles of a strain gauge
The electrical resistance (R) of a metal is, amongst other parameters, a function of its state of strain. This phenomenon has found applications in electrical resistance strain gauges, pressure transducers and load cells.
[image:30.595.112.465.383.626.2]A strain gauge consists of a measuring element (ME), a backing material and cement to bond the package to the component under test (See figure 2.01). The gauge has maximum sensitivity in the direction of the grid elements. The large area at the end of each grid element reduces the resistance that would cause cross-sensitivity of the gauge.
Figure 2.01: General view of a strain gauge
of resistance (a) to minimise variations in apparent strain due to changes in temperature. The resistance/temperature relationship should remain linear over the operating range and should be reproducible over many cycles of heating and cooling; The alloy should have good resistance to oxidation; It should have a high sensitivity to strain (S i), which should remain constant over the whole strain range and; The strain sensitivity /temperature relationship should be linear and reproducible.
None of today's materials meet all of these criteria, especially over the temperature range required by Rolls-Royce (ambient to above 1000°C). Therefore, several different materials are used to cover the range of operating temperatures4.
The sensitivity (S i) or Gauge Factor of the gauge is defined as:
st = AR
A
Equation 1.A
Where R is the resistance of the strain gauge and / is the gauge length. This is one of the design characteristics of a strain gauge. There are two contributions to this 5:
(i) The geometrical contribution, resulting from the changes in the ME geometry, which is almost equal in all metals, and;
(ii) The physical contribution, resulting from the changes in the resistivity of the measuring element with strain. This is very material sensitive.
The gauge backing should have the following virtues:
(i) Transfer the strain accurately and repeatably to the ME. (ii) High flexibility.
4 5 6
2.2 Strain gauge materials
Ideally, strain gauge materials are required for the measurement of steady strain. Most common resistance alloys before Bertodo 6 were based on binary or ternary alloys of the transition elements of groups 8, 9 & 10 of the 4th period of the periodic table, with each other, or with elements from group 6. Bertodo considered other alloys consisting of the elements shown in table 2.01. Elements of the fourth period having atomic numbers lower than chromium would not be suitable from a workability point of view. Those with atomic numbers higher than Ni have inadequate oxidation resistance. Alloys containing Mg are extremely complex. Group 11 alloys containing Au & Ag were studied but these had poor resistance to oxidation. Bertodo used the premise that alloys from the same periods had similar characteristics and so concentrated on period 5 and 6 alloys.
6 7 8 9 10 11
Cr Mn Fe Co Ni Cu
Mo Tc Ru Rh Pd Ag
W Re Os Jr Pt Au
Table 2.01: Relevant portion of periodic table of elements (Bertodo 6)
The criteria used to study these stemmed from the equation:
Ac =
i,_ fl.) 12„ .f( c_L_ flw , flm)AT± rt
ATS, ) Kd 3 S, ) S, Equation 2.
Where:
As =' Apparent strain, a = temperature coefficient of resistance, f3w --=-- temperature
The first part of the equation represents the effect due to gauge self-heating, the middle bracket due to temperature dependent effects and the last part due to time dependent resistance drift.
If the alloy satisfies the relationship:
a — = le s, w
Equation 3.
Then equation 2 reduces to:
A6= (fi n, +'-)
A T Equation 4.si
Here the short-term change in apparent strain would be governed by the thermal expansion of the substrate, which is predictable. The long-term drift will be a function of time dependent variables only. Thus the search for suitable alloys has concentrated on those materials that satisfy equation 3.
Of the 48 alloys studied by Bertodo 6 only 3 satisfied equation 3, namely Cu-Ni, Pd-Ag & Ni-Cr. None of these are suitable for high temperatures. Indeed, it was found that equation 2 was not compatible with high temperature alloys. As the sensitivity increases it becomes increasingly difficult to obtain a satisfactory alloy for the measurement of steady strains at high temperatures. Instead strain gauges are mainly used for the measurement of dynamic strain at high temperatures.
resistance (a) of 100g2/C2/°C and a strain sensitivity of 4. Resistivity measurements gave values of (p) in the range 78-79g2cm.
More recently in the 1980s, the NASA Lewis research centre has studied 34 PdCr alloys. These alloys form an adherent, self-protective scale of Cr 203, which resists additional oxidation of the remaining Cr7. The alloy containing 13% Cr was found to
be the optimum composition. Alloys containing more than 13 % Cr have poorer resistance to oxidation'. For fine drawn wires, Pd-Cr has exhibited a step change in resistance at 800°C but NASA Lewis have claimed that in thin film form the resistance change is linear to 1000°C9. This has been confirmed by
Ishikawajima-Harima Heavy Industries (IHI) and the results presented to Rolls-Royce as part of a collaborative venture'. The resistance to oxidation of this alloy can be improved by the addition of Y or Zr to the aluminium oxide overcoat layer. More recently, further work by NASA Lewis has shown that the addition of a Cr overcoat can gcoduce z. self-protective scale. Best results were obtained by oxidising the Cr overcoat in oxygen at 600°C. With this overcoat, dynamic strain gauge operation was demonstrated to over 1000°C11.
Work performed by the Institute of Precious Metals (IPM) in China has tried to improve the resistance to oxidation of strain gauges by alloying Pt with elements close to it in the periodic table 12'13• Resistance to oxidation was best for the alloy
Alloy Electrical Resistivity
[iC2 cm
Temperature Coefficient of
Resistance, x10-6 1°C
Strain Sensitivity
St
Pt-8%W 58 225 3.7-4.2
Pt-8.5%W 62 191 3.7-4.2
Pt-9%W 76 170 3.5
Table 2.02: Effect of variation of composition on electrical properties of PtW strain gauges".
The use of this gauge material for measuring static strains must be approached with caution. A PtW gauge will have an elastic limit of 5000p.614. The gauge factors often quoted are only valid within the elastic region. PtW has a temperature coefficient of expansion ( w) of 7.2 x10⁻⁶ 1°C. For a gauge bonded to a stainless steel substrate which has a temperature coefficient of expansion of 18x10-6 1°C, there will be an induced strain of 10.8 x10⁻⁶ 1°C 15. Thus, for a temperature rise from 20 to 800°C there will be an induced strain of 7770116, well beyond the elastic limit of PtW. Above the elastic limit, the gauge factor of PtW approaches 2.
Bethe and Schon 16 have shown that the sensor properties such as temperature coefficient of resistance, creep and strain sensitivity are; highly dependent on the sputtering conditions. Some important parameters are substrate temperature, argon pressure, residual gas (nitrogen, oxygen water vapour), deposition power and the geometry of the glow discharge. These can all affect the final sensor.
2.3 Rolls-Royce produced high temperature strain gauges
bonded sensor will perform satisfactory during an engine test. This type of sensor is used in a number of industries and the technique is well established.
However, above 300°C, it is difficult to find a backing material and adhesive combination that is acceptable. Since this is higher than most industries would use, Rolls-Royce have historically developed and manufactured their own gauges.
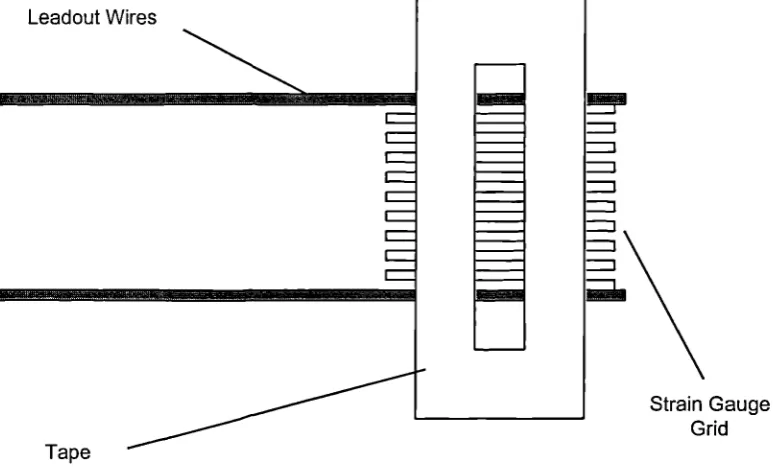
Leadout Wires
r--1071.:
[image:36.595.81.468.225.460.2]Strain Gauge Grid Tape
Figure 2.02: Conventional high temperature strain gauge
The blade surface is prepared by sand blasting. A number of thin layers of Rolls-Royce manufactured P354 ceramic cement are hand painted on. The gauge is applied to the component using the tape and further layers painted over the areas of exposed gauge. The tape is then removed and an overcoat of ceramic cement is applied over the whole gauge. Each layer must go through a curing cycle. The total thickness of the gauge is 3001.1m. The gauge has a sensitivity of approximately 4 at room temperature. This is routinely confirmed using a four point loaded bending beam at room temperature. The gauges can be applied 2.5 mm to the gauge centre from the aerofoil leading or trailing edge.
2.4 Limitations of conventional strain gauging
The uncertainty in low temperature dynamic strain gauge measurements is quite small and insignificant compared to the blade-to-blade variations in strain levels during a test. The uncertainty for high temperature applications becomes very large and is poorly quantified. The number and complexity of contributing error sources make an effective determination of the true error difficult"'18•19.
Installed gauges have a thickness of 3001.1m and this has a detrimental effect on the testing of the component. The strain gauge can disrupt the airflow over the component altering the component performance. There is a minimum size the wire gauges can be produced to, so on very small compressor components the ceramic cement may cover the aerofoil surface. The effect of this is very difficult to quantify but is of concern to Rolls-Royce performance engineers. The size of the installation limits the number of gauges that can be fitted to the component. This makes the analysis more difficult because vibration engineers would ideally like to study all the vibration modes on the same component to eliminate the effect of blade-to-blade variations.
component would not vibrate in the mode of interest once the strain gauge had been applied'. In the past a trial has been made to assess the difference between gauged and ungauged components using an optical blade tip timing technique. Unfortunately this was on quite large components and any difference was hidden by blade-to-blade variations'.
It is difficult to fit the sensors on complex components close to the blade leading and trailing edges and near the blade fillet radii. A normal design rule would be that the gauge centre cannot be specified less than 2.5 mm from a component edge or radius'.
The conventional techniques have been developed over a period of approximately 25 years and are considered a mature technology. The quality of the gauges is very operator dependent and requires strict quality control. Specialist technicians are used for this work. This makes the process slow and expensive. For high temperature gauges one trained technician could fit one gauge in an 8-hour shift, including the leadout wires. On a low-pressure turbine component, where the component temperature will be less than 600°C, a 25% failure rate of the gauges is expected. As the temperature increases to over 1000°C on the high-pressure turbine component, 75-100% of the gauges are expected to fail over the length of an engine test'. At extreme surface metal temperatures (1000°C plus) on HP turbine blades, the poor bonding of ceramic cements to the blade alloy may limit the survivability of the conventional gauges'. The fatigue life of wire/ cement gauges is poor: in the order of 1/10 that of low temperature stick on resin type gauges'.
2.4.1 Strain gauging on thermal barrier coated components
Chapter 3: Review of temperature measurement techniques
3.1 Component temperature measurement methods
A review has been made of the various component temperature measurement methods available to Rolls-Royce'". These are shown in figure 3.01. The techniques can be divided into optical non-contacting and contacting techniques. Of the latter, thermal paints are used regularly on engine development programmes, and embedded thermocouples on specialist turbine and combustion research projects. Luminescence thermometry, thin film thermocouples and thermal melts are under development to complement or replace the existing techniques. Radiation pyrometry and thermal paints need further development to extend their high temperature capability to the higher turbine temperatures found in modern engines. Contacting techniques are preferred because they give a direct measurement of temperature. However, contacting techniques tend to be very expensive, requiring dedicated tests or expensive telemetry systems, and technically very challenging due to the harsh environment. Optical non-contacting techniques can give a cheaper alternative but access for these line-of-sight systems is often limited. Also, large errors can result from the reflection of radiation from the combustion chamber off the surface of interest.
Non-contact techniques
Thin film thermocouples
Development technique to enable measurements of greater positional certainty and larger number of sensors per component.
Thermal paints
Established technology allowing large area coverage Dedicated, one shot test. Temperature presently limited to 1100°C, however, further development work to increase temperature capability ongoing.
Thermal melts
Calibration tool for thermal paints and radiation pyrometry. Low temperature experience with Silver paste to 960°C. Gives one isotherm on component between melted & un melted alloy.
Radiation Pyrometry
Line of sight imagine of turbine surface radiance. can give qualitative 2D map of entire stage in real time. Large uncertainty on absolute temperature.
Reflections from combustion chamber can cause large errors.
Luminescence Thermometry
Relies on measurement of decay time of phosphor after excitation with laser source. Line of sight single point measurement. Under development with initial 1100°C temperature limit.
Embedded thermocouples
Standard technique for non TBC components. Not presently available on TBC components. Error in measurements due to size of thermocouple junction. Low number of sensors per component.
fr
Contacting techniques
Temperature (C)
3.2 Thermocouple sensor theory
A metal consists of a lattice of positively charged atoms and a 'sea' of valence electrons, which dictate the electrical properties of the metal. The energy state of the electrons is a function of their temperature. When two ends of a metal conductor are at different temperatures, electrons will flow from the high-energy hot end to the lower-energy cool end thus generating an electromotive force (EMF). This is known
as the Seebeck effect. The absolute thermoelectric power (ATP) for a material is expressed as the EMF generated per degree C of temperature difference. This has units of !WM.
Variation with temperature of the emf of common thermoelements relative to platinum with one junction at 0°C.
_ 8Cala20C: Alumei Alurninium - Cadmium - Calcium - Cerium - Chrome! P - c - Constants!) CoPPer -God - Indium - Iron - Lesi - Latium - Magnesium - Mercury
Moilkdenum - Nickel °amain Peiladium - Manure - Rhodium Ruthaniurn - Saver - Tantzium - Thcrium -Tin -Tungsten - Zino
Figure 3.02: Variations in thermoelectric power of some elements and alloys relative to platinum with cold junction at 0°C (taken from Greenwood32) Other sources of this information: Kaye & Laby28, Finch29, L1de30, Nfichalskim
The crystal lattice of the metal can be modified by the addition of impurities, such as
of temperature. By utilising the thermoelectric power of two different metals or alloys into an electric circuit, we have the basis of a measurement system.
Materials can be classified in terms of their thermoelectric polarity. A positive material is one in which the EMF increases with temperature. Information on the EMF is available from many sources including suppliers' literature. The information is presented well in Greenwoodn. Different materials are shown relative to pure Pt in figure 3.02;. This shows that a circuit comprising materials with different ATP's will give a net output.
Thermocouples can be categorised as noble metal, base metal, high temperature or refractory or non-metal'''. The family of elements consisting of Au, Ag, Rh, Pd, Jr and Pt are commonly referred to as noble metals, which are relatively inert. Their use in thermocouples stems from their stability and absolute EMF. Certain base metals such as Cu, Fe, Ni, Al and Cr, as well as their alloys with additional impurities can be combined to produce thermo-elements with desirable properties. A simple thermocouple circuit and electrical equivalent are shown in figure 3.03.
3.4 Thermocouple materials
VOLTMETER FURNACE
V2
V3
thermocouple hot junction may elevate the junction temperature above the surroundings'.
THERMOCOUPLE LEADS
COPPER LEADSD
_,
ICE BATHTEMPERATURE
ilL
ROOM TEMPERATURE
I.
POSITION ' 0
NETT VOLTAGE VI + V2 - V3 - V4
Figure 3.03: A simple thermocouple circuit and electrical equivalent (taken from Bedwel136)
Common Names of
Alloys
Temperature Range
(short term)
Output
(0//°C)
Cost Stability Cable
Spec
Copper/Constantan -180 to + 300°C 46 low low Type-T
Iron /Constantan +20 to 700°C 46 low low Type-J
Chromel/Constantan 0 to +800°C 68 low low-mid Type-E
Chromel/Alumel 0 to 1100°C 42 low low Type-K
Nicrosil/Nisil 0 to 1200°C 38 low mid-high Type-N
Platinum-Rhodium/
Platinum-Rhodium
100 to 1500°C 5 high
.
• high Type-B
Platinum-Rhodium/
Platinum
[image:44.595.142.441.111.417.2]0 to 1400°C 10 high high Type-R
BLADE WALL FILLER
THERMOCOUPLE BEAD MINERAL INSULATION
SLOT MACHINED IN BLADE
3.4 Embedded thermocouples
The measurement of surface temperatures using surface thermocouple sensors is not a standard technique used on most engine development programmes. This technique is mainly used on research programmes to validate advanced combustion and turbine cooling designs. The conventional method for surface thermocouple measurements would be to embed a small diameter NiCr/NiAl (Type-K) mineral insulated cable in an Electro Discharge Machining (EDM) produced groove as shown in figure 3.04 38 . The cable would be 0.25 mm diameter and the slot 0.35 deep and wide.
The slot would be filled with a Ni based vacuum furnace braze if possible or with a NiAl alloy flame spray. The excess would then be ground off to produce a smooth surface finish. The number of thermocouples that can be fitted to a blade and the locations of the sensors are limited because the grooves can weaken the blade. Several research blade designs have also had thin section walls where the application of embedded thermocouples would be impossible.
GAS STREAM
CABLE SHEATH
INTERNAL COOLING AIR
This technique has been less successful on components to be thermal barrier coated. Here the NiCoCrAlY bond coat is removed, the embedded thermocouple installed and the TBC applied. A recent application trial resulted in only 2 out of twenty thermocouples working after the TBC process. The problem appears to be due to oxidation of the type K wires by the high temperature (1000°C) and high oxygen content of the TBC process. Development work is ongoing with type R platinum-platinum/rhodium thermocouple cables to prevent this. This has shown some promise and several successful installations have been produced.
3.5 Uncertainty analysis of embedded thermocouple sensors
The technique has several sources of error, which have been reviewed by Parrish" and reported below. For this it is assumed that the component is a turbine blade with 1 mm thick metal wall thickness between blade surface and air cooling passage. The two main error sources are due to positional uncertainty of the thermocouple bead and effect on the component from the installed thermocouple.
There is some uncertainty of the position of the thermocouple bead in the metal layer due to the slot being machined deep to bury the cable. There is also the uncertainty of position of the thermocouple bead in the mineral insulated cable. Because the metal layer will have a large temperature drop across it both these give a positional uncertainty of where the measurement is being made.
There will be an effect on the component temperature due to the installation of the thermocouple. The thermocouple will have a different thermal conductivity to the blade material as will the filler used to restore the surface. There may exist an air gap beneath the thermocouple bead and mineral insulated cable that will give a very large thermal conductivity difference from the blade material.
from several hundreds of degrees Celsius to virtually nothing depending on the position on the surface of the component.
Correction for position of thermocouple
Chapter 4: Literature review-Thin film sensors and
processes
4.1 Thin film sensors
"The conclusion you reach by watching the world literature, is that resistance strain gauges of the future will be made by the adherent deposition of thin metal films on non-conducting layers which are in turn deposited on the base material. The amount of literature is pitifully small. A number of organisations, notably aircraft companies, have pursued this field, but their reports are not always readily available to the public"40. This was written in 1962. Thin film sensors have not gained the widespread use suggested here because of the complexity of the manufacturing technique. The main user of this technology is still the aerospace industry.
A thin film sensor is electrically equivalent to the conventional sensors described earlier. Its fabrication is different in that it is made of thin coatings of insulator, sensor and protective overcoat layer. A typical sensor, for example, is a dynamic strain gauge. This consists of 10pm of aluminium oxide deposited onto a polished blade surface followed by a nickel-20% chromium gauge matrix and leadout track, which is 1 um thick. The leadout track is overcoated with 1 um of gold to reduce unwanted resistance. The sensor grid and leadout track is overcoated with 1-2 um of aluminium oxide, which acts as a mechanical protective coating. The coatings are applied by a vacuum sputtering process as described in section 4.2. The patterning of the sensor grid and leadout tracks is performed using a photolithographic process (section 4.4).
Thin film strain gauges have an overall thickness no greater than 12 ilm, compared with that of conventional ceramic cement gauges, which are up to 300 gm. This is illustrated in figure 4.01, which is a photograph of the two strain gauge types. The thickness of the conventional gauges is sufficient to cause disturbance to the airflow over the component. However, this has proved difficult to quantify, whereas for the thin film gauge, it is negligible'. It has also been shown that the mass of the conventional gauges has, on occasion, altered the mechanical behaviour of the component under test'. This is more significant for smaller components. For applications where high gradients of both stress and temperature would be present and require minimal aerodynamic effects,
a
thin film strain gauge is preferred. Thin film gauges allow strain readings that are truly characteristic of the blade under investigation. Their shapes and sizes are more easily adapted to individual applications and their production less sensitive to operator skill than conventional techniques.(a) Thin Film dynamic strain
gauge
(12 pm overall thickness)
(b) Wire in ceramic cement (300 pm overall)
n il- 4 ...
Figure 4.01: Thin film and conventional ceramic cement strain gauges mounted on the surface of compressor blades.
At extreme surface metal temperatures (1000°C plus) on HP turbine blades, the poor bonding of ceramic cements to the blade alloy may limit the survivability of the conventional gauges. The fatigue life of wire/ cement gauges is in the order of 1/10 of that of low temperature stick on resin type gauges'. The thin film sensors have excellent fatigue lives, and can approach that of the blade on which they are mounted.
For low temperature instrumentation (less than 500°C), this method complements the conventional techniques. However, above 500°C this technology offers a new approach for sensor production, particularly where these layers can be deposited on top of each other to form more sophisticated sensor types.
4.1.1 Strain gauge measurements
A review has been performed on the limited reports of thin film sensor applications. The application process is described in a General Electric (GE) patent', which describes the limitations of conventional gauges, such as the alteration of mass, shape and other natural mechanical characteristics of the competent under test. GE started working on the technique in 1970's and now has a production facility. GE has established routine production of some basic sensor types in less hostile environments'.
When Rolls-Royce-produced thin film dynamic strain gauges have been used on aero-thermal rig tests, the limited data obtained compared well with that acquired from conventional gauges in similar locations".
Grant", Grey", Grey' and Aona" report other applications of thin film gauges on compressor blades. The former describes the nickel-chromium fabrication process of strain gauges on a deposited layer of silica.
with a Pt temperature compensation leg. This allowed the application of improved sensors to components that were too large to fit into a vacuum chamber for direct deposition. The mechanical response of the weldable gauge was similar to that of a directly deposited gauge.
The potential application of thin film sensors to strain measurements on gas turbine rotor blades is discussed by Dennis' and Kayser". Bethe l describes the use of thin film deposited strain gauges in transducers for the measurement of pressure, acceleration and torque and gives the method of fabrication.
An alternative sensor material of multilayered Cu-Cr is reported in Whiting52.
4.1.2 Temperature Measurements
The increasing trend towards high temperature, fuel-efficient jet engines has led to the development of complex cooling schemes for the turbine blades. The measurement of temperature during operation, which is accomplished in conventional blade designs by embedding wire thermocouples in the blade wall, causes serious structural and aerodynamic problems in the case of cooled turbines. Budhani" reviews the current state of the art for this measurement, which is to deposit thin film thermocouples on a NiCoCrAlY base. A European collaborative programme demonstrated thin film thermocouples of PtRh/Pt types on Ni based super alloys to 1000°C using a NiCoCrAlY plus thermally grown oxide system. Rolls-Royce was a partner in this programme with the deposition and patterning of the sensors performed by sub-contractors. Kreider' and Dile have also used this system.
A number of other reported applications of thin film thermocouple sensors have been found. Richardson' and Stowell' s report the use of thin film thermocouples on turbine blades using a sputtered insulation layer.
Rimai59 reports a method to deposit thin film thermocouples on a flexible substrate using evaporation techniques. This device allows the temperature of processes to be determined accurately without affecting the process. An example of this could be the measurement of temperature between heated rollers during a production process.
Most of the reported thin film work has been with Pt-Rh alloys. Godefroy' recommends a Platinel alloy thermocouple consisting of Pd-Pt-Au and Au-Pd legs. Yoshida' has followed this approach. It was found that the thermocouples have lower than bulk sensitivities. This may be due to the structure of the deposits but also due to contamination. It was found that the sensitivity approaches the bulk value when the thermocouple is annealed in a neutral gas. Kuo' describes the fabrication and calibration of Cu-Cr thermocouples.
Thin film sensors have a very low thermal mass and thus a fast response rate. This makes them ideal for fast response measurements. A number of applications are described in internal combustion engines 63,64,65,66,67.
In a description of current capabilities in 1985, GE" expressed an interest in applying thin film sensors under TBCs. The author could find no further information on this.
4.2 Sputter deposition processes
4.2.1 Diode sputtering
Sputtering is a high vacuum process in which material is ejected from a solid surface, by a momentum exchange process, due to high-energy bombardment of the surface. The high-energy particles are ions of an inert gas, and the most common method of realisation is by forming an abnormal glow discharge in argon'. Here, the potential difference across the gas is increased until it breaks down to form a plasma. The plasma consists of neutral atoms and charged species consisting of ions (for example an argon atom where an electron has acquired sufficient energy to escape leaving the resultant positively charged). The argon ions so produced, strike the cathode and release material from the cathode, usually in atomic form. The sputter yield, (i.e., the number of atoms sputtered per incident ion) increases almost linearly with ion energy up to about 500eV73 . Because of the momentum transfer process, the yield depends on the relative masses of atom and ion. Thus, the sputter yield and hence, the deposition rate is material and plasma dependent Table 4.01 gives a list of some materials likely to be used in this project and their sputter yield relative to aluminium for de diode sputtering with argon.
Material Yield relative to aluminium
Chromium 1.04
Gold 2.20
Nickel 1.20
Palladium 1.24
Platinum 1.16
Tungsten 0.50
Table 4.01: Sputter yields of various materials relative to aluminium (taken from CVC information bulletin74)
Area of FrOsion
El ectrostatic
Flak' Lines
Magnetic Fie Id Lines
Cathode
becomes self-sustaining. Positive ions are the most convenient source for sputtering since varying the potential on the target can control their momentum' s . Over 95% of the incident ion's energy remain in the target, so sputtering targets must be cooled.
Any surface placed near to the cathode will intercept atoms from the cathode and be coated. The atoms will leave the target in all directions and undergo further collisional scattering with argon atoms. The amount, energy and angle of atoms reaching the substrate are highly dependent on the working pressure of argoe. The electrons produced have a mean free path greater than the dimensions of the sputtering system. These are of interest because they can reach the anode and cause heating of the substrate.
4.3.1 Magnetron sputtering
Diode sputtering suffers from very low deposition rates. An improvement to the technique is to magnetically enhance the process and is known as magnetron sputtering. The magnetron uses the principle of applying a specially shaped magnetic field to a diode cathode.
The negative potential on the target establishes an electric field that is everywhere normal to the target, while the cathode surface is immersed in a magnetic field (see figure 4.02). The combined effect of these orthogonal fields is to confine secondary electrons, a product of the ion bombardment of the target, in cycloidal paths around the target, while they are free to move parallel to the target in an endless 'racetrack' pattern'. This increases the likelihood of an ionising collision with an argon atom. With a potential —V on the target and a magnetic field B, the radius of the electron orbit is
r = (2m/Y2 VX Equation 5.
Where m is the electron mass in kg, e the electron charge in Coulomb, V is the target potential in volts and B the magnetic flux density in Tesla. The secondary electrons generate further ions by collision with the sputtering gas. The ions are accelerated by the electric field to the target across a distance of a few millimetres. The magnetron design causes the plasma impedance to drop so that the source operates at much lower voltages (500-600 V as compared to several kV for diode sputtering). This greater ionisation efficiency leads to an increase in ion current density, which is proportional to the erosion rate of the target. Magnetron processes are significantly cooler than diode processes because of their more efficient design. Ions, whose masses are greater than electrons, less affected by the magnetic field.
4.2.3 Film purity
1.0 0.9 0.8 0.7 0.6 .5
Substrate
Temperature (TTm) Argon
Pressure (mtorr) Porous Structure
Consisting of Tapered Crystallites Separated by Voids
Transition Structure Consisting of Densely Packed Fibrous Grains
Columnar Grains Extending Through Coating Thickness
Recrystallized Grain Structure
fabricating the target is an important consideration. Those formed by compacting or hot pressing powder are porous and entrap gas, which is then continuously released during sputtering'.
4.2.4 Film structure
The growth of the film is influenced by the conditions at the substrate. The nucleation and growth of thin films is reviewed in Reichelt 80. This gives a representation of the mathematical theories of the growth of thin films in the initial stages. A model of film structure by Thornton' is shown in figure 4.03. The numbers refer to Movchan-Demchishin zones. Zone I of the model has a columnar structure, consisting of tapered units defined by voided growth boundaries. This structure is created by atomic shadowing and promoted by surface irregularities or step features that cause oblique angles of the deposited flux. Zone I coatings have higher resistivity, and increased oxidation due to exposure of the open grain boundaries during growth or after exposure to the atmosphere. A zone I structure contains little trapped gas from the deposition process and has residual tensile stresses.