ONTO ZEOLITES.
BY
LINDA CLAIRE JOZEFOWICZ
A thesis submitted for the degree of
Doctor of Philosophy
of
The University of Salford
Department of Pure and Applied Chemistry,
The University of Salford
Salford, M5 4WT.
DECLARATION
I hereby declare that this thesis has not been accepted in any previous application for a degree, that it has been composed by myself and that the work described herein was performed by myself.
LiAia agre
Linda Claire Jozefowicz.
I would like to express my special thanks to Dr. A. Dyer for his supervision and guidance in this work.
I am also grateful to British Nuclear Fuels plc (Springfields) for financial and technical support for this work, especially Dr. J.F. Ellis and Dr. H. Eccles, for
their guidance and all the technical and chemical services staff at Springfields for helpful advice and support.
My thanks to Dr. H. Enamy for invaluable help and encouragement throughout this work and all members of the zeolite group, past and present, at Salford.
Thanks are due to Mr. D. Park (Shell) for obtaining EPMA and energy dispersive X-ray spectra, Mr. I.Vaughan for producing excellent X-ray powder diffractograms of thorium-zeolites at British Alcan plc and all technical staff and academic staff, at the University of Salford, who helped with this work.
I would like to thank Miss O. Wilson for providing many of the less well-known zeolites and her help with the reproduction of SEMs.
The presence of the a- and S- emitters, uranium and thorium, in industrial waste streams poses a serious threat to the environment. This is due to both the potentially damaging nature of the radioactive emissions when incorporated into biological systems and to the general toxicity of these heavy metals.
A programme of work to remove these heavy metals especially thorium, from a particular raffinate was undertaken. It was desirable to use zeolites specifically to remove thorium and some uranium. A survey of the uptake of thorium onto a ndide range of zeolites, both natural and synthetic is included. It was necessary to find a
zeolite which could take up the radioactive cations, resist acid attack and which was suitable for use in a large scale, industrial removal plant.
Due to the nature of the radiochemical components in
conjunction with zeolite behaviour, several radiochemical techniques had to be modified to provide analytical methods for this project. Effects of competing cations on the uptake of thorium onto zeolites were also studied.
The best all-round candidate was found to be an Eastgate zeolite, although clinoptilolite showed a reasonable uptake of
LIST OF CONTENTS
CONTENTS PAGE NUMBER
CHAPTER 1 INTRODUCTION 1
1.1 Nuclear Waste 1
1.2 Production of the Plant Waste Stream 2 1.3 Uranium Fuel Rod/Pellet Production 5 1.4 Necessity for the Removal of Thorium and
Uranium from the Plant Raffinate 7
1.5 Methods of Waste Management 9
1.6 Methodology of Medium-Low Level Waste
Treatment 11
1.6.1 Fixation 11
1.6.2 Ultrafiltration 11
1.6.3 Electrochemical Methods 11
1.6.4 Biomass 12
1.6.5 Ion-Exchangers 12
1.6.6 Precipitation and Solvent Extraction 15 1.7 Liquid Wastes and Aims of the Project 17
CHAPTER 2 ZEOLITES 19
2.1 Occurrence 19
2.2 Natural and Synthetic Zeolites 20
2.3 Uses of Zeolites 21
2.4 Zeolites : Definition and Structure 22 2.5 Zeolite Structure and Ion-Exchange 24
2.6 Channel Types 29
2.7 Hydroxyl Groups 30
2.9 Zeolites and Zeolitic Materials
used in this Work 32
2.10 Clinoptilolite 32
2.11 Erionite 37
2.12 Mordenite and ZEOLON 900 (Z900) 37
2.13 Chabazite 40
2.14 Zeolite Y 40
2.15 Zeolite A 43
2.16 Eastgate 2020 43
2.17 Other Zeolites 45
2.18 Ion-Exchange Capacity in Zeolites 45
2.19 Basic Ion-Exchange Theory 46
2.19.1 Kinetics 46
2.19.2 Ion-Exchange Mechanism 46
2.20 Langmuir Adsorption Isotherms 49
CHAPTER 3 THORIUM AND URANIUM 50
3.1 Thorium Occurrence and Uses 50
3.2 Uranium Occurrence and Uses 52
3.3 The Radioactive Decay of Thorium 53
3.3.1 Decay Equilibria 55
3.3.2 Other Isotopes of Thorium 59
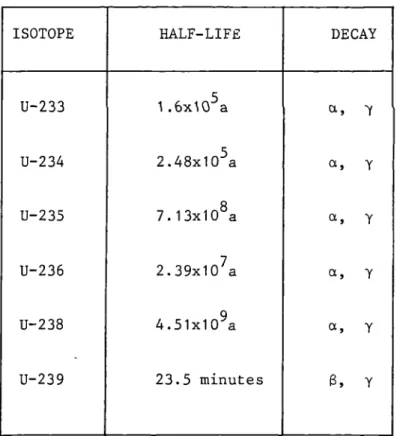
3.4 The Radioactive Decay of Uranium 59
3.4.1 Equilibrium 62
CONTENTS (continued) PAGE NUMBER 3.5 Importance of Radioactivity Equilibria
to this Work 62
3.6 The General Chemistry of Thorium 63
3.6.1 Aqueous Chemistry of Thorium 63
3.6.2 The Chemistry of Thorium in Nitric Acid 66 3.7 The General Chemistry of Uranium 67
3.7.1 General €.1
3.7.1 The Aqueous Chemistry of Uranium 69
CHAPTER 4 EXPERIMENTAL METHODS 72
4.1 Quantitative Methods for the
Determination of Thorium and Uranium 72
4.1.1 Colourimetry : Thorium 72
4.1.2 Colourimetry : Uranium 76
4.2 Titration : Thorium 77
4.3 Liquid Scintillation Counting 78
4.3.1 Theory 78
4.3.2 erenkov Counting 80
4.3.3 Quenching 81
4.4 Gravimetry 82
4.5 Qualitative Analysis Methods 83
4.5.1 y-Ray Spectroscopy 83
4.5.2 13-Ray Spectroscopy 83
4.6.1 Electron Probe Micro-Analysis 85 4.6.2 The Electron Probe Microanalyser 86
CONTENTS (continued) PAGE NUMBER CHAPTER 5 EXPERIMENTAL I
5.1 Experimental 89
5.1.1 Preparation of Zeolites for Experiments 89 5.1.2 Wet Chemical Analysis of Specific Zeolites 89
5.1.3 Determination of Silica 91
5.1.4 Sample Preparation for Flame Photometry 93 5.1.5 Sample Preparation for Atomic Absorption
Spectrometry 93
5.1.6 Water Content : TG Analysis 94
5.2 Specific Cation Exchange Capacity Measurements on Z900, Clinoptilolite,
NaY, CaY 94
5.3
5.4.1
5.4.2
5.4.3
5.4.4
Preparation of Homoionic Forms of
Zeolites for Isotherm Studies 95 Leaching Effect of Several Zeolites on
Treatment with Water 97
Leaching Effect on Zeolites treated
with Pure Thorium Solutions 97
Leaching Effect on Zeolites treated
with Nitric Acid 98
Experiments to Determine the Release of Sodium and Potassium from
2 Clinoptilolite and NaY with 10ppm
Thorium Solutions 98
5.5.1 Colourimetry for the Analysis of Thorium 99 5.5.2 Preparation of a Standardized Stock
Solution 99
5.5.3 Thorium Colourimetry Procedure : Morin 101 5.5.4 Thorium Colourimetry Procedure : Thoron 102 5.5.5 Colourimetric Determination of Uranium 103 5.6.1 Sample Preparation and Use of the
CONTENTS (continued) PAGE NUMBER
5.6.2 Quenching 105
5.6.3 Liquid Scintillation Counting 108
5.6.4 Quenching 110
5.7.1 Preparation of a Th-234 Tracer Solution
by Solvent Extraction of U-238 112 5.7.2 Radiochemical Extraction of Th-232 from
its Daughter Isotopes 113
5.8.1 Screening of Zeolites for Th-232 and
Ac-228/Ra-228 Uptakes 114
5.8.2 Variations of Experimental Conditions
Temperature 116
5.8.3 Variations of Experimental Conditions
Concentration 116
5.8.4 Th-234 Uptake on Clinoptilolite,
Phillipsite, Chabazite 3 118
5.8.5 Ten-Hour Uptake Tests 118
5.9.1 Uptake Experiments : U-238 on Selected
Zeolites 119
5.9.2 Uptake Experiments for Zeolites and
Uranium a-emitter Daughters 119 5.9.3 Experiments to show the Effect of Nitric
Acid Concentration on the Uptake of
U-238 a-emitter Daughters on Zeolites 119 5.10 Competing Ion Effects
5.10.1 Experiments to Determine the Effect of Competing Ions on the Uptake of Ra-228/
Ac-228 on Zeolites 121
5.10.2 Effect of the Uptake of Th-232 by Varying Concentrations of Competing Ions 123 5.10.3 Effects of H+, Na+, K+, Ca2+ and Al3+
on the Uptake of Th-232 on Clinoptilolite
and Z900 123
CONTENTS (continued) PAGE NUMBER
CHAPTER 6 EXPERIMENTAL II 127
6.1 Column Experiments 127
6.1.1 Procedure 127
6.1.2 Free Column Volume 129
6.1.3 Column Experiment 129
6.1.4 Variations of Column Experiments 130 6.2 Isotherm Experiments : Thorium 132 6.2.1 Repeated and Reversible Exchanges 134 6.2.2 Isotherm Experiments : Uranium 136 6.3 Wet Chemical Analysis of the Solids
from Isotherm Experiments 136
6.4 Stripped Raffinate Solutions 139
6.4.1 .Experimental 139
6.4.2 Fluoride Determination 142
6.5 X-ray Powder Diffraction (XRD) 143
6.6 Electron Probe Microanalysis (EPMA) 144 6.7 Differential Thermogravimetric
Analysis (DTG) 145
6.8 'y-Spectrometry 147
6.8 B-Spectrometry 149
6.10 Scanning Electron Micrographs (SEM) 150
CHAPTER 7 RESULTS (151 - 222)
CONTENTS (continued) PAGE NUMBER
CHAPTER 8 DISCUSSION OF RESULTS 224
8.1 Wet Chemical Analysis of Clinoptilolite
and Eastgate 224
8.2 Cation Exchange Capacity 224
8.2.1 Leaching Effects of Solutions on
Zeolites 225
8.2.2 Leaching Effect of Water 225
8.2.3 Leaching Effect of Nitric Acid 226 8.2.4 Leaching Effects of Pure Thorium
Nitrate Solutions 226
8.2.5 Leaching Effect of a 1000ppm Th4+
Solution 227
8.3 Quenching Effects of Na + , K Al3+
on Cerenkov Counting 228
8.3.1 Quenching Effect of Na+, K+, Al3+ on
LSC (Th-232 and U-238) 229
8.4 Characterization of Solvent-Extracted
Th-234 Solution 229
8.5 Characterization of Solvent-Extracted
Th-232 Solution 229
8.6 Uptakes of Th-232 and Total Activity onto a Range of Natural and Synthetic
Zeolites 230
8.6.1 Uptakes of Ac-228/Ra-228 onto Natural
and Synthetic Zeolites (0.01N, Th-232) 232 8.6.2 Th-234 Uptakes onto Selected Zeolites 232 8.6.3 Ten Hour Uptakes of Th-234 onto Zeolites 233 8.7 Variations of Temperature and
CONTENTS (continued) PAGE NUMBER
8.7.1 Variations of Temperature and
Concentration 233
8.8 Uptakes of U-238 on Zeolites 233
8.9 Uptakes of U-238 (B-Emitter Daughters)
onto Selected Zeolites 234
8.10 Competing Ion Effects of
e
and Nal'on Th-232 Daughter Uptakes 234 8.10.1 Competing Ion Effects of Y -1- , Na+ and
on Th-232 Uptakes 234
8.10.2 Competing Ion Effects of Na + ,
e
Mg 2+ , Ca 2+ , Al 3+ on the Uptake ofThorium in Nitric Acid Solution 235 8.11 Th-232 Uptakes from Simulated
Raffinate Solutions 236
8.12 Column Experiments 237
8.12.1 Breakthrough Curves 237
8.13 Isotherms 242
8.13.1 Thorium 242
8.13.2 Langmuir Plots : Thorium 243
8.13.3 Langmuir Plots Involving the Thorium
Daughter Isotopes 244
8.13.4 Ion-Exchange Isotherms : Uranyl Ions 246 8.13.5 Langmuir Isotherms : Uranium 247
8.13.6 Repeated Exchanges 248
8.13.7 Wet Chemical Analysis of Clinoptilolite
treated with Thorium 248
8.13.8 Total Uptakes of Thorium in Isotherm
Solutions 249
8.14 Stripped Raffinate Experiments 249
CONTENTS (continued) PAGE NUMBER
8.16 Energy-Dispersive X-ray Spectra 252
8.17 Differential Thermal Gravimetry 254
8.18 y-Spectra 255
8.19 a-Spectra 257
8.20 Scanning Electron Micrographs 258
CHAPTER 9 GENERAL DISCUSSION, CONCLUSIONS AND FURTHER WORK.
9 General Discussion and Conclusions 259
9.1 Thorium 259
9.2 Isotherms and Cation Positions 259
9.2.1 Clinoptilolite 259
9.2.2 NaY 261
9.2.3 _Zeolite Z900 263
9.3 Isotherms : Uranium 264
9.3.1 Clinoptilolite 264
9.3.2 Z900 265
9.3.3 NaY 265
9.4 Langmuir Adsorption 266
9.5 Surface Precipitation of Thorium 268
9.6 Reproducibility of Results 269
9.7 Thermodynamic Parameters for Isotherms 269
9.8 Eastgate - A Special Case 270
9.9 Radiochemistry 272
9.9.1 Equilibrium Solutions 272
9.9.3 Liquid Scintillation Counting 273 9.9.4 Counting Methods and Daughter
Removal by Zeolites 274
9.9.5 Thorium-232 and Uranium-238 274
9.10 y- and B- Spectroscopy 274
9.10.1 y-Spectroscopy 274
9.10.2 B-Spectroscopy 274
9.11 Zeolites and Acid Solutions 275
9.12 Conclusions of This Work 276
9.13 Suggestions For Further Work 277
APPENDICES
APPENDIX I 279
APPENDIX II 280
APPENDIX III 283
APPENDIX IV 284 - 288
APPENDIX V 289
REFERENCES 290 - 300
PHOTOGRAPHIC PLATES (Situated at the end of Chapter 7) PLATE 1
LIST OF FIGURES
PAGE
FIGURE NUMBER
NUMBER FIGURE TITLE
1 Production of the Plant Raffinate 4
2 Raffinate Composition 6
3 Uranium Fuel Rod/Pellet Production 8
4 Silica and Alumina Tetrahedra in Zeolites 23
5 Secondary Building Units 25
6 Typical Zeolite Polyhedra 26
7 Cation Sitings for Zeolite Y 27
8 Clinoptilolite 36
9 Erionite 38
10 Mordenite 39
11 Chabazite 41
12 Zeolite Y 42
13 Zeolite A 44
14A Isotherm Types 47
14B Langmuir Adsorption Isotherms 49
15 Thorium-232 Decay Series 56
16 Uranium-238 Decay Series 57
17 Decay Equilibria for Th-232 and Th-228 58
18 Uranium-235 Decay Series 60
,
19 Hydrolysis Polymerization of Thorium 66
20 Thorium Species in Nitric Acid 68
21 Morin : Structure 72
22 Thoron : Structure 75
23 The 13-Spectrum of Th-234 85
LIST OF FIGURES (continued)
FIGURE PAGE
NUMBER FIGURE TITLE NUMBER
25 The Fox's Triangle Arrangement 108
26 Column Arrangement 128
27 Stripped Raffinate Composition 140
28 Quenching Effect of Na + 157
29 Quenching Effect of K + 157
30 Quenching Effect of Al 3+ 158
31 Half-Life Curve for Solvent Extracted Th-234 158 32 Th-234 Uptake Curves (natural zeolites) 165 33 Ten-Hour Uptake Curves (Th-232) 165 34 Ten-Hour Uptake Curves (Ac-228iRa-228) 166 35 Ten-Hour Uptake Curves (Ac-228/Ra-228) 166 36 Ten-Hour Uptake Curves (Ac-228/Ra-228) 167 37 Ten-Hour Uptake Curves (Ac-228/Ra-228) 167
BREAKTHROUGH CURVES:
38 Eastgate, Th-232 177
39 Clinoptilolite, Th-232 177
40 Clinoptilolite/Th-234/acid 178
41 Z900/Th-234/acid 178
42 CaY/Ac-228,Ra-228/acid 179
43 Z900/Ac-228,Ra-228/acid 179
44 Z900/Th-232/acid 180
45 Clinoptilolite/Th-232/acid 180
46 Clinoptilolite/Ac-228,Ra-228/acid 181
47 Eastgate/Th-232 Elution 181
48 Eastgate/Ac-228,Ra-228 182
LIST OF FIGURES (continued) FIGURE
NUMBER FIGURE TITLE
PAGE NUMBER ISOTHERM CURVES
50 Clinoptilolite. K/Th (0.01N) 183
51 Clinoptilolite. K/Th (0.001N) 183
52 Z900. K/Th (0.01N) 184
53 NaY. Na/Th (0.01N) 184
54 Clinoptilolite. Na/Th (0.1N) 185
LANGMUIR PLOTS
55 Clinoptilolite. KfTh Q3.0111) \85
56 Z900. K/Th (0.01N) 186
57 NaY. Na/Th (0.01N) 186
58 Clinoptilolite. Kttotal activity (0.(N) (87
59 Z900. K/(Ac-228/Ra-228) (0.01N) 187
60 Clinoptilolite. K/(Ac-228/Ra-228) (0.1N) 188 61 Clinoptilolite. Na/(Ac-228/Ra-228) (0.1N) 188
ISOTHERM CURVES
62 Clinoptilolite (UO2+)
2 189
63 Z900 (UO
2 2+
) 189
2+ 64 Zeolite Y (UO
2 ) 190
LANGMUIR PLOT
65 Clinoptilolite. Na/total activity 190
66 KY. K/total activity 191
67 NaY. Na/total activity 191
68 Clinoptilolite (UO2+)
2 192
69 Z900 (UO2+)
2 192
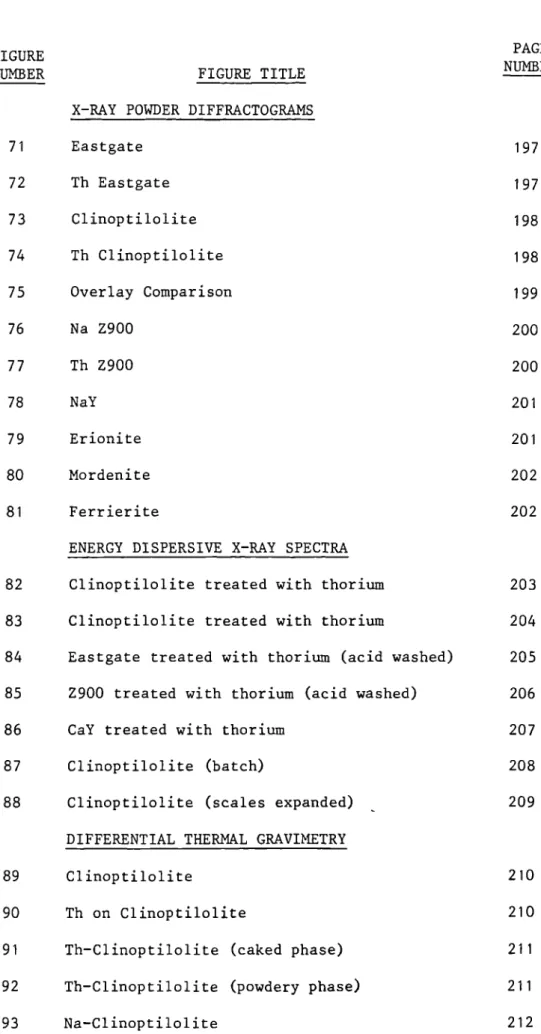
FIGURE PAGE
NUMBER FIGURE TITLE NUMBER
X-RAY POWDER DIFFRACTOGRAMS
71 Eastgate 197
72 Th Eastgate 197
73 Clinoptilolite 198
74 Th Clinoptilolite 198
75 Overlay Comparison 199
76 Na Z900 200
77 Th Z900 200
78 NaY 201
79 Erionite 201
80 Mordenite 202
81 Ferrierite 202
ENERGY DISPERSIVE X-RAY SPECTRA
82 Clinoptilolite treated with thorium 203 83 Clinoptilolite treated with thorium 204 84 Eastgate treated with thorium (acid washed) 205 85 Z900 treated with thorium (acid washed) 206
86 CaY treated with thorium 207
87 Clinoptilolite (batch) 208
88 Clinoptilolite (scales expanded) 209 DIFFERENTIAL THERMAL GRAVIMETRY
89 Clinoptilolite 210
90 Th on Clinoptilolite 210
91 Th-Clinoptilolite (caked phase) 211 92 Th-Clinoptilolite (powdery phase) 211
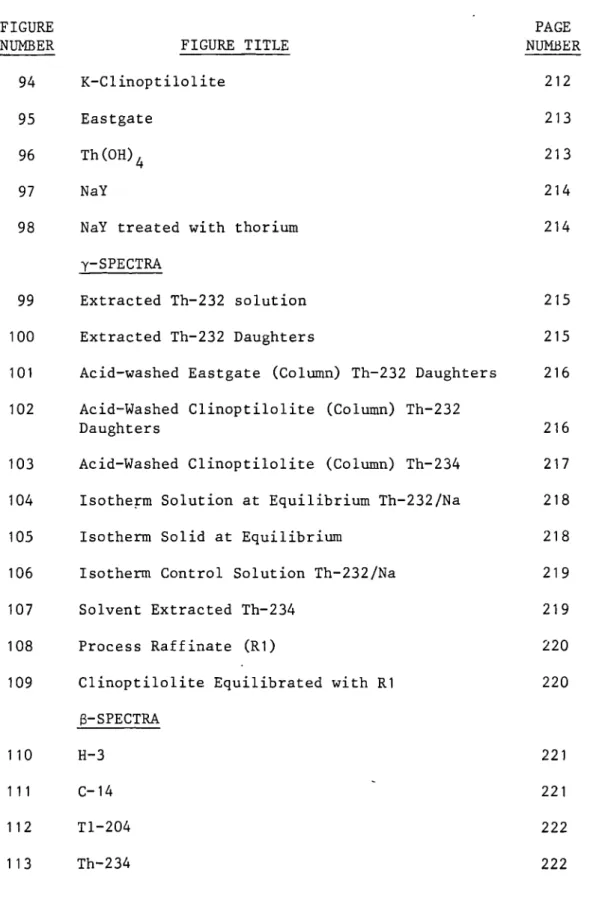
LIST OF FIGURES (continued)
FIGURE PAGE
NUMBER FIGURE TITLE NUMBER
94 K-Clinoptilolite 212
95 Eastgate 213
96 Th(OH)4 213
97 NaY 214
98 NaY treated with thorium 214
y-SPECTRA
99 Extracted Th-232 solution 215
100 Extracted Th-232 Daughters 215
101 Acid-washed Eastgate (Column) Th-232 Daughters 216 102 Acid-Washed Clinoptilolite (Column) Th-232
Daughters 216
103 Acid-Washed Clinoptilolite (Column) Th-234 217 104 Isotherm Solution at Equilibrium Th-232/Na 218
105 Isotherm Solid at Equilibrium 218
106 Isotherm Control Solution Th-232/Na 219
107 Solvent Extracted Th-234 219
108 Process Raffinate (R1) 220
109 Clinoptilolite Equilibrated with R1 220 S-SPECTRA
110 H-3 221
111 C-14 221
112 T1-204 222
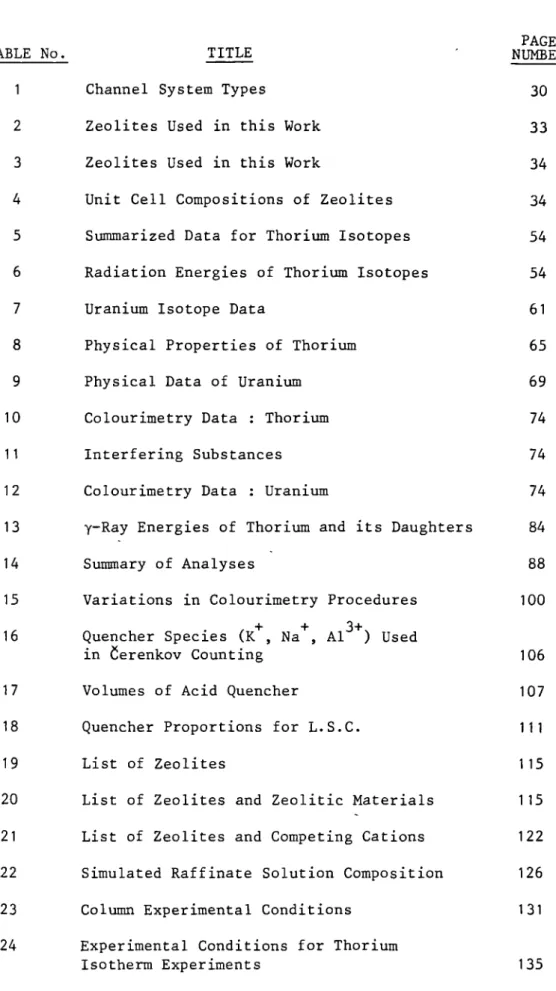
LIST OF TABLES
PAGE
TABLE No. TITLE NUMBER
1 Channel System Types 30
2 Zeolites Used in this Work 33
3 Zeolites Used in this Work 34
4 Unit Cell Compositions of Zeolites 34 5 Summarized Data for Thorium Isotopes 54 6 Radiation Energies of Thorium Isotopes 54
7 Uranium Isotope Data 61
8 Physical Properties of Thorium 65
9 Physical Data of Uranium 69
10 Colourimetry Data : Thorium 74
11 Interfering Substances 74
12 Colourimetry Data : Uranium 74
13 y-Ray Energies of Thorium and its Daughters 84
14 Summary of Analyses 88
15 Variations in Colourimetry Procedures 100 16 Quencher Species (K+, Na+, Al3+) Used
in erenkov Counting 106
17 Volumes of Acid Quencher 107
18 Quencher Proportions for L.S.C. 111
19 List of Zeolites 115
20 List of Zeolites and Zeolitic Materials 115 21 List of Zeolites and Competing Cations 122 22 Simulated Raffinate Solution Composition 126
23 Column Experimental Conditions 131
24 Experimental Conditions for Thorium
LIST OF TABLES (continued)
PAGE
TABLE No. TITLE NUMBER
25 Experimental Conditions for Uranium
Isotherm Experiments 137
26 Various Raffinate Solutions 141
27 List of X-Ray Powder Diffractograms 143 28 Samples taken for X-Ray Microanalysis 144 29 List of Samples taken for DTG Analysis 146
30 Samples Analysed for y-Peaks 147
31 Samples Analysed for B-Spectra 149
32 Zeolite Wet Chemical Analysis 151
33 Exchange Capacities of Tested Zeolites 152 34 Leaching Effect of Water on Selected Zeolites 153 35 Leaching Effect on Zeolites Treated with
Acid Solution 153
36 Leaching Effect on Zeolites Treated with
Thorium Solutions 154
37 Leaching Effect on Zeolites Treated with
Thorium Solutions (Milliequivalent ratios) 155 38 Analysis for Na, K1- Release and Th4+
Uptake Concerning Zeolites Contacted
with Thorium Solutions 156
39 Results of Natural Zeolite Screening 159
40 0.1N Thorium Nitrate Uptakes 160
41 Synthetic Zeolite Screening (K d Values) 161
42 Total Activity Removal - Thorium 162
43 Results of Zeolite Screening (Ac-228/Ra-228) 163 44 Results of Synthetic Zeolite Trials
(Ac-228/Ra-228) 164
45 Effects of Temperature and Concentration
Changes on the Uptake of Th-232 168 46 Effects of Temperature and Concentration
Changes on the Uptake of Thorium B-emitter
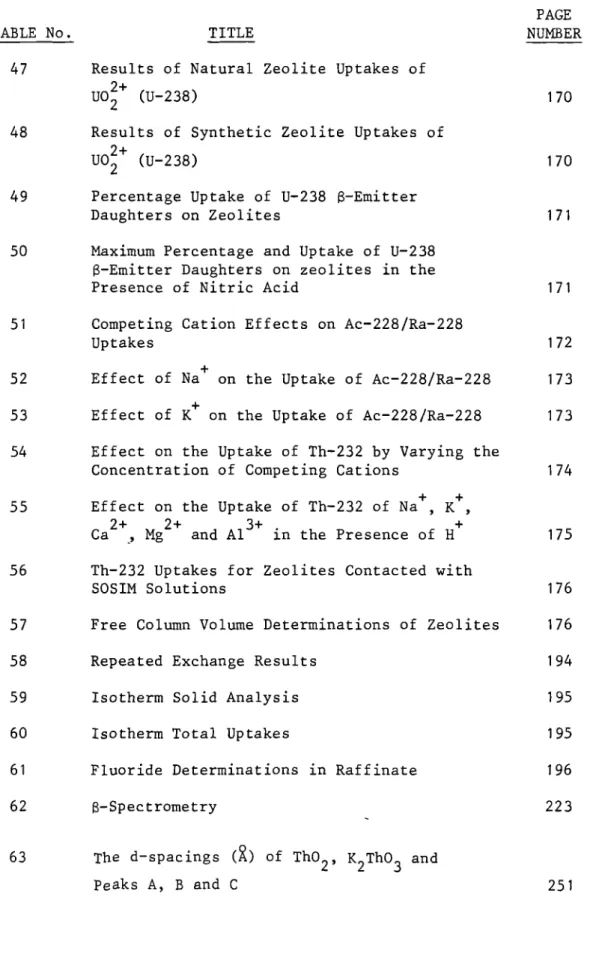
TABLE No. TITLE NUMBER 47 Results of Natural Zeolite Uptakes of
2+ UO
2 (U-238) 170
48 Results of Synthetic Zeolite Uptakes of 2+
UO
2 (U-238) 170
49 Percentage Uptake of U-238 (3-Emitter
Daughters on Zeolites 171
50 Maximum Percentage and Uptake of U-238 (3-Emitter Daughters on zeolites in the
Presence of Nitric Acid 171
51 Competing Cation Effects on Ac-228/Ra-228
Uptakes 172
52 Effect of Na+ on the Uptake of Ac-228/Ra-228 173 53 Effect of K+ on the Uptake of Ac-228/Ra-228 173 54 Effect on the Uptake of Th-232 by Varying the
Concentration of Competing Cations 174 55 Effect on the Uptake of Th-232 of Na+, K+,
Ca2+ Mg and 3+and Al in the Presence of H. + 175 56 Th-232 Uptakes for Zeolites Contacted with
SOSIM Solutions 176
57 Free Column Volume Determinations of Zeolites 176
58 Repeated Exchange Results 194
59 Isotherm Solid Analysis 195
60 Isotherm Total Uptakes 195
61 Fluoride Determinations in Raffinate 196
62 13-Spectrometry 223
63 The d-spacings (X) of Th0 2 , K 2 Th0 3 and
CHAPTER 1
1
1. INTRODUCTION
1.1 NUCLEAR WASTE
In 1946 British Nuclear Fuels established a plant at Springfields, near Preston, to produce uranium fuels for nuclear reactors. Since this time over 30,000 tonnes of nuclear fuel have been processed at the plant including all the uranium
metal and uranium oxide fuel for the United Kingdom's Magnox and Advanced Gas Cooled Reactors (AGR's). As many as five million fuel elements and pins have been manufactured (this, in energy terms, is equivalent to 650 million tonnes of coal). At the plant it is possible to produce fuel for all major types of reactors and the plant has the facilities to manufacture speciality fuels for research and prototype reactors. The
_
2
The health and safety policy at Springfields is to make sure that possible hazards to its workforce and the general public are kept to a minimum and in compliance with internationally
recommended safety guidEines. Any radioactive discharges are authorised by the Ministry of Agriculture, Fisheries and Food and the Department of the Environment. Regular monitoring of the environment around Springfields is conducted and there are
stringent safety precautions that are observed by the workforce, e.g. the hydrogen fluoride plant.
British Nuclear Fuels plc. (Springfields) began a programme of funding projects to explore different methods of heavy-metal-removal from a particular radioactive waste stream produced on site. Presently most activity is removed from this waste-stream by solvent extraction and it is within industrial
interests to use a cheaper method. It is planned to use inorganic ion-exchangers for the purpose of removing radioactive heavy metals from this waste stream.
1.2 PRODUCTION OF THE PLANT WASTE STREAM (RAFFINATE)
by using acid or alkali, is further purified and enriched before it reaches Springfields. At this stage, these uranium ore concentrates may contain about 75% uranium and each batch that
arrives at the plant is analysed for uranium content and impurities. To be used in fuel rod or oxide pellet manufacture,
uranium must be in a highly pure form. The yellowcake is
dissolved in nitric acid and insoluble impurities are removed on a rotary filter. The bright yellow solution of "crude" uranyl nitrate is then passed through a solvent extraction plant to remove as many of the soluble impurities as possible. It is during this process that the plant raffinate is produced (FIG. 1).
The crude uranyl nitrate is contacted with tert-butyl phosphate in odourless kerosene (20% TBP/OK) in a mixer-settler system. In this process uranium-containing ions will pass into the organic solvent attracted by the phosphate components of the solvent, leaving most of the impurities in the aqueous phase. The odourless kerosene is purely used as a diluent as tert-butyl phosphate is a viscous liquid and this viscosity renders it
unsuitable for use in solvent extraction processes. The uranium is then back-extracted from the organic phase by the use of dilute nitric acid. At this point in the process, some of the water is boiled off leaving a reasonably pure solution of concentrated uranyl nitrate.
SOLUTION OF UO 2 2+
IN TBP/OK
2+ BACK WASHING OF UO9
SOLUTION WITH HOTfr WATER
4
Production of the Plant Raffinate.
URANIUM ORE CONCENTRATE
t
DISSOLUTION IN HNO (6M)
CRUDE URANYL NITRATE
SOLVENT EXTRACTION WITH tert-BUTYLPHOSPHATE IN ODOIMESS YEROSEM. (II? ;CnL 1
Th-232, Th-234, HNO3, TRACE URANIUM AND OTHER IONS CONSTITUTING THE
PLANT RAFFINATE
PURIFIED URANYL NITRATE
OTHER PROCESSES
comprises the raffinate (FIG. 2) which is of variable composition depending on the original batch composition of the yellow cake.
1.3 URANIUM FUEL ROD/PELLET PRODUCTION
The concentrated uranyl nitrate must be converted to uranium tetrafluoride,by first reaction with air at elevated temperatures, then reduction processes by hydrogen and finally, reaction with hydrogen fluoride. The uranium tetrafluoride can be used in one of two ways
a) it may be converted to uranium hexafluoride (UF 6 or "HEX") by reaction with fluorine gas. The HEX gas produced is liquefie711 by cooling to about 90°C and passed into containers where it
solidifies and is sent for enrichment by the "gas centrifuge method" to enrich the uranium -235 isotope of the HEX, which mostly contains uranium -238 (natural uranium). The enriched material returns to Springfields where it is treated with steam and hydrogen to directly convert it to uranium oxide powder.
This powder is pressed into pellets and placed in stainless steel, or zirconium, cans which are then filled with helium and sealed. These are the uranium oxide "fuel pins" used in Advanced Gas-cooled Reactors and water moderated reactors.
6
Raffinate Composition
COMPONENT CONCENTRATION/mg 11-,
Na+ 2000 - 7000
+
K 100 - 400
Mg2+ 150 - 600
Ca2+ 250 - 1000
Al3+ 300 - 1200
Fe3+ 250 - 1000
Cl _
50 - 100
2-PO
4 5- 50
- 1 COMPONENT CONCENTRATION/g 1
NO3_ 20 - 80
SO 4
2-2.5 - 7.5
F - 1- 2
-1 RADIOACTIVE CONCENTRATION/mg 1
COMPONENT
Thorium 180 - 750
Uranium 5 - 50
which is re-melted in a vacuum casting furnace and cast into rods. The cast rods are heat treated to produce a fine-grain crystal structure, straightened, machined and grooved to enable the Magnox cans to lock onto them. The cans are placed on the rods and helium gas inserted. The cans are capped producing Magnox fuel rods for use in Magnox reactors. (FIG.3)
1.4 NECESSITY FOR THE REMOVAL OF THORIUM AND URANIUM FROM THE PLANT RAFFINATE
FIGURE 2 shows that the raffinate contains small
quantities of thorium-232, thorium-234 and even smaller quantities of uranium-238, which have remained in the aqueous phase after solvent extraction. The daughter isotopes of these radioactive components must also be present in lesser concentrations, but
nevertheless, contributing to the total activity of the waste stream. Many heavy metals are toxic to biological systems.
REACTION WITH FLUORINE GAS TO UF
6
ZIRCALOY and STAINLESS STEEL
CANS
ASSEMBLY OF FUEL PINS TO FORM
ELEMENTS
ENRICHMENT
CONVERSION TO UO
PELLETING
CANNING OF PELLETS TO FORM PINS
OXIDE REACTORS
8
Uranium Fuel Rod/Pellet Production
UF 4
REDUCTION TO U METAL
CASTING AND MACHINING OF
FUEL RODS
MAGNOX CANS
CANNING OF MAGNOX FUEL
MAGNOX REACTORS
tissue damage if incorporated into the lung by inhalation. In addition to the radiation hazard it must be said that heavy metals such as uranium and thorium are toxic. Hence, removal of these heavy metals from industrial waste streams is necessary as they are toxic and naturally radioactive.
1.5 METHODS OF WASTE MANAGEMENT
The plant raffinate from the solvent extraction plant at Springfields is produced in volume and a method must be found to reduce this volume at the same time as removing the heavy metals. It would be advantageous to selectively remove these metals from the less harmful components of the waste-stream
e.g. sodium, potassium and calcium. If any expensive removal system that was chosen was to allow the regeneration of the uranium and thorium then the method would become very cost-effective.
If, however, the initial method chosen was cheap then it would be possible to store the thorium/uranium waste or encapsulate it in cement and dispose of it by deep burial. The choice of method is limited by several factors:
a) The low pH of the raffinate.
b) The requirement of selectivity for the removed species, hence the necessity of volume reduction.
c) Cost.
d) The nature of the radioactive species removed.
10
2) Intermediate-level wastes.
3) Low-level wastes. e.g. laboratory coats and gloves used in radiochemical laboratories.
High-level wastes may be stored in controlled surface sites whereby the waste is contained in cannisters, cooled by air or water to remove heat generated in the process of high-level
radioactive decahshielded by concrete and lead. A surveillance system must be able to detect rapidly any cannister failure and subsequent leak to enable prompt repair and thus, preventing harmful levels of activity reaching the biosphere. These wastes may be stored for a short period of time and reprocessed. They may need permanent storage. Deposition of the waste in stable,
geological systems has been proposed as a possibility for permanent storage.
It is the intermediate to low-level waste category which concerns this project and many methods, old and modern, may be used to treat the waste.
• FIXATION of radio-ions by hydrothermal reactions with clays. FIXATION onto glass or cement matrices.
• ION-EXCHANGE.
• PRECIPITATION/ADSORPTION. • SOLVENT EXTRACTION.
1.6 METHODOLOGY OF MEDIUM-LOW LEVEL WASTE TREATMENT.
1.6.1 FIXATION
Radio-ions may be incorporated into glass or cement matrices after separation by other methods. The waste must be
in a form compatable with cement or glass. In order to immobilise these radio-ions, work has been carried out on fixation of these ions into relatively insoluble alumino-silicate clay materials, which are allowed to react with aqueous caustic solutions of waste
at temperatures 30-100°C. The reaction product from sodium and nitrate-containing wastes is a salt-filled, alumino-silicate in which radioactive ions are trapped [REF. 2).
1.6.2 ULTRAFILTRATION
This is a technique where membranes with a capacity of less than 0.01 pm are employed under cross-flow conditions. A waste stream containing solid, active particles may be decontaminated in this way and the cross-flow of effluent prevents fouling of the membrane. The process is dependent on feed composition and process conditions [REF. 31.
1.6.3 ELECTROCHEMICAL METHODS
An electrode may be used in the form of an ion-exchanger to attract radioactive components depending on the applied electric potential. Elution of the attracted species is possible. The method can be used in conjunction with ultrafiltration membranes
12
1.6.4 BIOMASS
Bacterial cultures have been found to absorb radioactive cations when fed a nutrient broth containing these cations. Problems are inevitable as the activity must be stored in suitable,
non-biodegradable structures and mutation may result within the bacterial culture.
1.6.5 ION-EXCHANGERS
A variety of ion-exchanger substances have been
investigated including organic resins, zeolites, clays and other inorganic ion-exchangers.
Organic resins tend to break down from the radiation of the active ions accumulating within them. They are expensive and not as compatable with encapsulating media as inorganic ion-exchangers. Studies conducted for Springfields [REF. 5] using resins such as Dowex 50W, Duolite ES467 and Amberlite 200 showed that these resins will remove thorium-232 from 1.5M nitric acid solutions but difficulties were experienced in removing thorium from Duolite ES467 which had the best affinity for thorium. In most cases, regeneration of an organic resin will result in larger volumes of radioactive liquid waste being produced, thus causing more problems,- At Springfields, it would be useful to regenerate
the expensive resin and obtain reasonably pure uranium for commercial reasons.
titanium phosphate, hydrous titanium oxide and zirconium phosphate to remove plutonium and other a-emitters from wastes [REFS.6,17]. The ion-exchange properties of a wide variety of ion-hydrated oxides and substances such as mercarbide polymer have been studied in the removal of technecium and ruthenium anions from waste
streams [REF.7]. Complex hexacyanoferrates have been studied as inorganic ion-exchangers [REF.8] but were found to have some sorption nature [REF.3]. Functionalised silicas are aLso being studied in the form of silica gels with covalently bonded groups. These have been used to remove ruthenium complexes from waste
streams [REF.9]. This also, is strictly not an ion-exchange process but more akin to a co-ordination with the functionalised group so producing a monolayer of radioactive component on the
surface of the silica. The radiation stability of these substances has been proved [REF.3] but the exchangers, especially silica gels, are expensive. Inorganic oxides have some drawbacks in that they are only useful over certain finite pH ranges.
Zeolites are three-dimensional alumino-silicates and differ structurally from two-dimensional clays. Zeolites have been used extensively as ion-exchangers in radioactive waste treatment [REFS.18,19,20,14]. Inorganic ion-exchangers and
zeolites fulfil the criteria for use as.waate treatment substances. These criteria are:
• Low leachability in water.
14
• High thermal conductivity.
• Low volume and reasonably high capacity.
• Resistance to swelling or shrinkage on ion-exchange. • Low cost.
• Regeneratability/compatability with cement/glass.
• General chemical stability in acid or alkali conditions. Much of the work done on zeolites has been conducted on the isotopes of caesium and strontium in alkaline pond waters. Original work on inorganic ion-exchangers was conducted in America and in Britain as early as the 1930's [REF.15]. By the 1960's zeolites such as clinoptilolite and zeolon 900 had been studied and were found to effectively remove caesium-137 and strontium-90 from spent fuel waste at the Idaho Chemical Processing Plant in the U.S.A. [REFS.2,10]. In 1963, a clinoptilolite ion-exchange column was commercially removing these isotopes from the waste stream just mentioned and reduced the radio-isotope components to drinking water levels. In more recent times, the Sixep plant at British Nuclear Fuels plc (Sellafield) utilizes clinoptilolite in the same way [REF.16].
abundant and may be found in many parts of the world. They are cheap and similar versions may be produced synthetically and this leaves possibilities of preparing a zeolite that has been 'tailored' to specific requirements. A choice of zeolites with differing silica: alumina ratios is available. Hence, in acid pH solutions it
would be preferable to use a zeolite with a high silica content to avoid significant structural breakdown [REF. 21]. Many inorganic ion-exchangers, especially the oxide exchangers, may only be used over finite pH ranges. The disadvantage of using natural zeolites as opposed to the more expensive synthetic types is that natural zeolites contain impurities such as calcite, alumina, amorphous material and material from the rock
depositions in which they are found [REF.21]. These impurities however may actually enhance any uptakes of radionuclides rather
than deter
them.-1.6.6 PRECIPITATION and SOLVENT EXTRACTION
The methods of waste management so far discussed have been modern. The two oldest methods are precipitation and solvent extraction. Both methods are efficient but solvent extraction is very expensive on a large scale and also, can be dangerous, where flammable solvents are concerned. Radioactive ions such as UO
2 2+
16
of sodium nitrate [REF.22]. Chemical precipitation and co-precipitation may be used to separate isotopes by the
addition of a reagent which will cause certain ions to precipitate or by the use of subtle pH changes. The precipitate may then be filtered, washed and treated with another reagent to solubilize the isotope concerned. The precipitation of a selected species is governed by the solubility coefficient of the isotope-reagent system, the reagent used and/or the changes in pH necessary to precipitate the species. e.g. Thorium may be precipitated in the form of thorium hydroxide by adding sodium hydroxide. As soon as the pH rises above 3.8 the thorium hydroxide is formed as a gelatinous, white precipitate. In this way thorium may be separated from many impurities [REF.11]. Thorium
precipitation techniques were initially used to separate thorium from impurities in its ore so to enable its analysis, after being freed from interfering substances [REF.12].
In a system as complex as the plant raffinate,
precipitation becomes a difficult procedure, as iron and other metal hydroxides may co-precipitate with thorium and uranium. This would make subsequent separation necessary and is not particularly desirable.
Some inorganic ion-exchangers and zeolites with a high surface pH may be prone to surface precipitation of ions such as uranium and thorium [REF.13]. This effect will be discussed in more detail in subsequent chapters but it is
are prone to surface precipitation or adsorption. If they do tend to precipitate radionuclides it must be considered that the
ion-exchange process may not be total and may give rise to results that appear to be 'over-exchange% when considering the capacity of the exchanger.
1.7 LIQUID WASTES AND AIMS OF THE PROJECT
All the waste management methods mentioned so far produce end products which are in the solid form. If a waste is in
liquid form then it is voluminous, bulky and difficult to transport and handle. Liquid wastes pose problems where containment is necessary. Leakage from containers is always a possibility. The wastes themselves may be in the form of corrosive liquids. Heat generation from the decay of radio-isotopes causes liquid expansion and pressure build-up in sealed containers. These factors cause structural-weakening of
containers and give rise to concern about containment and
storage of such wastes. Most of waste management is concerned with converting the radioactive components of a liquid waste into
a volume-reduced, concentrated, isotope-filled solid for which containment and transport is relatively easy.
The aim of this project is to remove thorium and uranium from a liquid waste by using zeolites thus fulfilling the
pre-requisites of Nuclear Waste Management to produce a smaller-volume, stable solid which is compatable with encapsulation
18
13-activity. The study was concentrated upon thorium-232 in its natural a-activity form and several problems arose throughout the project and were overcome by techniques discussed in
19
2. ZEOLITES
2.1 OCCURRENCE
Zeolites are one of the earths most common mineral types. There are several environments for zeolite geological deposition, these include:
Saline-alkaline lakes, Open hydrological systems,
Saline-alkaline soils, Sea-floor sediments,
Hydrothermal alteration of rocks in which zeolites may be found. Zeolites may also occur by burial diagenesis of rock or may be found in volcanic tuffs. Substantial deposits of zeolites are to be found in the USA, Japan, Europe, Mexico, Cuba and on the beds of the oceans [REF. 4]. Zeolites may be
defined as crystalline aluminosilicates with a tetrahedral framework surrounding interconnecting voids and channels, which contain mobile water molecules and cations. They have the empirical oxide formula:
M
2/n 0.A1203.xSiO2.yH20
where M represents one or more cations, n represents the cation valency, x and y represent the numbers of silica and water molecules respectively.
2.2 NATURAL AND SYNTHETIC ZEOLITES
The wide range of applications of zeolites led to studies of the preparation of synthetic zeolites. Natural
zeolites are cheap but do . contain impurities such as compounds, e.g. sodium chloride, calcite, and other occlusives such as
quartz. These impurities may be expensive to remove and other impurities may exist as unaltered minerals, such as volcanic tuff, which did not undergo the slow chemical reaction when the zeolite itself was formed.
Natural zeolites are not pure in the chemical sense and two or more zeolites may be found together in deposits as
intergrowths. Eastgate 2020, for example, is predominantly erionite found with mordenite. A zeolite like this may be
difficult to classify as samples taken for analysis may vary from e.g. mordenite-rich to erionite-rich in the case of Eastgate, depending on the position of the deposit from which the sample was taken.
The advantage of preparing synthetic zeolites is that the presence of impurities may be regulated or omitted altogether, however, tonne for tonne, synthetic zeolites are more costly
than their natural counterparts. Synthetic zeolites A, X and Y were prepared by workers at the Union Carbide Laboratories
21
The most common natural zeolites include analcime, clinoptilolite, heulandite and phillipsite. Other natural zeolites which are of potential commercial value include chabazite, erionite, mordenite and ferrierite.
2.3 USES OF ZEOLITES
Of the numerous uses of zeolites, the biggest use, per tonne, is as a detergent builder [REF. 23]. They are used as catalysts [REFS. 47,48] and as absorbents. Zeolites can be used as ion-exchangers, the mobile cations contained within the voids of the zeolite framework allow for exchange of these cations in external aqueous solutions to the zeolite [REF. 24]. Exchange may occur in aqueous or non-aqueous solutions.
Zeolites are used as drying agents and find such practical applications in organic solvent drying procedures. They are often used for their molecular sieving prolierties as many molecules can be separated, providing their sizes are
suitably different. This property is dependent on the type
and void size of the zeolite [REF. 25]. An application previously mentioned is in radioactive waste treatment, due to the
ion-exchange properties of zeolites, but further applications in general waste-water treatment exist. Zeolites have been used in the farming industry to remove ammonia from confined spaces where animals are kept [REF. 26].
enabling plants to utilize not only the loaded material but the nutrient minerals and elements provided by the zeolite itself, leaving only natural deposits [REF. 27]. Studies have been recently made on the uses of zeolites as slow drug-release systems [REFS. 28,29]. Here a drug such as dichlorovos (DDVP) which is an anthelmintic, may be loaded onto a zeolite and
taken orally by a parasite-infested animal, such as a pig. The zeolite may then slowly release the anti-parasitic drug as it traverses through the digestive system oi the waimal, th\Ns
eradicating the parasite.
Other recent studies of the uses of zeolites include the utilization of zeolites as fillers in the paint industry [REF. 30]. These are just some of the uses of zeolites and it can be seen that their applications may lend themselves to many industries.
2.4 ZEOLITES : DEFINITION AND STRUCTURE
Zeolites are aluminosilicates with a rigid, infinitely extending, open, three-dimensional structure. They may be classified into seven groups, in which their alumina/silica ratios are different. The sharing of the oxygen atoms at the corners of these alumina and silica tetrahedra enable the structure of a zeolite to extend in three-dimensions [FIG.4].
The net negative charge resulting from the (SiO 4)
and (A10
4)
/
0
••nn wip OD . . Op M. mi. lia no. dm I1M am add MS OW MP ••• •n• . MP m• ma ws,n
0 ad
.M O. •Islo did
.d. , 0
mi, ado mad
dm. m. .
0 00 did old
,
23
Silica and Alumina Tetrahedra in Zeolites.
/l///'
k., li ‘‘n / 1 \
1/ 1 %
/ V %
Al
Fig. 4 .
are usually alkali or alkaline earths and are located at specific sites within a zeolite structure (FIG.7). The framework
composition controls the framework charge and thus influences structural stability e.g. silica-rich zeolites such as mordenite are more stable than other zeolites in high temperatures and hostile environments. The internal void and channel volumes are determined by the framework topology and also by the presence of non-framework species such as water molecules, cations and other occlusives [REF. 34]. The internal voids consist of:
1) Channels (unidirectional or interconnected).
Zeolites are often discussed in terms of ideal structure and a zeolite structure may be broken down into 'secondary building units' (SBU's) which are repeatable throughout the zeolite framework. These units, proposed by W.M. Meier, are shown in FIGURE 5. The solid lines represent loci between tetrahedral centres i.e. aluminium or silicon. Oxygen atoms may be found near the centres of the lines but may not necessarily be
positioned on them. Zeolite structures also contain polyhedral cages or voids described by R.M. Barrer [REF. 35]. Some more
common polyhedra are shown in FIGURE 6. MEIER and BARRER have recently proposed and reviewed new approaches to zeolite frame-work classification [REFS. 36,37]. A zeolite structure is built up from these SBU's and gives rise to a characteristic system of interconnecting channels and voids. The entry of cations to these channels is restricted by the size of the
channel aperture and is thus limited by the ring of comparatively large oxygen atoms from the silica and alumina tetrahedra.
Water molecules may be contained within the cavities or channels of a zeolite or may be co-ordinated with the cations sited
within these voids.
2.5 ZEOLITE STRUCTURE AND ION-EXCHANGE
S 4R
S 6 R
S 8R
06R
4
d
_-_-_-v
Secondary Building Units.
1
5
0
10
18016
T10 020
Key
S:
Single
D: Double
R: Ring
T:
Tetrahedral centre
0: Oxygen
kYD
D6R
Typical Zeolite Polyhedra.
a
P
6
)1
E
Key
a
13
E
5
26 -hedron
14 - hedron
18 -hedron
11- hedron
D8R, D6R
27
Cation Sitings for Zeolite Y [Ref. 34]
Sx
•11.
I 16-fold site in the centre of the D6R.
I' Site on the inside of the S-cage, next to the D6R. II' Site on the inside of the sodalite cage near the S6R. II Site which approaches the S6R outside of the S-cage
lying within the large cavity opposite site II'. III Positions in the wall of the large cavity (12-ring
aperture). IV 12-ring sites.
selectivities in zeolites are not governed by the same principles as those for other inorganic ion-exchangers. The inherent
zeolite structure is responsible for this and cation exchange may alter many physical and chemical properties of zeolites. For example, the stability of the zeolite may be affected along with its selectivity and adsorption qualities.
For ion-exchange to occur, a cation must diffuse into the zeolite structure and the outgoing cation must diffuse out via the zeolite apertures or "n-oxygen windows" (n is an integer). Thus the kinetic energy of the diffusing cation species with
respect to the potential energy barrier of the aperture is important. The twisted-nature, size and shape of the channels can provide obstacles to ion-exchange and result in slower diffusion rates.
Cation-exchange is dependent on the size of the cation species (anhydrous and hydrated) and the cation charge. For exchange to occur the cation must be able to fit through an aperture and may need to shed its co-ordinated water molecules to do so. The cation may then co-ordinate with other water molecules once within a void or channel. The diameter of an
29
Other factors which govern ion-exchange are:
1) temperature, which causes thermal vibration changes in the atoms forming an aperture making the "effective" diameter of the aperture smaller.
2) the concentration of the cation species in solution. 3) the solvent.
4) the anion associated with the cation species in solution. Cation exchange may fail to occur if the cation itself is too large in size to enter the smaller cavities and channels or if the charge distribution on the zeolite is unfavourable for the exchanging cation. The exchangeable cation of the zeolite also may be locked within a section of the structure due to anomalies or defects produced when the zeolite was made and are thus rendered non-exchangeable. Some cations within the
zeolite structure may be held more strongly in certain parts of the framework structure.
The framework charge density of a zeolite decreases with increasing Si/A1 ratio and is governed by the alumina content of a zeolite. Often, a zeolite containing larger amounts of aluminium will undergo ion-exchange more readily than a zeolite with a large amount of silica.
2.6 CHANNEL TYPES
TABLE 1 MAJOR CHANNEL TYPES
SYSTEM EXAMPLE
A 3-dimensional, non-intersecting system.
ANALCIME
A 2-dimensional, intersecting system.
CLINOPTILOLITE MORDENITE
A 3-dimensional, intersecting system containing equidimensional channels.
CHABAZITE ERIONITE A and X
A 3-dimensional, intersecting system with non-equidimensional channels.
OFFRETITE GMELINITE
2.7 HYDROXYL GROUPS
Surface hydroxyl groups exist at the edges of zeolite crystals where the framework structure has been broken. The quantities of these surface hydroxyl groups varies according to the crystal size and is directly proportional to the crystal size [REF. 38]. Solid potassium bromide/zeolite disc analysis, using Fourier transform infra red spectroscopy has shown that structural hydroxyl groups also exist [REF. 39,92]. During cation exchange in aqueous environments, cations may undergo
. a Rare&
hydrolysis which may give rise to A cation deficiency and replacement by hydroxyl groups or replacement by hydronium ions (H
30 +
31
may be substituted by these hydroxyl groups when strong acid is used, which may also cause dealumination of the zeolite. There is less of a hydrolysis effect when most high-silica zeolites are used. The surface hydroxyl groups render the surface of a zeolite alkaline e.g. the surface pH of a zeolite such as clinoptilolite may be as high as 11.
2.8 CHARACTERIZATION OF ZEOLITES
The characterization of a zeolite involves the need to know information about the crystal structure, chemical composition and the physical and chemical properties exclusive to zeolites. X-Ray Powder Diffraction (XRD) techniques
enable unit cell constants and crystallographic structure to be determined as well as elucidation of impurities.
Wet chemical analysis enables a complete elemental picture of the composition of a zeolite and enables the Si/A1 ratio of the zeolite to be determined. Wet chemical analysis of zeolites will be discussed further in following experimental chapters. The classification of a zeolite may be confirmed by its ion-exchange and adsorption properties among other physical and chemical properties, such as stability and dehydration behaviour. Differential Thermal Gravimetry (DTG) is a useful tool as many zeolites give quite different DTG curves and is a quick and simple method to determine dehydration behaviour.
c,9
2.9 ZEOLITES AND ZEOLITIC MATERIALS USED IN THIS WORK In order to find zeolites which may be useful in the removal of thorium and uranium from aqueous solutions it was necessary to screen many zeolites and zeolitic materials. A wide variety of zeolites of different types were investigated, both synthetic and natural. The emphasis was placed on a zeolite which could remove thorium and its daughters from solution.
A complete list of zeolites used in this work may be found in TABLES 2 and 3.
When considering the nature of the plant raffinate, containing the radioactivity, the zeolite structure must be able to withstand acid attack and to be reasonably selective for thorium. The Th 4+ ion has an ionic radius of 0.99X [REF. 51] and will exist as a hydrated ion in acid solution, so the zeolite aperture must be large enough to allow the ion to enter into the structure.
In the following, a few selected zeolites will be discussed in more detail and TABLE 4 shows the typical unit cell and Si/A1 ratios for the zeolites discussed.
2.10 CLINOPTILOLITE
Clinoptilolite has a well defined framework structure with a high Si/A1 ratio of between 4.25 and 5.25. Mudhills
clinoptilolite has a Si/A1 ratio of 5.36 and is thus compatible to that of mordenite. Clinoptilolite is well known as an
33
A COMPLETE LIST OF ZEOLITES AND ZEOLITIC MATERIALS USED IN THIS WORK TABLE 2
ZEOLITE (NATURAL) AREA OF ORIGIN
ANALCIME BREWSTERITE CHABAZITE 1 CHABAZITE 2 CHABAZITE 3 5050/F CLINOPTILOLITE 1010/A
COWLESITE , EASTGATE 2020 ERIONITE 3030 FERRIERITE HEULANDITE MORDENITE NATROLITE PHILLIPSITE
Wikieup, Arizona, USA. Whitesmith Mine, Strontian, Argyllshire, Scotland. Christmas County, USA. Beaver Divide, USA. Bowie Divide, USA. Anaconda, USA.
Mudhills, California, USA. Anaconda, USA.
Kingsburgh, Skye, Scotland. Shoshone, USA.
Shoshone, USA. Nevada, USA. Iceland.
Lovelock, Nevada, USA. County Antrim, N. Ireland. Pine Valley, Nevada, USA.
TABLE 3
ZEOLITE (Synthetic) MANUFACTURER
Na Y
Zeolon 900 4A (powder) K L
5A (with binder) 5A (powder) 13X
Laporte Industries. Norton, RD 569/85. Laporte.
RD 737/86 Laporte. RD 132 Laporte. Laporte.
Laporte.
TABLE 4
TYPICAL UNIT CELL COMPOSITION AND Si/A1 RATIOS FOR SELECTED ZEOLITES
ZEOLITE UNIT CELL COMPOSITION Si/A1 RATIO
CLINOPTILOLITE Na 6 [(A10 2 ) 6 (Si0 2 ) 30 ].24H 2 0 4.25-5.25
ERIONITE (Ca,Mg,K2' Na2 )45 [(A10
2)9(SiO2)27b27H20 3.0 -3.5 CHABAZITE Ca2[(A102)4(Si02)16].24H20 1.6 -3
MORDENITE Ny(A102)8(Si02)401.24H20 4.17-5
Z900 Na
8.7 [(A102)8.7(SiO2)39.3].24H20 4.5 -5 Y Na56[(A102)56(S102)136].250H20 4.8
35
exact sitings of these ions within the framework is not known,
however A. DYER and A. ARAYA have proposed some ion sites [REF. 40]. There are five ion sites altogether, 3 in channels and at least one in a cavity.
The structure of clinoptilolite consists of sheet-like arrays of T 10 0 20 units of tetrahedra (where T represents a tetrahedral centre, silicon or aluminium, and 0 represents oxygen).
The plate-type structure is similar to the lamellar structure of heulandite [REF. 41,42]. The pore size of Mudhills clinoptilolite is 4.0R and the pore volume accounts for 15% of the total volume. The solid density of the zeolite is 1603 Kgm-3. Due to its high Si/A1 ratio the ability of clinoptilolite to stand up to acid attack is considerable compared with other zeolites such as A with a lower Si/A1 ratio'. E.G. Alkali stability is between pH 7 and 11, acid stability is in the pH range 1.5-7. In work done by D. Keir,clinoptilolite was found to resist acid attack when contacted with 8M nitric acid whereas chabazite was severely attacked by acid of greater concentration than 0.1N [REF. 211. A typical clinoptilolite structure configuration may be seen in FIGURE 8. A study of the uptake of uranyl ions on clinoptilolite has been produced by N.R. ANDREEVA and
Clinoptilolite.
37
2.11 ERIONITE
Erionite [FIG.9] consists of double 6 rings (D6R) linked by single rings (S6R) and has 23-hedron and 11-hedron cages. Erionite has 3 channels and the main pore size (the free aperture of the main channel) is 3.6 x 5.2
R
and is thus elliptical in shape. The channels are tortuous and it is difficult for cation diffusion to occur because of this even though the large cages are present. Erionite is most commonly found with chabazite but surprisingly enough, is found with mordenite in the Eastgate sample used in this work. The crystals themselves are fibrous in nature and are considered to be carcinogenic to the lungs in the same way as fibrous asbestos [REF. 44]. Erionite is reasonably stable in acid being converted to the H+ -form of the zeolite, its metal cations being replaced by H+ or H30 +
.
2.12 MORDENITE and ZEOLON 900 (Z900) Mordenite consists of
T8016 units and has two intersecting elliptical channels. These channels allow free movement of
cations within them and have cavities available to cations next to them [FIGURE 10]. The channels have main free apertures of 6.7 x 7.0 X and 2.9 x 5.7
R
and the cavities have a free diameter of 3.9g.The synthetic Z900 is a "wide port" version of mordenite [REF. 68] and has a more open structure allowing for the
diffusion of larger molecules. Mordenite has the highest
Erionite.
39
Mordenite.
mordenite significant resistance to acid attack [REF. 21].
2.13 CHABAZITE
The structure of chabazite [FIGURE 11] consists of an array of double 6 ring units of tetrahedra. There are three channels which intersect at a large, ellipsoidal 20-hedron cage. The entry to the cage is governed by the 3.7 x 4.2 R channel aperture. Ten cation sitingpexist primarily in the 20-hedron cavity but there is a cation siting within the double 6 ring
[Ref. 45].
The Si/A1 ratio of chabazite is low and it is easily destroyed by acid attack. [REF. 21]. The adsorption and ion-exchange properties of chabazite vary greatly depending on the depositional origin of the zeolite as will be shown later.
2.14 ZEOLITE Y
Zeolite Y is a synthetic faujasite with 14-hedron
cavities and 26-hedron "supercages". The structure consists of a double 6 ring array and there are three channels which have
a large aperture of 7.4R and a smaller aperture of 2.2R [FIGURE 12]. The high silica version of Y used in this work (Si/A1 = 4.8)
41
Chabazite.
Zeolite Y.
43
2.15 ZEOLITE A
In zeolite Y, the unit cell consists of truncated octahedra [FIG.6] joined by double six-membered rings, the unit cell of A is formed by truncated octahedra joined by double four-rings. The 3-dimensional channel system consists of large cavities with free-diameters of about 11R, which are separated by eight-membered oxygen rings. The sman apertures have free diameters of 4.2R. The structure is shown in FIGURE 13. Cations are locked close to the apertures and changes in the
cation type results in changes in the pore size. The low silica/ alumina ratio (less than 1.5) of this zeolite renders it unstable in even weakly acidic solutions. It dissolves completely in 0.5M nitric acid and, depending on the volume of acid present, may form a gel.
2.16 EASTGATE 2020
45
2.17 OTHER ZEOLITES
The remaining zeolites and zeolitic materials mentioned in TABLES 2 and 3 will not be discussed here, but for convenience will be considered in the discussion chapters.
2.18 ION-EXCHANGE CAPACITY IN ZEOLITES
The base exchange capacity of a zeolite in solution depends on the hydrated zeolite composition i.e. the number of aluminium sites. The specific cation exchange capacity depends upon the exchange cation itself [REF. 34]. Capacity is usually expressed in units of milliequivalents per gram (meq.g-1) where mifliequivalents of a cation = millimoles x valency of cation.
In this work, treatment of kinetics and equilibria has been conducted using the base exchange capacity of the zeolite, although some experiments were conducted to find the specific cation exchange capacity of selected zeolites. The measurement of ion-exchange capacity from aluminium content in natural
zeolites may be found to be slightly larger than the real value, because often cations, in e.g. clinoptilolite, may not participate
in easy exchange.
To measure the specific cation exchange capacity of a particular zeolite for a probe ion such as thorium would be difficult, as the mechanism of thorium uptake on different
2.19 BASIC ION EXCHANGE THEORY
2.19.1 KINETICS
When considering molecules or ions (A) sorbing onto zeolites (Z)
AZ K===== AZ Equation 2.1
at equilibrium, it can be said that the number of species entering the solid must be equal to those leaving the solid. This provides the basis for the measurement of distribution coefficients (K
d) of ions in solid and solution (S)
_ No. of equivalents of A per gram of solid "(A) No. of equivalents of A remaining per cm3solution
[A] x cm3 solution i.e. Kd (A) =
[A] s x g solid
Equation 2.2
The units of Kd's are thus, cm3g-1 , but are usually omitted. if a Kd value is high, then a good uptake of ion A is found.
2.19.2 ION EXCHANGE MECHANISM [REFS. 65,66,67,64]
When considering the following equation at equilibrium:
n* n t n+
n B-D + BD + nAA
A (Z) fl (S) nA (S) B (Z)
Equation 2.3
Where n
A' nB represent charges of the exchanging cations A and B and (Z), (S) represent the zeolite and solution phases respectively. If cation B, initially in the zeolite, is in contact with a
milliequivalents of A in the crystal phase (zeolite) Eqn. 2.5
Ac_C 3+ .
milliequivalents of Al in the zeolite
As
47
and the zeolite has a preference for ion A, then exchange will occur, suggested by the previous equation.
An ion-exchange isotherm is a plot of A as a function of A where, with respect to the cation A,;
milliequivalents of A in solution A =
S total of milliequivalents of A and B in solution Eqn. 2.4
(A
C + BC ) = 1 Equation 2.6
(A
S + BS ) = 1 Equation 2.7
The isotherm must be constructed from data obtained at equilibrium and at constant temperature and pressure. The isotherm extends from a point of maximum A in solution to maximum B in
solution. A series of variable proportions of A and B lie in between and isotherms fall into several groups as shown in FIGURE 14.4.
Isotherm Types
Where the four curves shown represent:
1) The exchanger is not as selective for ions A over, ions B. There must be a large concentration of A ions in solution. 2) The exchanger has no preference for either ion over the
whole system.
3) There is a definite concentration dependence at which the exchanger will be selective for ion A.
4) The exchanger is selective for A ions.
The isotherm may be treated further to produce AG values (Gibbs Free energy of the reaction) and diffusion constants.
This treatment was not used for thorium for several reasons and only isotherm plots were obtained:
1) Activity coefficients of solution are not available for thorium. 2) In order to construct isotherms, there must be a closed system
involving the ion A (e.g. thorium) and ion B (e.g. potassium) and the zeolite itself, in a homionic form e.g. (K-clinoptilolite) As experimentation proceeded, it was found that what was taking
C
eq _ 1 4. 1
(l eg Kcimax qmax C
eq Equation 2.8
A
eq
SLOPE=
(leg
q mar.
INTERCEPT.-1_—_ Kqmmx
49
2.20 LANGMUIR ADSORPTION ISOTHERMS
Zeolites may be considered to experience monolayer- adsorption (corresponding to void-filling). Much work on the adsorption of gases onto zeolites has been carried out [REF. 94]. In this work, adsorption of species which are in solution are more relevant and adsorption is displayed by the following equation [REF. 93].
Where : C
eq represents equilibrium concentration of species in solution
represents equilibrium concentration of qeq
species in solid is a constant
is the maximum concentration in the solid. qmax
If adsorption is occurring, a plot of
Ceq/qeq 'vs' Ceq will be linear with slope
1/qmax and intercept 1/Kqmax as in FIGURE 14B.
Langmuir Adsorption Isotherm.
C
eq50
3.1 THORIUM OCCURRENCE AND USES
The most stable isotope of thorium is 232Th which is an a-emitter of very long half-life (ti = 1.41 x 10 a). 10 Thorium has no stable, non-radioactive counterpart. Even though thorium
is a fairly abundant element, only a few hundred tonnes are extracted per annum. The earth's crust contains (1-2) x 10-3% weight of thorium and thorium is about three times as abundant as uranium.
Thorium was first discovered in 1828 in a Norwegian mineral by Berzelius, but it was not used industrially until 1885 when
Auer von Welsbach discovered that thoria became incandescent when heated. Von Welsbach developed the gas mantle and this was the largest single use of thorium upto 1973.
The principal source of most of the lanthanides and thorium and uranium
is
monazite, a mixed phosphate containing thorium, lanthanum, yttrium and uranium. The ore may bedecomposed by concentrated sulphuric acid. Dilution, followed by careful adjustment of pH (by addition of a mixture of oxides) results in the selective precipitation of thoria (Th0 2 ), this impure oxide is then dissolved in hydrochloric acid and the thorium extracted by tri-butylphosphate.
Thoranite contains up to 90% Th0
2 and has been worked in Madagascar.
Thorite, a silicate material containing up to 62%
thorium, is found in the Western USA and New Zealand. However, Monazite is more available and contains 1-10% thoria. On
weathering of thorium-containing rocks, the heavy thorium-containing monazite sands are formed and are found in Australia, Brazil,
India, South Africa, Sri-Lanka and the USA.
The world consumption of thorium in 1970 was estimated to be approximately 270 tonnes. From this, 50% was used as thorium nitrate in the preparation of gas mantles, 40% was used in the metallurgical industry, the remaining 10% was used for refractories, catalysts and in nuclear reactors [REF. 53].
More recently, the utilization of thorium in the nuclear industry is expected to increase. The estimated demands of thorium in the year 2000 by the U.S. Bureau of Mines are:
NON-NUCLEAR USES 50 - 520 tonnes.
NUCLEAR ENERGY 600 - 700 tonnes for thorium-burning nuclear reactor systems.
Due to the availability of the thorium, no supply problems are anticipated [REF. 53].