Journal of Chemical and Pharmaceutical Research, 2016, 8(1):203-207
Research Article
CODEN(USA) : JCPRC5
ISSN : 0975-7384
Stability of oil in water emulsions stabilized by polymer and surfactant
Bin Xu
Department of Chemical Engineering, Binzhou University, Binzhou, Shandong, China
_____________________________________________________________________________________________
ABSTRACT
Polymer/surfactant flooding produced liquid is difficult to treat compared with water flooding due to large quantities of residual chemicals which lead to serious emulsification. Dewatering rate of O/W emulsions by bottle test, particle size distribution measurement and multiple light scattering measurements were employed to study the stability of the O/W emulsions stabilized by both polymer and surfactant. O/W emulsions stabilized by polymer and surfactant get more stable when polymer/surfactant concentration increased. Polymer contributes more to the stability of O/W emulsions compared with surfactant. Polymer concentration is the key factor to stabilize O/W emulsion because polymer can form rigid cross-link network at oil-water interface to enhance the stability of the emulsions while polymer can enhance the viscosity of water and thus decrease the collision probability of oil droplets.
Key words: Stability, polymer, surfactant, O/W emulsion, dewatering rate
_____________________________________________________________________________________________
INTRODUCTION
Emulsion systems have been widely used in many industrial fields. During the process of oil extraction, produced liquid is generated as a kind of emulsions, such as W/O emulsions with low water content or O/W emulsions with high water content. The produced liquid is a mixture of oil, water, clay particles and some other chemicals such as polymer and surfactant in chemical flooding produced waste water [1-2].
Polymer/surfactant flooding produced liquid is difficult to treat compared with that from water flooding due to large quantities of residual chemicals which lead to serious emulsification. The destability of O/W emulsions can be accelerated by several chemical and physical methods such as the use of flocculants [3] or demulsifiers [4] or acids or bases [5] or low external electric field [6]. It is of great necessity to study the stability of the O/W emulsions firstly before selecting treatment methods of destability of O/W emulsions [7-8].
In most field applications of polymer & surfactant flooding (SP flooding) in china, the concentration of polymer is about 1000~1500 mg/L while the concentration of surfactant is about 3000~5000 mg/L.
In this study, dewatering rate of O/W emulsions, particle size distribution measurement and multiple light scattering measurements were employed to study the stability of the O/W emulsions stabilized by both polymer and surfactant to explain the influence of both polymer and surfactant on the stability of the O/W emulsions and illustrate the stability mechanism of the O/W emulsions stabilized by both polymer and surfactant.
EXPERIMENTAL SECTION
2.1 Materials
composition is: K+, Na+ 1890 mg/L; Ca2+ 160 mg/L; Mg2+ 27 mg/L; Cl-
2134 mg/L; SO42 -
30 mg/L; HCO3 -
1205 mg/L. The polymer (partly hydrolyzed polyacrylamide, HPAM) with an average molecular weight (MW) of 1.5×10⁷ and a degree of hydrolysis of 28% and surfactant with a major component of petroleum sulphonate are all industry products.
2.2. Preparation of synthetic O/W crude oil emulsions
The synthetic O/W emulsions stabilized by polymer and surfactant were prepared by mixing the crude oil and the simulated water with a certain amounts of polymer and surfactant (2:8, V/V) using a FM-200 homogenizer (Fluko Corp.) at 45 with a rotating speed of 6000 rpm for 10 mins.
2.3. Stability of synthetic O/W emulsion
Dewatering rate X was employed to evaluate the stability of the synthetic O/W crude oil emulsion which can be calculated by the following formula:
%
100 × V V =
X t 0 (1)
Where V0 is the original water volume of an emulsion sample before bottle test, Vt is the separated water volume
after setting a certain time at 45 . The bigger the dewatering rate is, the higher the stability of the synthetic O/W emulsion.
2.4 Particle size distribution measurement
Particle size distribution was analyzed by Rise-2006 laser particle size analyzer (Jinan Rise Science & Technology Co., Ltd.) according to the full range Mie scattering theory at room temperature. The measurement range is from 0.02 µm to 1200 µm.
2.5 Multiple light scattering measurements
The stability of waste water was monitored by measuring the transmittance and back scattering of a pulsed near infrared light (λ=880 nm) by Turbiscan Lab Expert manufactured by Formulaction (France). The transmittance detector received the light which passed through the dispersion at an angle of 180º with respect to the source, while the back scattering detector received the light scattered backward by the dispersion at an angle of 45º. Polymer and surfactant stabilized O/W emulsions were placed into cylindrical glass tubes and submitted to Turbiscan Lab Expert stability analysis. The stability of emulsions can be evaluated by TSI parameter (Turbiscan Stability Index) by Turbiscan EasySoft [9].
RESULTS AND DISCUSSION
The dewatering rate of the O/W emulsions stabilized by 1000 mg/L polymer, 3000 mg/L surfactant and polymer & surfactant at 45 is shown in Fig. 1. It can be seen from Fig. 1 that the O/W emulsion stabilized by 3000 mg/L surfactant is less stable than that stabilized by 1000 mg/L polymer. The O/W emulsion stabilized by polymer & surfactant is more stable than that stabilized by polymer or surfactant.
0 2 4 6 8 10 12 14 16
0 5 10 15 20
D
ew
at
er
in
g
r
at
e
(%
)
Time (h)
3000 mg/L surfactant + 1000 mg/L polymer 1000 mg/L polymer
[image:2.595.208.395.553.707.2]3000 mg/L surfactant
Figure 1. The dewatering rate of the O/W emulsions stabilized by polymer and surfactant
______________________________________________________________________________
n f
d
X
X
k
dt
dX
/
=
(
−
)
(2)
Where X is the instantaneous decomposed fraction of the emulsion, Xf is the maximum achievable fraction of the
emulsion decomposition, n is the order of reaction, and t is time, kd is the decomposition rate constant. The initial
condition is defined by: X=0, t=td.
)
(
)
(
1 1 d d n f nf
X
X
k
t
t
X
−−
−
−=
−
(3)
The half-life of the emulsion based on the maximum decomposable emulsion fraction can be determined by substituting X =0.5Xf.
d n f n f d k n X X t t ) 1 ( ) 5 . 0 ( ) ( ) 1 ( ) 1 ( 2 / 1 − − = − − − (4)
For our experiment data, n=0.4, Xf=1.
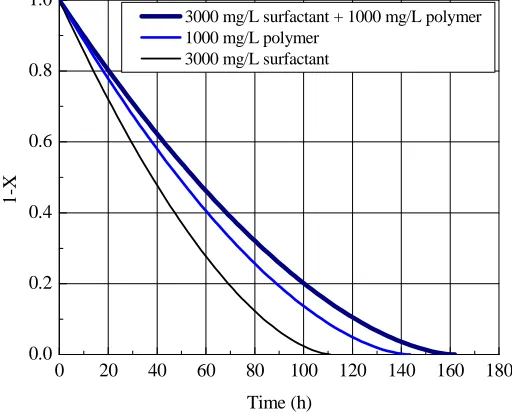
The Straight-line plot of the present data of dewatering rate of the O/W emulsions versus time is shown in Fig. 2. The remaining undecomposed emulsion versus time is shown in Fig. 3, which was calculated with these values in Eq. (3).
0 2 4 6 8 10 12 14 16
0.00 0.02 0.04 0.06 0.08 0.10 0.12
0.14 3000 mg/L surfactant + 1000 mg/L polymer
1000 mg/L polymer 3000 mg/L surfactant
xf (1 -n ) -( xf -x ) (1 -n )
[image:3.595.181.426.291.485.2]t-td (h)
Figure 2. Straight-line plot of the present data of the fraction of separated water from O/W crude oil emulsions vs. time
0 20 40 60 80 100 120 140 160 180
0.0 0.2 0.4 0.6 0.8 1.0 1 -X Time (h)
3000 mg/L surfactant + 1000 mg/L polymer 1000 mg/L polymer
3000 mg/L surfactant
Figure 3. Fraction of remaining undecomposed emulsions
[image:3.595.168.424.519.726.2]polymer is smaller than that stabilized by 3000 mg/L surfactant while the oil droplets of the former is more uniformly distributed. Accordingly, the average oil droplets size of O/W emulsion stabilized by polymer & surfactant is smaller than that stabilized by polymer or surfactant.
1 10 100
0 3 6 9 12 15
F
re
q
u
en
cy
(
%
)
Particle size ( µm) (a)
(b)
(c)
[image:4.595.175.431.120.314.2](a) 1000mg/L polymer + 3000 mg/L surfactant; (b) 1000mg/L polymer; (c) 3000 mg/L surfactant Figure 4. Particle size distribution of O/W emulsions stabilized by polymer and surfactant
0 500 1000 1500 2000 2500 3000 3500
1 2 3 4 5 6
T
S
I
Concentration / mg.L-1
1000mg/L polymer + surfactant polymer
surfactant
Figure 5. Influence of polymer & surfactant concentration on stability of O/W emulsions
To further study the influence degree of polymer and surfactant on the stability of O/W emulsion stabilized by polymer and surfactant, influence of polymer and surfactant concentration on TSI of the O/W emulsions stabilized by polymer and surfactant is further studied and the results is shown in Fig. 5. The higher the TSI value, the less stable of the emulsion. It can be seen from Fig. 5 that TSI values of the emulsions stabilized by polymer decreased more sharply with the increasing concentration of polymer compared with that stabilized by surfactant. The results show that polymer contributes more to the stability of synthetic O/W emulsions stabilized by polymer and surfactant compared with surfactant.
All the results showed that polymer contributes more to enhance the stability of the O/W emulsions compared with surfactant. Polymer concentration is the key factor to stabilize the O/W crude oil emulsion.
______________________________________________________________________________
CONCLUSION
O/W emulsions stabilized by polymer and surfactant get more stable when polymer/surfactant concentration increased. Polymer contributes more to the stability of synthetic O/W emulsions stabilized by polymer and surfactant compared with surfactant. Polymer concentration is the key factor to stabilize O/W emulsion because polymer can form rigid cross-link network at oil-water interface to enhance the stability of the emulsions while polymer can enhance the viscosity of water and thus decrease the collision probability of oil droplets.
Acknowledgements
This research was supported by the Natural Science Foundation of Shandong Province of China (No. ZR2015PB007, ZR2015BL012 ), the Doctoral Scientific Research Foundation of Binzhou University (2014Y15).
REFERENCES
[1] SB Deng; RB Bai; JP Chen, Sep. Purif. Technol., 2002, 29, 207. [2] Z Khatib; P Verbeek, J. Petro. Technol., 2003, 55, 26-28.
[3] YB Zeng; CZ Yang; JD Zhang, J. Hazard. Mater., 2007, 147(3), 991-996. [4] YH Kim; DT Wasan; PJ Breen, Colloids Surf. A, 1995, 95, 235.
[5] CM Chen; CH Lu; CH Chang; YM Yang, Colloids Surf. A, 2000, 170, 73. [6] I Tsuneki; I Keisuk; Y Shigeki; S Masanao, Colloids Surf. A, 2004, 242, 21-26. [7] J Qiu, Petrol. Sci. Technol., 2012, 31(2), 142-147.
[8] T Sharma; GS Kumar; BH Chon; JS Sangwai, J. Ind. Eng. Chem., 2015, 22, 324-334. [9] O Mengual; G Meunier; I Cayre´, Talanta, 1999, 50, 445-456.