Journal of Chemical and Pharmaceutical Research, 2015, 7(3):2302-2308
Research Article
CODEN(USA) : JCPRC5
ISSN : 0975-7384
Effect of coating ceramic membranes with TiO2 to the performance of
electrolyte photovoltaic cell with KI/KI3 solution and carbon as electrode
Arif Yasthophi, Rera Aga Salihat, Admin Alif and Hermansyah Aziz dan Edison Munaf*
Department of Chemistry, Faculty of Mathematics and Natural Sciences, Andalas University, Padang, West Sumatera, Indonesia
_____________________________________________________________________________________________
ABSTRACT
The present study is to investigate the effect of ceramic membrane coating with titania (TiO2) againts the
performance of photovoltaic cell using electrolyte solution KI/KI3 and carbon as an electrode under sunlight
irradiation.The aim of titania coating by sol-gel method is in order to minimize pore size and simultaneously decreasing I2 diffusion. Effect of membrane coating was observed in correlation to the cell performance. Change in
concentration after process was determined by using UV-Vis spectroscopy method. From the results of the current measurement and the stability determination of photovoltaic cell can be concluded that the membrane with five times coating repetition shown the best results compared to other membranes with Imax 296 µA. Otherwise the lowest absorbance will indicate that this membrane has the best performance in blocking iodine molecules from KI3
solution.
Keywords: Photovoltaic cell, sol-gel, UV-Vis spectroscopy, Coating, ceramic membrane
_____________________________________________________________________________________________
INTRODUCTION
Increasing of global energy demand and its various problems has become an important concern nowadays. Energy requirements predicted become doubled in 2050 and tripled in the end of the 21st century [1-2]. Increasing in energy needs is followed by growth of energy production, estimated to be jumped form 17 PWH becoming 28-34 PWH in 2035 [3]. To supply this energy requirement are still dominated by using fossil fuels such as oil, natural gas and coal [4].
One of the alternative technology that can be applied to convert the solar into electrical energy is photovoltaic cells [5-6]. Photovoltaic cell is one among the growing and promising technology that can be used as an important energy source [7]. One of the photovoltaic cells that can be developed in the present work is a photovoltaic cell using KI/KI3 as electrolyte solution and carbon as electrode. In this photovoltaic cell, iodide ion from ionization of KI
play a role in absorbing photons, and then electron would be excited to conduction band and can be used as a current source. Electrons are generated by excitation from iodide ion in half part of photovoltaic cells (anode). Electrons flow through the outer circuit and accepted by I2 on KI3 solution in the other half part of the cells (cathode). After
capture electrons, I2 would be reduced to iodide ion, I-.
In this photovoltaic cell, KI and KI3 solution was separated by ceramic membrane. The role of ceramic membrane is
to decrease the diffusion of I2 form KI3 solution to KI solution. Diffusion of I2 must be decrease because I2 can
disturb the performance of the cell, where is I2 molecules can capture the electrons generated from excitation of I
-ion and then decrease the performance of photovoltaic cells. Therefore, in this study we concern the effect of titania coating on ceramic membrane to decrease pore number and size of the membrane and reducing I2 diffusion in KI3
EXPERIMENTAL SECTION
[image:2.595.183.446.163.305.2]The equipments used in this study were analytical balance, UV-Vis Spectrophotometer Nanostar, Scanning Electron Magnetic (SEM) Hitachi S-3400N, Ampere meter (Heles), resistors, glass glue, PVC pipe, ceramic membranes, and laboratory glasswares. Materials experiment which were used are carbon electrodes, potassium iodide (Merck), iodine (Merck), Titanium isopropoxide (TIP) (Merck), Isopropanol (Merck), diethanolamine (Fison), starch (Merck) and distilled water
Figure 1. Scheme of photovoltaic cell
Photovoltaic cells was constructed as shown in Figure 1
Sol titania was prepared via sol-gel method, 30 mL isopropanol mixed with 4 mL DEA, and 6 mL TIP, the mixtures were stirred for four hours at room temperature. After that the ceramic membrane was dipped into titania sol for twenty second and then drying in oven at 100oC for fifteen minutes. Then, membranes were calcinated at 400oC for one hour. Coating process of membrane was varied with time of repetition such as one time, three times, and five times in repetition.
To observe the peformanace of cell, each half part of photovoltaic cell was filled by 35 mL KI solution (anode) and 35 mL KI3 solution (cathode). Producing current was measured by two method that are non-continuous flow current
and continuous flow current. Irradiation measurement was effectute by using direct sun light as light source between 11:00 and 13:00 and every thirty minutes the current was measured .
The stability of cells was measured by using the same method as in the measurement of producing current. Measurement was done at the same time for all cell. Measuring was used continuous current for three days consecutively.
Determination of the I2 concentration in each part of photovoltaic cells is done by measuring the absorbance of the
solution using UV-Vis sepctroscopy. Sample solution was added by solution of 1% starch as complex agent.
RESULTS AND DISCUSSION
SEM and EDX analysis
Figure 2 show the images of SEM of ceramic membran before and after coating with titania. There are any difference found between ceramic membranes before and after coating with titania. Ceramic membrane before coating has large pore size compared with the ceramic membrane after coating with titania. Ceramic membrane after coating with titania has a smaller pore size because it has been covered by the titania particles.
To determine the composition of membrane surface was analized by using EDX analysis. The results of the ceramic membrane surface composition can be seen in Table 1.
Table 1. EDX analysis of ceramic membrane surface
Before coating After coating
Element Weight (%) Element Weight (%)
O 56,18 O 50,73
Al 4,56 Al 5,07
Si 31,56 Si 15,12
Ti 0,14 Ti 12,84
Measurement current of photovoltaic
[image:3.595.106.506.235.559.2]Measurement of producing current of photovoltaic cells was done in two ways, that is non-continuous current flow and continuous current flow. In non continuous flow, during the irradiation, both electrode is not connected to conductor and only connected during measurement, while in continuous flow, during the irradiation, both electrode is connected to the conductor continuously.
Figure 2. SEM images of ceramic membranes before (a) 5000x (b) 10000x and after (c) 5000x (d) 10000x coating with titania
Figure 3 show curve of producing current from photovoltaic cell with non-continuous flow current (NC) and a continuous flow current (CC). Figure 3 show the current that was produced from photovoltaic cells with non-continuous flow current is increase in the measurement time between 11:00 and 13:00. This increase could be occur due to capacitors effects of carbon electrode and ionic liquid because increase the number of electron number around electrode form excitation of iodide ions [8-9].
From Figure 3 also shown the producing current which was generated by the photovoltaic cells in continuous flow current. Current was decreased during measurement time. The decrease of current in the continuous flow due to electrons generated during excitation of iodide ion through the external circuit was progressively reduced. Similar results were also obtained in other studies conducted by Fuji in production of hydrogen gas, where is also found such decrease of current, the decreasing was caused by particles H2 was formed surrounding the electrode (cathode)
which interfere the electrode to capture electrons [10].
moving from KI solution to KI3 solution. By increasing the number of coating repetitions, membrane pores will be
[image:4.595.145.474.110.439.2]smaller and more difficult to pass by I3- ion, in other words, the membrane is more like insulator.
Figure 4. Curve of producing current of photovoltaic cell at (a) first (b) second and (c) third day
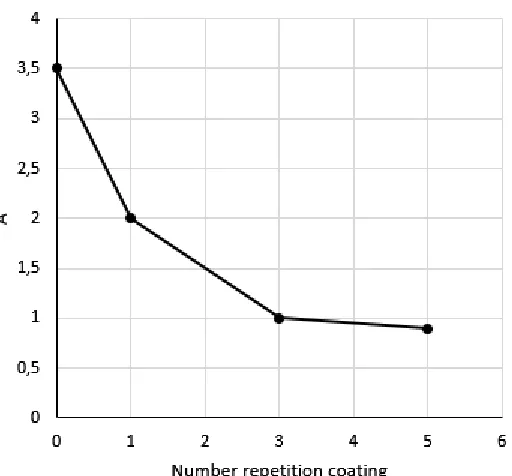
[image:5.595.92.522.323.686.2]Figure 6. Curve of correlation between number repetition of ceramic membrane coating with titania and KI solution + amilum absorbance
Figure 7. UV-Vis spectrum of KI3 solution form a half part of photovoltaic cell (cathode) at (a) second and (b) fourth day
Measuring Stability Photovoltaic Cells
Measurements were performed for three consecutive days during the time interval between 11:00 and 13:00. During the measurement, both electrode is connected continuously by a conductor (continuous flow current).
At the beginning, measurement result a higher current and then decreases as the length of the measurement time and be relatively constant at the end of the measurement. The same pattern was seen in the measurements for the second and third day and occurs every day occur recovery flow. This recovery occurs because when the two electrodes are not connected in a long time, it make I2 molecules that was formed (adsorbed) on the electrode (anode) becomes
soluble/diffuse back into solution so it increase the ability of the electrode to capture the electron.
On measurement the stability of the cells shows that cell using membrane with five times coating repetition with titania show the best results when compared with other cells. It show that coating ceramic membrane with titania affect the performance of photovoltaic cells.
Determination of the concentration of I2 generated and lost in each part of Photovoltaic Cells
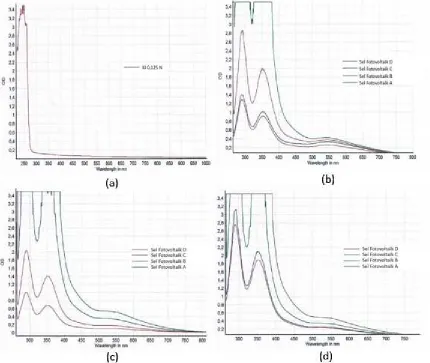
[image:6.595.96.521.341.510.2]Figure 5 show UV-visible spectroscopy measurement from KI solution of photovoltaic cells with time variation (day) after was added starch. In Figure 5a visible peak at a wavelength of 253 nm which is the absorption peak of iodide ions [11]. In Figure 5b, 5c, and 5d there are three peaks, namely at a wavelength of 288 nm, 348 nm, and 544 nm which is the peak of a complex of iodine starch which is consistent with previous studies [11-13]. like seen in the Figure 5 the increasing number coating repetition ceramic membrane with titania, the value of the absorbance of the solution becomes smaller, this proves that the coating of ceramic membrane with titania play a role in decreasing diffusion I2 from KI3 solution.
Figure 6 shows the correlation between the absorbance of the solution was measured at a wavelength of 348 nm with number of coating repetition ceramic on the second day. From Figure 6, it appears that the coating repetitions three times and five times in a line that began to plateau, with this result we can conclude that coating membrane ceramic with titania after five time coating repetition is the optimum condition for aplication in photovoltaic cell using elctrolyte solution KI/KI3.
Figure 7a and 7b are UV-Vis spectrum of the solution KI3 from half part photovoltaic cell (cathode) which was
added starch. From Figure 7 shows that the decline in the concentration of I2 in solution KI3 shown with decreasing
absorbance of the solution of the original KI3 solution. Decreasing the concentration of I2 in KI3 solution is caused
by several factors such as the influence of diffusion through the ceramic membrane and also because the decomposition of I2 after capture electrons into I- (reduction).
CONCLUSION
Coating membrane with titania has a correlation to performance of electrolyte photovoltaic cell with KI/KI3 solution
using carbon as electrode. After observed performance of photovoltaic cell, cell with ceramic membrane after five times repetition coating with titania give the best result with current maximum 296 µA. Result mesurement using UV-Vis Spectroscopy from KI solution indicate that five times repetition coating is the optimum condition for application in electrolyte photovoltaic cell with KI/KI3 solution using carbon as electrode.
REFFERENCES
[1] TW Hamann; RA Jensen; ABF Martinson; Hal V Ryswyk; Joseph T Hupp, Energy Environ. Sci., (2008), 1, 66-78.
[2] C Cho; JY Lee, Optics Express, (2013), 21(2), 276-284. [3] S. Delbos, EPJ Photovoltaics, (2012), 3, 1-13.
[4] JB López; JC González; NF Holguín; JA Sánchez; DG Mitnik, Int. J. Mol. Sci., (2012), 13, 4418-4432. [5] K Branker; MJM Pathak; JM Pearce, Renewable & Sustainable Energy Reviews, (2011), 15, 4470-4482. [6] B Parida; S Iniyan; R Goic, Renewable and Sustainable Energy Reviews, (2011), 15, 1625-1636. [7] H Leif, AMBIO, (2012), 41, 103-107.
[8] Frackowiak; Elzbieta; F Beguin, Carbon, (2001), 39, 937-950.
[9] A Lewandowski; M Galinski, J. of Phys. and Chem. of Solids, (2004), 65, 281-286.
[10] K Fujii; S Nakamura; M Sugiyama; K Watanabe; B Bagheri; Y Nakono, int. J. Hydrogen Energy, (2013), 38, 14424-14432.
[11] A Semnani; M Shamsipur; HR Pouretedal, J. Sci. Teacher Training University, (2005), 4(4), 129-140. [12] X Yu; C Houtman; RH Atalla, Carbohydrat Research, (2005), 340, 981-988.