International Journal of Emerging Technology and Advanced Engineering
Website: www.ijetae.com (ISSN 2250-2459, ISO 9001:2008 Certified Journal, Volume 3, Issue 4, April 2013)
732
Optimization Of Net Work Output & Efficiency Of Gas
Turbine
Prof. Arun Kumar
1and Om Prakash
21
Assistant Professor, 2 Research scholar, Department of Mechanical Engineering, National Institute of Technology Patna-800005, Bihar, India
Abstract-Now-a-day a power plant is extensively required
which has capability to offering high power output & maximum efficiency with very less installation cost for the same fuel consumption. Gas-air systems can also be used as a potential improvement to the efficiency of simple power units with gas turbines operating at locations without access to large amounts of water. Gas turbines are one of the basic technologies used to produce electricity and power working machinery. The popularity of the technology results from its advantages, the most important of which are: the fast start-up, high efficiency, low pollutant emissions, the short time needed for the installation to be constructed and a reasonable size. The combined cycle has gained wide spread acceptance in the land based power generating industry and is definitely a proven technology. But due to HRSG, the cost has been found to be too high. As a consequence of high inlet temperature, a higher flue gas temperature results, which allows for improved combined cycle or cogeneration efficiency. A combined system which has not been widely investigated is the air bottoming cycle, where air, instead of steam, is used in a bottoming cycle to recover partially the energy from the turbine exhaust & convert it into useful power. The air bottoming cycle may be employed to utilize the heat rejected from the gas turbine. The ABC together with topping Gas Turbine Cycle is another type of combined cycle. It offers efficiency close to that of combined Gas Turbine/Steam Turbine Cycle and offers the potential of low weight as compared to combined Gas Turbine/Steam Turbine Cycle. The GT-ABC systems has a wide application in the food industry (industrial bakeries, powdered milk factories and as a source of hot air in glass melting furnaces).
This paper presents the thermal analysis of optimization net work output & efficiency of gas turbine using recuperator & air bottoming cycle(ABC) with respect to different turbine inlet temperature in topping cycle & different pressure ratio in the topping & bottoming cycle. Because, the performance of gas turbine major depend upon the turbine inlet temperature (TIT) & pressure ratio. The optimal analysis has been made by energy balance equation utilizing MATLAB10 software.
Keywords – Topping cycle, Bottoming cycle, Pressure
ratio, Turbine inlet temperature, ambient temperature
NOMENCLATURE
HRSG = Heat recovery steam generator. ABC = Air bottoming cycle.
=Pressure ratio in topping cycle. =Pressure ratio in bottoming cycle.
= compressor inlet temperature or ambient temperature.
= compressor exit temperature.
= Turbine inlet temperature (TIT) in topping
cycle.
= Turbine exit temperature in topping cycle =Turbine inlet temperature in bottoming
cycle.
= Turbine exit temperature in
bottoming cycle.
= Effectiveness of recuperator. = Efficiency of turbine. = Efficiency of compressor. L.P=Low pressure.
I.P=Intermediate pressure H.P= High pressure. I.P= Intermediate pressure
=Specific heat of air.
= Specific heat ratio.
=Combustion efficiency.
I. INTRODUCTION
The gas turbine combined cycle power plant (CCPP) comprises two means such as air bottoming cycle (ABC) & recuperator which completely replace the steam turbine and heat recovery steam generator respectively (HRSG), as used in the conventional CCPP. Recuperator utilizes the heat of exhaust gases of topping cycle to heat the compressed air, delivered from compressor of ABC. The exhaust stream temperature of open cycle gas turbine is typically around 500 ºC and consequently there is considerable scope for heat recovery applications to improve cycle efficiency. Two basic heat recovery arrangements can be used to improve cycle efficiency.
1.1a Recuperator (Heat exchanger) in which the recovered heat is used in the same gas turbine cycle.
1.1b Bottoming cycles, in which the exhaust is used as a heat source for an essentially independent power cycle.
International Journal of Emerging Technology and Advanced Engineering
Website: www.ijetae.com (ISSN 2250-2459, ISO 9001:2008 Certified Journal, Volume 3, Issue 4, April 2013)
733
In the case of combined cycle (steam bottoming), the need for a high-pressure steam generator, a steam turbine and a condenser might be unfeasible on a small scale. It should be mentioned that special requirements are imposed on water quality, high-pressure equipment and operators of steam plant.An alternative air bottoming cycle (ABC) consists of a compressor, a heat exchanger and a gas turbine, Fig. 1. It operates at low and moderate pressure and uses the ambient air as a working fluid. Recent studies on gas turbine cycle with ABC reported an increase of power by 18-30% depending on the number of intercoolers, and efficiency growth of up to 10% points. [1]
1.2Combined cycle power plant (CCPP)
By the 1970s, the concept of a gas turbine combined cycle with a bottoming steam cycle, coupled through a heat recovery steam generator (HRSG) has been well established. In such a cycle, the hot exhaust gases from the gas turbine are passed through the HRSG where they produce superheated steam in a bottoming cycle to produce power output [2].
1.3 Background
El-Wakil (1984) first suggested that, within waste heat recovery technology, the terms bottoming cycle, topping cycle, and combined cycle are used. A bottoming cycle is a thermodynamic cycle which generates electricity from waste heat, as opposed to a topping cycle, in which waste heat from electricity generation is rejected to the environment (cooling water, atmosphere), or used for heating purposes in industry or for district heating purposes. In a combined cycle these cycles are combined for electricity production by connecting two heat engines in series [3].
Najjar et al (1996) concluded that ABC could achieve the thermal efficiency of about 60%, which is not possible in simple gas turbine cycles [4].
Korobitsyn (1998) analyzed the performance of duel gas turbine cycle. Analysis of the duel gas turbine cycle with various topping gas turbines were performed and implementation of ABC at the gas turbine to resulted in increase in power output of 20 to 35 % when compared to steam bottoming cycle. The distinct features of this set up were its simpler and robust design [5].
Kaikko (2001) presented the air bottoming cycle as an economical concept to increase the power generation efficiency of small and medium size gas turbines. A thermodynamic analysis has been presented for co-generative system where a fraction of compressed air in an inter-cooled ABC was taken to a Reversed Brayton Cycle to provide cold airflow [6].
Korobitsyn (2002) considered and used the cycle as a compact and simple bottoming cycle in various applications such as upgrading option for simple gas turbines in the off shore industries. The technical and economical feasibility of ABC has also been evaluated; where hot air from the air turbine is supplied to food processing industries [7].
A.K Tiwari et al (2010) presented that a combined system with air bottoming cycle can improve the net power output as well as efficiency by about 35% to 68%.[8]
1.4 approaches and methodology
The gas turbine cycle with ABC is modeled using each component governing thermodynamic and mathematical relation. To simplify the analysis of the system a number of assumptions are made. The assumptions are:
1 The isentropic efficiency of compressor and turbine are assumed to be constant and equal to 0.90 and 0.90 respectively [8].
2 Combustion efficiency is assumed to be constant and equal to 0.96[8].
3 Effectiveness coefficient of recuperator is equal to 0.90 [8].
4 Reference environment consist of a gaseous mixture at 1 atm and 298.15K, composed of 76.62% Nitrogen, 20.55% Oxygen, 0.03% Carbon dioxide and 1.88% Water [9].
5 Fuel is considered the pure methane and its temperature is 298 K [9].
6 All components of the system are operating at steady state with no pressure losses in entire cycle [9].
7 Working fluid is assumed the ideal gas with constant specific heat and analysis is made for unit mass of the working fluid in entire cycle [9].
8 Turbine inlet temperature ranges from 1200K to 1500K [8] & pressure ratio ranges from 2 to 20 [10].
9 No of intercooler = 2 in both topping and bottoming cycle & Reheater =1 in topping cycle only.
International Journal of Emerging Technology and Advanced Engineering
Website: www.ijetae.com (ISSN 2250-2459, ISO 9001:2008 Certified Journal, Volume 3, Issue 4, April 2013)
734
Hence my proposed model to analyze mathematically to improve work output and efficiency of gas turbine is shown in figure-1.
LPT HPC
IPC
LPC HPT
COMBUSTION
CHAMBER
REHEATER COOLING WATER INTERFACE
TOPPING CYCLE
O/P
O/P
LPT HPT
IPC LPC
CC
HPC
RECUPERATOR
O/P
O/P
EXHAUST GAS BYPASSCOOLING WATER INTERFACE
SAFETY VALVE
DAMPER
TO STACK TO STACK
BOTTOMING CYCLE
[image:3.595.52.528.169.616.2]International Journal of Emerging Technology and Advanced Engineering
Website: www.ijetae.com (ISSN 2250-2459, ISO 9001:2008 Certified Journal, Volume 3, Issue 4, April 2013)
735
II. ANALYSIS OF COMBINED CYCLE WITHOUT REHEAT2.1 Analysis of topping cycle
The three stage compression, minimum compressor work is obtained at the same intermediate pressure ratio, so the exit temperature of each compressor in gas turbine topping cycle will be
[ ]………..… (1)
Where,
& each compressor work in topping cycle
( )………. (2)
Now for two stages expansion in turbine the exit temperature of each turbine will be
[ ( )]………... (3)
So, net work output of H.P & L.P turbine is topping cycle is equal to
From1,2&3
( ) ( ) (
) ……….…… (4)
Net heat input in topping cycle,
( ) *( ) +……….... (5)
Hence efficiency of topping cycle
(
) ……….…. (6)
Figure [2.1.2] Variation of work output of topping cycle w. r. t
at different turbine inlet temperature (TIT).
2 4 6 8 10 12 14 16 18 20
100 150 200 250 300 350 400 450 500
Pressure ratio
W
o
rk
o
u
tp
u
t
o
f
to
p
p
in
g
c
y
c
le
i
n
K
J
/K
g
.
TIT
1200 K 1300 K 1400 K 1500 K
LPT HPC
IPC
LPC HPT
COMBUSTION
CHAMBER COOLING WATER INTERFACE
TOPPING CYCLE
O/P
O/P
[image:4.595.64.530.161.344.2] [image:4.595.319.537.369.659.2]International Journal of Emerging Technology and Advanced Engineering
Website: www.ijetae.com (ISSN 2250-2459, ISO 9001:2008 Certified Journal, Volume 3, Issue 4, April 2013)
736
Figure [2.1.3] Variation of efficiency of topping cycle w. r. t atdifferent turbine inlet temperature (TIT)
2.2 Analysis of bottoming cycle
Effectiveness of recuperator,
( )….………... (7)
The three stage compression, minimum compressor work is obtained at the same intermediate pressure ratio, so the exit temperature of each compressor bottoming cycle will be
[ ( ) ]……….. (8)
So, work output for each compressor,
( )……… (9)
Now, exit temperature for two stages turbine will be
[ ( )]………... (10)
Where,
( ) ( ) ( )
From6&7
2 4 6 8 10 12 14 16 18 20
10 15 20 25 30 35 40 45
Pressure ratio
E
ffi
c
ie
n
c
y
o
f
to
p
p
in
g
c
y
c
le
i
n
%
. 1200 KTIT
1300 K 1400 K 1500 K
LPT HPT
IPC LPC
CC
HPC
RECUPERATOR
O/P
O/P
EXHAUST GAS BYPASSCOOLING WATER INTERFACE
SAFETY VALVE
DAMPER
TO STACK TO STACK
BOTTOMING CYCLE
[image:5.595.59.264.144.308.2] [image:5.595.56.530.353.615.2]
International Journal of Emerging Technology and Advanced Engineering
Website: www.ijetae.com (ISSN 2250-2459, ISO 9001:2008 Certified Journal, Volume 3, Issue 4, April 2013)
737
( )
( ) (
)………..……….. (11)
Figure [2.2.2] Variation of work output of bottoming cycle w. r. t
& at different turbine inlet temperature (TIT)
2.3 Analysis of combined cycle
( ) ( )
( ) ………... (12)
( ) ( ) ………..…. (13)
(
) ……… (14)
Figure [2.3.1] Variation of work output of combined cycle w. r. t
& at different turbine inlet temperature (TIT).
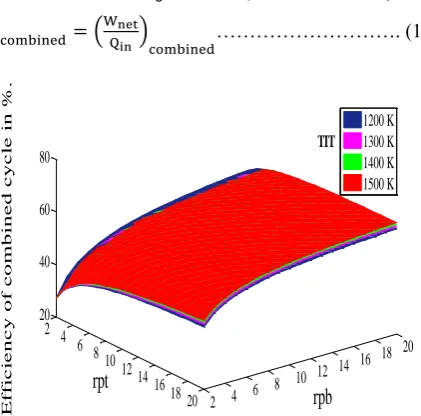
Figure [2.3.2] Variation of efficiency of combined cycle w. r. t
& at different turbine inlet temperature (TIT).
III. ANALYSIS OF COMBINED CYCLE WITH REHEAT
From figure (1)
( ) [ ( )
( )] ( )
( )……….. (15)
Figure [3.1] Variation of work output of combined cycle with reheats w. r. t & at different turbine inlet temperature
(TIT).
( ) *( ) + (
)………...… (16)
2 4 6 8 10 12 14 16 18 20 2 4 6 8 10 12 14 16 18 20 0 100 200 300 400 500 600 TIT rpb rpt W o rk o u tp u t o f b o tt o m in g c y c le i n K J /K g . 1200 K 1300 K 1400 K 1500 K 2 4 6 8 10 12 14 16 18 20 2 4 6 8 10 12 14 16 18 20 300 400 500 600 700 800 TIT rpb rpt W o rk o u tp u t o f c o m b in e d c y c le i n K J /K g . 1200 K 1300 K 1400 K 1500 K 2 4 6 8 10 12 14 16 18 20 2 4 6 8 10 12 14 16 18 20 30 40 50 60 70 TIT rpb rpt E ffi c ie n c y o f c o m b in e d c y c le i n % . 1200 K 1300 K 1400 K 1500 K
2 4 6
8 10 12
14 16 18 20
[image:6.595.327.527.155.322.2] [image:6.595.316.541.458.674.2] [image:6.595.53.270.464.720.2]International Journal of Emerging Technology and Advanced Engineering
Website: www.ijetae.com (ISSN 2250-2459, ISO 9001:2008 Certified Journal, Volume 3, Issue 4, April 2013)
738
( [image:7.595.56.267.129.337.2]) ………. (17)
Figure [3.2] Variation of efficiency of combined cycle with reheats w. r. t & at different turbine inlet temperature (TIT).
IV. RESULTS &DISCUSSION
From the above entire analysis it is clear het the value of work output & efficiency of topping, bottoming, combined cycle well effected by number of independent parameters like TIT, . The effects of these
parameters on the work output and efficiency are obtained by the energy-balance utilizing MATLAB10 software.
4.1 Topping cycle
From equations (4), (5) and (6) it is clear that the work output and efficiency of topping cycle depends on pressure ratio of topping cycle and turbine inlet temperature (TIT) . From equation (1) and (3) it is easy to predict that as the turbine inlet temperature as well as pressure ratio of topping cycle increases, turbine work increases but with more increase in pressure ratio of topping cycle compressor work also increases that will results in slight decrease in work output of topping cycle.
In this paper, pressure ratio of topping cycle vary
from 2 to 20 and turbine inlet temperature of topping cycle vary from 1200K to 1500K, on this data results
shows that on particular pressure ratio as the turbine temperature increases net work of the cycle increases as well as on the particular turbine inlet temperature as the pressure ratio increases net work of the cycle also increases. In fig.2.1.2 the network of topping cycle are plotted against turbine inlet temperature as well as pressure ratio of topping cycle simultaneously. Here it is clear that as the turbine inlet temperature increases the rate of increase of network of topping increases with increase in pressure ratio.
Figure 2.1.3 shows the variation of efficiency of topping cycle with respect to pressure ratio of topping cycle as well as turbine inlet temperature of topping cycle. It is indicated from the graphs that the efficiency of topping cycle increases with increase in pressure ratio as well as turbine inlet temperature of topping cycle and attain its maximum value (43%) at 1500K of turbine inlet temperature and at the pressure ratio of 20 of topping cycle.
4.2 Bottoming cycle
From equations (8), (9) and (10) it is clear that the network of bottoming cycle depends on pressure ratio and turbine inlet temperature of bottoming cycle. From equation (7), (8) & (9) the turbine inlet temperature of bottoming cycle depends on pressure ratio of topping cycle, turbine inlet temperature of topping cycle.
The graphs (2.2.2) shows variation of net work of bottoming cycle with respect to pressure ratio of topping cycle and pressure ratio of bottoming cycle for
different turbine inlet temperature varying from 1200K to 1500K for unit mass flow rate. It is clear from the graph that as the pressure ratio of topping cycle increases the net work of bottoming cycle decreases this is because as the pressure ratio of topping cycle increasing the exhaust temperature of topping cycle decreases which results in decrease in turbine inlet temperature of bottoming cycle. In the opposite way as the pressure ratio of bottoming cycle increases the net work of bottoming cycle increases this is because as the pressure ratio of bottoming cycle increases the turbine inlet temperature of bottoming cycle increases and exhaust temperature of bottoming cycle decreases which results in increase in net power output, further more increase in pressure ratio of bottoming will slightly decrease in net power output because of increase in compressor work. Here the maximum work output is for =2 and =20.
It is shown in graph as the turbine inlet temperature of topping cycle increases the surface of net work output shifted towards above because it increases the turbine inlet temperature of bottoming cycle and attains its maximum value when turbine inlet temperature is 1500K.
4.3 Combined cycle
Figure (2.3.1) indicates the variation of net work of combined cycle with respect to pressure ratio of topping cycle and pressure ratio of bottoming cycle for different turbine inlet temperature of topping cycle. It is clear from the graph as the pressure ratio of topping cycle increases the net work output of combined cycle increases and attains its maximum value at =8 then decreases
slightly. This position shifted towards above when increases in turbine inlet temperature.
2 4 6
8 10 12
14 16 18 20 2 4
6 8 10
1214 16
1820 20
40 60 80
TIT
rpb
rpt
E
ffi
c
ie
n
c
y
o
f
c
o
m
b
in
e
d
c
y
c
le
i
n
%
.
International Journal of Emerging Technology and Advanced Engineering
Website: www.ijetae.com (ISSN 2250-2459, ISO 9001:2008 Certified Journal, Volume 3, Issue 4, April 2013)
739
Similarly as the pressure ratio of bottoming cycle increases the net work output of combined cycle increases and attains its maximum value at =20. Thisposition shifted towards above as shown in graphs by increase in turbine inlet temperature of topping cycle. Figure (2.3.2) shows the variation of net efficiency of combined cycle w.r.t and . It is clear from graph
that as pressure ratio of topping cycle and bottoming cycle increases the net efficiency increases and attains its maximum value at =14 & =20.
4.4 Combined cycle with reheat
Figure (3.1) & (3.2) indicate the variation of net work output & efficiency of combined cycle respectively with respect to pressure ratio of topping cycle and pressure ratio of bottoming cycle for different turbine inlet temperature of topping cycle. It is clear from the graphs as the pressure ratio of topping & bottoming cycle increases the net work output & efficiency of combined cycle increases and attains its maximum value at =
= 20 at TIT=1500K.
V. CONCLUSION
On the basis of above entire analysis of gas turbine cycle following conclusion comes into picture with addition of air bottoming cycle (ABC).
a)The optimum point of this system corresponding to maximum work output is found to be =8,
=20, TIT=1500K.
b)The optimum point of this system corresponding to maximum efficiency is found to be =14, =20,
TIT=1500K.
c)The optimum point of this system corresponding to maximum work output & efficiency is found to be
=20, =20, TIT=1500K in addition of rheater
in topping cycle.
d)The work output of gas turbine is increased by 15% to 56%.
e)The efficiency of gas turbine is increased by 18% to 52%.
f) In addition of reheat in gas turbine work output is increased by 33% & efficiency is decreased by 6%.
REFERENCES
[1] O Bolland, M Forde, B. Hande Air bottoming cycle: Use of gas turbine waste heat for power generation, journal of engineering for gas turbine and power, april-1996.
[2] J. H. Horlock, “Combined Power Plants - Past, Present, and Future”, ASME J. Eng, Gas Turbines Power, 1995,117, pp.608-616.
[3] El-Wakil, M.M. (1984). Power plant Technology. McGraw-Hill, Inc.
[4] Najjar Y. S. H., Zaamout M. S. Performance Analysis of Gas Turbine Air-Bottoming Combined System. Energy Conversion and Management Vol. 37, No. 4, pp 399-403, 1996.
[5] Korobitsyn M.A., 1998. “New and Advance Energy Conversion Technologies. Analysis of Cogeneration, Combined and Integrated Cycles”, CHP 7 (107-117), 1998
[6] Kaikko J., 2001. “Air bottoming cycle for Cogeneration Power, Heat and cooling” Department of Energy Technology, Stockholm, Sweden, 2008.
[7] Korobitsyn M. Industrial applications of the air bottoming cycle. Energy Conversion and Managements 43 (2002) 1311-1322 [8] A.K.Tiwari, Mohd Islam, M.N.Khan (2010) A.K. Tiwari
Thermodynamic Analysis of Combined Cycle Power Plant et. al. / International Journal of Engineering Science and Technology. [9] M. Ghazikhani, H. Takdehghan and A. Moosavi Shayegh, Exergy
Analysis of Gas Turbine Air- Bottoming Combined Cycle for Different Environment Air Temperature.
[10] Thamir K.Ibrahim, M.M. Rahman. Effect of compression ratio on performance of combined cycle gas turbine. International journal of energy engineering 2012.
[11] T.Stevens, F.Verplaesten, M. Baelmans, Requirements for recuperator in micro gasturbine Power MEMS 2004.
[12] Adrian rimescu and Dorin Lela. Thermodynamic analysis of gas turbine powered cogeneration system Journal of science &industrial research July 210.
[13] K.P Tyagi, M.N Khan, Effect of gas turbine exhaust temperature, stack temperature and ambient temperature on overall efficiency of combine cycle power plant International journal or engineering and technology 2010.
[14] Tadeusz Chmielniaka, Daniel Czajab, A thermodynamic and economic comparative analysis of combined gas-steam and gas turbine air bottoming cycle Sebastian Lepszy proceedings of ecos 2012 - the 25th international conference on efficiency, cost, optimization, simulation and environmental impact of energy systems June 26-29, 2012, Perugia, Italy.
![Figure [1] Block diagram of gas turbine combined cycle power plant](https://thumb-us.123doks.com/thumbv2/123dok_us/8731095.886895/3.595.52.528.169.616/figure-block-diagram-turbine-combined-cycle-power-plant.webp)
![Figure [2.1.1] Block diagram of topping cycle without reheat](https://thumb-us.123doks.com/thumbv2/123dok_us/8731095.886895/4.595.64.530.161.344/figure-block-diagram-topping-cycle-reheat.webp)
![Figure [2.1.3] Variation of efficiency of topping cycle w. r. t at different turbine inlet temperature (TIT)](https://thumb-us.123doks.com/thumbv2/123dok_us/8731095.886895/5.595.56.530.353.615/figure-variation-efficiency-topping-cycle-different-turbine-temperature.webp)
![Figure [2.3.1] Variation of work output of combined cycle w. r. t & at different turbine inlet temperature (TIT)](https://thumb-us.123doks.com/thumbv2/123dok_us/8731095.886895/6.595.53.270.464.720/figure-variation-output-combined-cycle-different-turbine-temperature.webp)