Journal of Chemical and Pharmaceutical Research, 2014, 6(11):326-333
Research Article
ISSN : 0975-7384
CODEN(USA) : JCPRC5
Development and validation of RP-HPLC-PDA method for the
analysis of Citalopram hydrobromide in bulk, dosage forms and in
in vitro dissolution samples
CH. Ajay Kumar, A. Prabhakar Reddy, G. Lakshmi Suneetha, M. Sai Sree, M. Vijaya
Lakshmi and Buchi N. Nalluri*
Department of Pharmaceutics, KVSR Siddhartha College of Pharmaceutical Sciences, Vijayawada, AP, India
_____________________________________________________________________________________________
ABSTRACT
The objective of the current work is to develop a simple, efficient, economical and LC-MS compatible RP-HPLC-PDA method for the analysis of Citalopram Hydrobromide in bulk, dosage forms and in dissolution samples. Samples were separated on Agilent Eclipse C18 column (150 x 4.6mm, 5µm) with mobile phase composed of 10mM Ammonium acetate: methanol (35:65 v/v) in isocratic mode. The detection wavelength was fixed at 239nm. The retention time of Citalopram Hydrobromide was 3.1min and the method showed a good linearity in the concentration range of 5-25µg/mL with a correlation coefficient of 0.997. The method was validated for specificity, linearity, limit of detection, limit of quantification, precision, robustness and stability. All the validation parameters were within the compendial requirements. The proposed method was successfully adopted for the analysis of Citalopram Hydrobromide in bulk, pharmaceutical dosage forms and in dissolution samples.
Keywords: Citalopram Hydrobromide, Agilent Eclipse C18 column, Dissolution Studies, PDA Detection, Method
Validation.
_____________________________________________________________________________________________
INTRODUCTION
Citalopram Hydrobromide (CTL) is an antidepressant drug of the selective serotonin reuptake inhibitor (SSRI) class. Chemically, it is (RS)-1-[3-(dimethyl amino) propyl]-1-(4-fluorophenyl)-1,3-dihydroisobenzofuran-5-carbonitrile [1] and used in the treatment of major depression. CTL blocks the reuptake of serotonin at the serotonin reuptake pump of the neuronal membrane, enhancing the actions of serotonin on 5HT1A auto receptors [2].
EXPERIMENTAL SECTION
Chemicals
CTL was a gift sample from Aurobindo Pharma Ltd, Hyderabad. Ammonium acetate, water and methanol were purchased from E. Merck, Mumbai, India. All the solvents and reagents were of HPLC grade. CTL is available as tablets with brand name CITOPAMTM (manufactured by Sun Pharma India Limited, Sikkim) with a labeled claim of 20mg.
Equipment
A Shimadzu Prominence HPLC system equipped with DGU-20A3 degasser, LC-20AD binary pumps, SIL-20AHT auto sampler, and SPD-M20A PDA detector was used. Data acquisition was carried out using LC solutions software. The chromatographic analysis was performed on Agilent Eclipse C18- RP aqueous column (150 x 4.6mm,
5µm).
Chromatographic Conditions
Mobile phase consisting of 10mM ammonium acetate: methanol (35:65 v/v) was used in isocratic mode and the mobile phase was filtered through Nylon disc filter of 0.45µm (Millipore) and sonicated for 3 min before use. The flow rate was 1 mL/min and the injection volume was 10µL. PDA detection was performed at 239nm and the separation was achieved at ambient temperature.
Preparation of stock and standard solutions
The stock solution of strength 1 mg/mL was prepared by dissolving 12.5 mg of Citalopram Hydrobromide, which is equivalent to 10 mg of Citalopram in 5 mL of methanol and finally volume was adjusted to the mark withmethanol in a 10mL volumetric flask. An appropriate volume of this stock solution was then further diluted with 10mM ammonium acetate to get the required concentrations of standard solutions within a concentration range of 5-25µg/mL.
Validation of the HPLC method
The proposed method was validated as per ICH guidelines [16] for the following parameters:
Linearity
A linear relationship was evaluated across the range of the analytical procedure with a minimum of five concentrations. A series of standard dilutions of CTL were prepared over a concentration range of 5-25µg/mL (5, 10, 15, 20, 25µg/mL) from stock solution and injected in triplicate. Linearity was evaluated by plotting peak areas as a function of analyte concentration, and the test results were evaluated by appropriate statistical methods where slope, intercept, regression coefficient (R2) and correlation coefficient (R) were calculated and the data was given in Table-1.
Precision
Precision of the method is expressed in terms of the closeness of the data values to each other for a number of measurements under the same analytical conditions. Repeatability was assessed by using a minimum of six determinations at 100% of the test concentration. The standard deviation and the relative standard deviation were reported for precision. Less than 2% RSD for peak areas indicate the precision of the developed method and the data was presented in Table-1.
Specificity
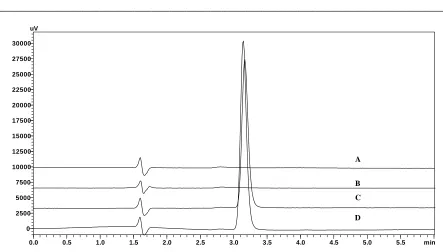
The specificity of the method was determined by comparing the chromatograms obtained from the drug substance with that of the formulation. The overlay of diluent, placebo, standard and sample were represented in Figure-2. Chromatograms of drug substance and drug product were observed. Absence of interference of excipients in the tablet with the retention time of the drug indicates the specificity of the proposed method.
Accuracy
______________________________________________________________________________
these solutions were analyzed by developed method in triplicate. The % recovery and the RSD were calculated at each level of addition and the data was given in Table-1.
Limit of Detection (LOD) and Limit of Quantification (LOQ)
LOD and LOQ were calculated based on calibration curves. They were expressed as LOD = (3.3 ×σ)/m; LOQ= (10.0×σ)/m (Where, σ is the standard deviation of the y-intercepts of the three regression lines and m is mean of the slopes of the three calibration curves).
Robustness
To determine the robustness of the method developed, the experimental conditions were intentionally altered and the chromatographic parameters viz. retention time, tailing factor, no. of theoretical plates, and percent assay were recorded. The flow rate of the mobile phase was 1mL/min. To study the effect of change in mobile phase (±2% v/v), effect of change in flow rate 10% and the effect of wavelength was studied by changing wavelength by ±2nm and the data was given in Table-2.
System suitability
System suitability was carried out by injecting a standard concentration at different injection volumes in the range of 5-25μL. The system suitability test parameters were noted and RSD was calculated.
Assay
Twenty tablets were weighed and finely powdered, the powder equivalent to 10mg of CTL was accurately weighed and transferred into a 10mL volumetric flask and dissolved in methanol and sonicated for 5min and volume was adjusted up to the mark with methanol. The above solution was centrifuged and then filtered using nylon disposable syringe filter (13 mm, 0.45µm). An aliquot of filtrate was diluted with water and analyzed in triplicate. The amount present in the each tablet was quantified by comparing the area of standard CTL with that of the sample.
Filter compatibility study
Filter compatibility study was carried out using nylon disc filter (0.45µm) and PVDF (0.45µm) filter. Sample solution was prepared and the solution was filtered through 0.45µm nylon filter and PVDF (0.45µm) filter. Filtered samples were injected and chromatograms were observed.
Dissolution Analysis
Dissolution of CTL tablets was performed using USP type-2 (paddle) dissolution test apparatus. Tablets were dropped in to the dissolution vessel containing 900mL of 0.1N HCl as dissolution medium. The temperature of the medium at 37 ± 0.5ºC and 50 rpm was maintained. Samples were withdrawn at predetermined time intervals. Samples were filtered (0.45µm Nylon disc filter) and were suitably diluted with methanol and subjected to HPLC analysis.
RESULTS AND DISCUSSION
Method Development
Initial trials were carried with 10mM ammonium acetate and methanol (65:35 v/v) as mobile phase at a flow rate of 1 mL/min with Phenomenex C18 column (150 x 4.6 mm, 5µm) and the CTL was eluted at 3.97 min with a tailing
factor >2. Same mobile phase composition was used with Inertsil column (250 x 4.6 mm,5µ) and the CTL was eluted at 8 min with tailing factor > 2.
Finally, the Agilent Eclipse plus C18 column (150 x 4.6 mm, 5µm) was used, with a mobile phase of 10mM
0.0 0.5 1.0 1.5 2.0 2.5 3.0 3.5 4.0 4.5 5.0 5.5 m in -2.5 0.0 2.5 5.0 7.5 10.0 12.5 15.0 17.5 20.0 22.5 25.0 m AU
239n m,4n m (1.00)
3
.0
9
4
2.95 3.00 3.05 3.10 3.15 3.20 3.25 3.30 3.35 min
0.000 0.025 0.050 0.075 0.100 0.125 0.150 0.175 0.0 2.5 5.0 7.5 10.0 12.5 15.0 17.5 20.0 22.5 25.0 27.5 30.0 32.5 35.0 37.5 40.0 mAU Peak Zero Line Purity Curve
[image:4.595.78.516.91.451.2]200.0 225.0 250.0 275.0 300.0 325.0 350.0 375.0 nm -5 0 5 10 15 20 25 30 35 40 45 50 55 60 65 70 m AU 3.14/ 1.00 2 0 3 2 3 9 2 8 4 3 8 1
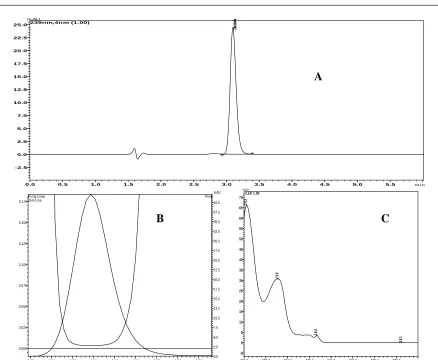
Figure 1: A - Chromatogram of CTL (10 µg/mL) B - Peak purity index of CTL and C - UV spectrum of CTL
Method validation
Linearity
The range of reliable quantification was estimated in the concentrations between 5-25µg/mL of CTL. This range was selected based on 80-120% of the standard concentration used for accuracy and were analyzed in triplicate. Peak areas and concentrations were subjected to least square regression analysis to calculate regression equation. The correlation coefficient (R) was found to be 0.997 indicating a linear response over the range used. The data from the calibration curve was given in Table-1.
Precision
Precision studies were carried out in terms of repeatability. Repeatability of standard application was assessed by using six replicates of concentration at 10µg/mL level and the data was given in Table-1. The % RSD was found to be below 2 for peak areas, this shows the closeness of the data values to each other, indicating the precision of the method.
Specificity
The specificity of the method was established by injecting the solutions of diluent, placebo, standard, sample (Formulation) individually to examine any interference, from the overlay of chromatograms as shown in (Figure-2) and the 3D plots of placebo and formulation, it can be inferred that there were no co-eluting peaks at the retention time of CTL, this shows that peak of analyte was pure and the excipients in the formulation did not interfere with the analysis and the peak purity indices for sample and standard was found to be greater than 0.9999 and this confirms specificity of the method.
A
______________________________________________________________________________
0.0 0.5 1.0 1.5 2.0 2.5 3.0 3.5 4.0 4.5 5.0 5.5 min
0 2500 5000 7500 10000 12500 15000 17500 20000 22500 25000 27500 30000 uV
Figure 2: Overlay of the Diluent (A), Placebo (B), Standard (C) and Sample (D) chromatograms
Accuracy
[image:5.595.76.519.85.337.2]Accuracy of the proposed method was ascertained by performing recovery studies by standard addition method by spiking the known quantities of standard at 80, 100, 120% levels to the drug product solution of 10μg/mL and these solutions were analyzed in triplicate in each level of addition. The RSD and the %Recovery were within the acceptable limit in all cases. It is evident from the results of accuracy study given in Table-1, that the proposed method enables very accurate quantitative estimation of CTL.
Table 1: Linearity, Precision and Accuracy data of CTL
Validation data of CTL
Linearity(n=3)
Parameters CTL
Range
Regression equation Regression coefficient (R2)
Correlation coefficient (R)
5-25µg/mL Y = 18699x -24844 0.997
0.999
Accuracy(n=3) Percent level of addition Mean Recovery(RSD) 80
100 120
101.50(0.32) 99.6(0.26) 101.97(0.03)
Precision(n=6) CTL
System Precision Method Precision
Average Peak area of the standard sample(RSD) 182476(0.43) Average peak area of the Assay sample(RSD) 202495(0.16) Percent assay (n=3) Mean ± SD 100.59 (0.49)
Limit of Detection (LOD) and Limit of Quantification (LOQ)
LOD and LOQ were determined based on statistical calculation from the calibration curves, where LOD = (3.3 ×σ)/m; LOQ= (10.0×σ)/m (σ is the standard deviation of the y-intercepts of the three regression lines and m is mean of the slopes of the three calibration curves).The limit of detection for CTL was found to be 0.0659µg/mL, the drug peak could be detected without any base line disturbances at this concentration. The limit of quantification for CTL was found to be 0.1998 µg/mL.
Robustness
As part of the robustness, a deliberate change in the mobile phase, flow rate and wavelength was made to evaluate the impact on the method. Retention times were significantly changed with flow rate, mobile phase and no change in the retention time was observed in wavelength change. Percent assay values were also estimated under these changed conditions and the results were given in Table-2. The parameters like theoretical plate number and percent assay
were not changed and were within the limits. These results indicated that the method is robust in terms of changed flow rate, mobile phase and wavelength.
[image:6.595.112.485.155.328.2]Table 2: Robustness data
Change in Mobile phase composition
Drug Composition of mobile phase Retention time
(min) Theoretical plates (N) Tailing factor Percent assay
CTL 33:67 3.36 4476 1.24 99.42
35:65 3.16 4272 1.25 99.83
37:63 2.86 3978 1.25 98.42
Change in Wavelength (nm)
Drug Wave length (nm) Retention time
(min) Theoretical plates (N) Tailing factor % Assay
CTL 237 3.16 4288 1.24 99.24
239 3.16 4272 1.25 99.51
241 3.16 4286 1.25 98.82
Change in Flow rate (mL/min)
Drug Flow rate (mL/min) Retention time (min) Theoretical plates (N) Tailing factor % Assay
CTL 0.9 3.40 4502 1.26 99.51
1.0 3.16 4272 1.27 100.8
1.1 2.78 3991 1.26 100.3
System suitability
System suitability is an integral part of the validation of analytical procedure. System suitability studies were carried out by injecting five times a 10µg/mL standard concentration of CTL at different injection volumes ranging from 5µL to 25µL. The RSD values for system suitability test parameters like retention time [Rt = 3.14 (0.66)], tailing
factor [Tf = 1.25 (1.40)] and theoretical plate number [4358 (1.82)] were less than 2% indicating the present
conditions were suitable for the analysis of CTL.
Assay
Assay of CTL tablets was performed by the proposed method and the % assay of the formulation was calculated as an average of 3 determinations, which was about 100.59 ± 0.5. These results indicate that the present HPLC method can be successfully used for the assay of CTL in bulk and dosage forms.
Stability of the stock solution
The stability of the stock solution was determined by analyzing the samples under refrigeration (8±1oC) at different time intervals up to 48hrs. The % variation in assay values at different time intervals were found to be less than 2 of the initial zero time interval solution, thus indicating that the solutions were stable for a period of 48hrs when stored at 8°C.
Filter compatibility study
Compatibility of 0.45µm nylon filter and 0.45µm PVDF filter was studied. Standard sample solution and dissolution samples were filtered and analysed and the variation in the assay value was calculated. After the analysis it was found that nylon filters are suitable for filtration.
Dissolution analysis of marketed product
______________________________________________________________________________
Fig. 3: In vitro dissolution profile of marketed CTL tablets
CONCLUSION
In this work, a simple and efficient RP-HPLC-PDA method was developed for the analysis of CTL in bulk, dosage forms and in dissolution samples. The method was validated as per International Conference on Harmonisation (ICH) guidelines, and found to be applicable for routine quality control analysis for the estimation of CTL in tablets and in dissolution samples using isocratic binary mode of elution. The results of linearity, precision, accuracy and specificity, proved to be within the limits. The method provides selective quantification of CTL without interference from diluents and placebo. By this method it is possible to determine CTL in dissolution samples without any additional pre-treatment.
Acknowledgements
The authors are thankful to Aurobindo Pharma Ltd. for providing gift sample and also to the Siddhartha Academy of General and Technical Education, Vijayawada for providing the necessary facilities to carry out this research work.
REFERENCES
[1]Indian Pharmacopoeia, 6th Edition, The Indian Pharmacopoeia Commission, Ghaziabad, 2010; 1097.
[2]HP Rang; MM Dale; JM Ritter; RJ Flower; G Henderson. Rang and Dale’s Pharmacology, 7th Edition, Elsevier Churchill Livingstone, Elsevier Inc., Spain, 2012; 681.
[3]SC Sweetman. Martindale-The Complete Drug Reference. 33rd Edition. Pharmaceutical press, The Royal Pharmaceutical Society, London, 2005; 757.
[4]JON Maryadele. The Merck Index. 13th Edition, Merck Research Lab publishers, White House Station, NJ, USA, 2001; 1634.
[5]U Zuhal; H Sinan Suzen. Pharm. Sci., 2009, 34, 195-201.
[6]Bjorn Carlsson; Bjorn Norlander. J. Chromatogr. B., 1997, 702, 234–239.
[7]K Bala Ram Kumar; K Krishna Chaitanya; D Samson Israel; SP Preethi Priyadharshni. J. of Global Trends in
Pharm. Sci., 2012, 3(1), 513-519.
[8]VK Gupta; Imran Ali; Shilpi Agarwal. Int. J. Electrochem. Sci., 2011, 6, 5639-5648.
[9]P Lily; P Ivanka; P Guenka; Alexander. Int. J. of Pharm. Sci. Rev. and Res., 2013, 19(2), 7-11.
[10]C Saravanan; M Thamizhmozhi; CA Suresh Kumar; C Sudhakar; B Rajesh; G Senthil Kumar. J Adv Scient
Res., 2012, 3(1), 62-64.
[11]S Robert; M Genowefa. Journal of Liquid Chromatography & Related Technologies, 2005, 28(2), 313-324.
[14]PS Suresh; S Giri; R Husain; R Mullangi. Biomed Chromatogr., 2010, 24(10), 1052-1058.
[15]Dilip Kumar; V Mahesh; NM Gurupadayya; BM Ravi.J. Pharm. Res., 2011, 4(1), 50.