Analysis of Maintenance Systems in Jet Dyeing Machine
Components Using the Age Replacement Method
Yani Iriani
*, Harry Bachtiar
Department of Industrial Engineering, Faculty of Engineering, Widyatama University, Bandung, Indonesia
Copyright©2019 by authors, all rights reserved. Authors agree that this article remains permanently open access under the terms of the Creative Commons Attribution License 4.0 International License
Abstract
Purpose: The purpose of this study was to determine the maintenance intervals of critical components of jet dyeing machines in an effort to minimize downtime and calculate maintenance costs for engine damage to the jet dyeing. Design/ methodology/ approach: In this study an optimization method was developed to determine the replacement interval of a critical component, namely the Age Replacement Method. Findings: Based on the results of the calculation interval obtained preventive care critical components of jet engines during dyeing 1549 hours. It means that the component must be replaced before operation for 1549 hours or there is 6 times the turnover of prevention under taken in the interval of one year and the resulting decrease in the total cost of 82%. Research limitations/ implications: A review conducted in this paper against one component only, and then it can be developed for this type of component production machines.Practical implications: If the company is implementing a policy of replacement of critical components of the engine on the jet dyeing machine with a method of age replacement, then it will occur treatment cost savings amounting to Rp. 6,752,886 lower when compared with the initial conditions the company previously Rp 37,441,132.
Originality/ value: This study combines the Pareto Diagram method and the Age Replacement Method to obtain optimum maintenance scheduling.
Keywords
The Maintenance Intervals, Age Replacement Method1. Introduction
PT X is a company engaged in the production of textiles in which the results of production to meet the needs of local and export orders. Jet dyeing machine is one of the main engines in textile production, because a very important function, namely to processes of relax and dye. All types of fabrics in processes (Woven or Knitting) definitely pass jet
engines dyeing. Based on the process of making cloth in the processing Division PT X has quite a lot of machines that are used in the production process. Problem while many production process hampered by the frequent stop of the engine because the jet dyeing machine damage. The outcome accumulation from the production of data retrieved from this machine downtime of 2145 minutes or 35.75 hours in the past two years. The incident is certainly much causing problems include increasing the waiting time of the process, the delivery time of goods that hampered production defects, and of course the increasing production costs. Damage to the dyeing jet engines which were part of the circulation pump faulty due to defective bearings, the replacement of that component is often done. The maintenance technique used for the analysis of this case study is simple and is based on the statistical calculation of total down time and mean time to repair. Based on these studies an expert system is developed. Financial impact of these studies are also taken into consideration
2. Literature Review
2.1. Maintenance
EU, 2008), no single support technique and system can adequately give required solutions for both natural and artificial defects on structures. (Abdul Lateef, Khamidi, & Idrus, 2011) assert that there is need for shift from maintenance management principles to value-based initiatives
2.2. Bathtub Curve
[image:2.595.60.289.304.405.2]The archetype of the instantaneous rate of damage that is common for a product is described through a curve known as the bathtub curve. The rate of the damage system shaped bathtub curve suffered the damage rate is always changing in accordance with increasing time. According to (Ebeling.C.E, 1997), the curve has three areas with particular characteristics. Characteristics of failure or damage to the products, machines or facilities in connection with time, can be described as in Fig. 1 below.
Figure 1. Graph of the rate of failure rate with respect to time
2.3. Age Replacement Model
Age Replacement Model that is the time interval of
replacement components having regard to the age of the component usage, so as to avoid the occurrence of replacement equipment that was new was installed will be replaced in a relatively short time. In case of a damage of the components in this model, the replacement schedule will adjust back after replacement of components is done, either due to the occurrence of the damage or only as preventive care.
This model fits applied against a component of the time interval the substitution did not affect the relative age of the other components or substitution of components at once means that the model is valid if there is damage to the component in a set of machines then only one of the damaged components are Mengalami replacement.
In the Age Replacement model, the point at the time of replacement is done depending on the age of the Komponen, so replacement of prevention will be done by setting back the next replacement time interval corresponds to the interval that has specified.
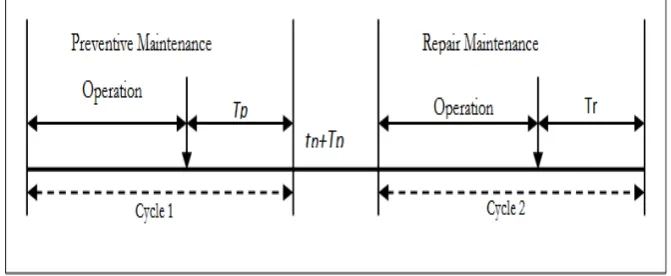
Age Replacement Model is the replacement cycle of prevention (Jardine, Andrew., 2013), i.e.:
a. the cycle 1 or cycle which ends with prevention activities prevention replacement, specified by components that have reached the replacement age according to plan.
b. cycle 2 or cycle of damage that ends with the activities of the damages, determined by the components that have been damaged before reaching the time of reimbursement that have been set previously. The second cycle of the Age Replacement model that can be seen clearly in the following fig. 1.:
[image:2.595.130.466.486.624.2]The Age Replacement method has been applied to several studies conducted by (Rusin & Wojaczek, 2012), (Abdul Lateef et al., 2011), (Ibendahl, Farrell, Spurlock, & Tack, 2014), (Eti et al., 2006), (Nwaeke, Harcourt, Benaiah, & Harcourt, 2017), (Gage, 2013), (Liao & Yuan, 1998), (Dekker, 1996), (Enofe, 2009) and (Leonard, 2014). The difference between this study and previous research is combining your Age Replacement Method and Pareto Diagram. Pareto analysis is used to determine critical components based on the greatest amount of damage that has occurred
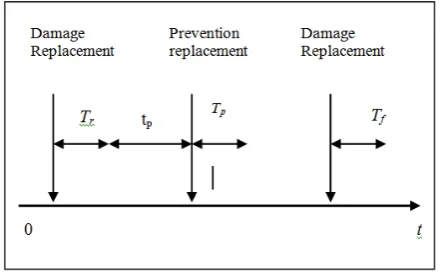
The maintenance policy follows which are described as follows:
Figure 3. Prevention Replacement Maintenance Policy
In this model preventive replacement is carried out depending on the life of the component. The purpose of this model is to determine the optimal age where preventive replacement must be carried out so as to minimize total downtime. (Jardine, 1973). Replacement prevention is done by re-establishing the next preventive replacement time interval in accordance with a predetermined interval if there is damage that requires replacement action
Because the review carried out in this paper is only for one component, the calculation for preventive replacement uses model age replacement. The formulation for model age replacement is as follows (Jardine, 1973): In this model preventive replacement is carried out depending on the service life of the component. The purpose of this model is to determine the optimal age where preventive replacement must be done so that it can minimize total downtime. (Jardine, 1973).
{
}
{
( )}{
1 ( )}
) ( ) (
) ( 1 ) ( )
(
p f p p p
p p
t R T t M t R Tp t
t R Cf tp CpR t
C
− + + +
− +
= (1)
Where :
C (tp) is the total cost
Tp is a preventive replacement time interval.
Tp is the time needed to take preventative replacement.
Tf is the time needed to make damage replacement.
CP is the cost of preventive care.
Cf is the cost of damage replacement.
R (tp) is the probability of a preventive change occurring
when tp.
M (tp) is the average time of occurrence of damage if
preventive replacement is carried out at tp
3. Method
[image:3.595.64.285.242.380.2]Evaluation system for the maintenance of the old
Identify the time between damage and determination of a
Replacement Schedule
Analysis Of The Problem
Proposed Improvement of Maintenance of Critical
Components of Dyeing Machines
Determination Of The Replacement Schedule Determination of the Total cost of
replacement Time
Analysis and interpretation
[image:4.595.127.467.78.407.2]Conclusions and Suggestions
Figure 4. Research methodology
4. Findings
4.1. Downtime Jet Dyeing Data
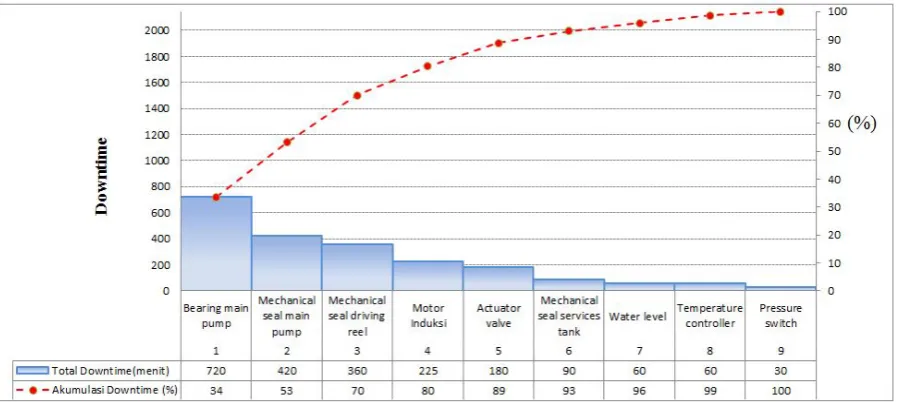
The observations were made on machines that experienced the greatest total damage downtime, namely the Jet Dyeing engine Determining the critical components of the Jet Dyeing engine as seen in Fig. 5:
[image:4.595.75.526.528.729.2]Based on the Pareto diagram above it can be seen that 80% of downtime in jet dyeing engines is caused by the five main components of the engine which often experience damage and make high downtime. These components are bearing main pump with type 7310, mechanical seal diameter 45, mechanical seal diameter 20, actuator valve and induction motor 30 KW.
4.2. Distribution of Fit Test (Mann’s Test)
In accordance with the limitation of the problem in this study, it is assumed that the data has been Weibull distributed and to prove the bearing 7310 hypothesis with the distribution of Weibull is correct, it is necessary to test the Mann's test for Weibull distribution.
Here is an example of calculating Mann’s test for bearing 7310. H0 states that bearing 7310 with Weibull and H1 distributions states that bearing 7310 does not have a Weibull distribution, if Scount <Stable then H0 is accepted.
The Mann test is carried out as follows: Trust level (α): 95%
r: 6
r – 1 : 6 – 1 = 5 (r/2)+1: (6/2) + 1 =4
Table 1. Mann’s Bearing Test 7310
i Ti xi = ln ti Mi xi+1-xi (xi+1-xi)/Mi
1 1.680 7,426549072 1,093929 0,182322 0,166666719 2 2.016 7,608870629 0,61233 0,011834 0,019326928 3 2.040 7,620705087 0,47433 0,057158 0,120503476 4 2.160 7,677863501 0,44292 0,03279 0,074031028 5 2.232 7,710653324 0,522758 0,082521 0,157857027 6 2.424 7,793174347
∑ 12.552 45,83781596 3,146267 0,366625 0,538385177
Example of calculation for i = 1
Mi is obtained from the S statistics table for goodness of
fit Weibull distribution xi =ln (1680) = 7,426549072
xi+1 - xi=x2 – x1
=7,608870629–7,.426549072 =0,182322
(xi+1-xi)/Mi=0.1823221,093929= 0,166666719
Scount=
∑𝑟−1 �𝑥(𝑖+1)−𝑥𝑖𝑀𝑖 �
𝑖=�𝑟2�+1
∑𝑟−1𝑖=1�𝑥(𝑖+1)−𝑥𝑖𝑀𝑖 � =
∑5𝑖=4�𝑥(𝑖+1)−𝑥𝑖𝑀𝑖 �
∑5𝑖=1�𝑥(𝑖+1)−𝑥𝑖𝑀𝑖 �
Stable = 0,71
From the above calculation it can be seen that Scount
<Stable, meaning that H0 is accepted, bearing 7310 has a
[image:5.595.307.536.99.295.2]Weibull distribution
Table 2. Result Mann’s Test
Component Scount Stable
Bearing 7310 0,4307 0,71
4.3. Determination of Parameter Value (α and β)
[image:5.595.84.511.502.620.2]The parameters of the Weibull distribution consist of α and β, so the two parameters must be searched first to determine the time of change of bearing.
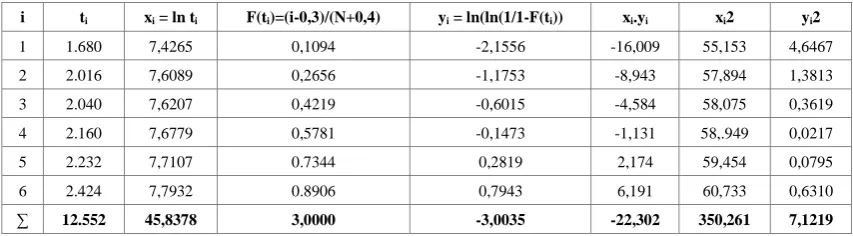
Table 3. Calculation of Bearing Parameters
i ti xi = ln ti F(ti)=(i-0,3)/(N+0,4) yi = ln(ln(1/1-F(ti)) xi.yi xi2 yi2
1 1.680 7,4265 0,1094 -2,1556 -16,009 55,153 4,6467
2 2.016 7,6089 0,2656 -1,1753 -8,943 57,894 1,3813
3 2.040 7,6207 0,4219 -0,6015 -4,584 58,075 0,3619
4 2.160 7,6779 0,5781 -0,1473 -1,131 58,.949 0,0217
5 2.232 7,7107 0.7344 0,2819 2,174 59,454 0,0795
6 2.424 7,7932 0.8906 0,7943 6,191 60,733 0,6310
Detail calculation :
b =𝑛 ∑𝑛𝑖=1𝑥𝑖𝑦𝑖−�∑𝑛𝑖=1𝑥𝑖��∑𝑛𝑖=1𝑦𝑖�
�𝑛 ∑𝑛𝑖=1𝑥𝑖2−�∑𝑛𝑖=1𝑥𝑖�2�
=6(−22,3021) − (45,8378)(−3,0035)[6(350,2610) − (45,8378)2]
= 8,38 a = 𝑦 − 𝑏𝑥
a =−3,0035
6 − (8.38) �
45.8378
6 �
= -64,494 β = b = 8,38 α =𝑒−𝑎𝑏= 𝑒−−64.494(8.38)
= 2.207,014
The calculation results obtained the parameter values α and β as shown in the table below:
Table 4. Recapitulation of Parameter Calculation Results
Component α β
Bearing 7310 2.207,01 8,38
4.4. Calculation of Substitution with the Age Replacement Method
Calculation of component replacement with the age replacement method in accordance with the equation (1)
Calculation of time intervals for preventive replacements on components is done by selecting a preventive replacement time interval that provides the smallest cost. The amount of this fee depends on the time needed to carry out preventive maintenance and repair maintenance, the number of workers directly involved such
[image:6.595.55.257.87.271.2]as technicians and machine operators who are unemployed due to maintenance actions, component costs, bearing costs 7310 C3 here set-up costs up is entered to see the total cost of bearing replacement 7310 C3
Table 5. Calculation Results for Age Replacement
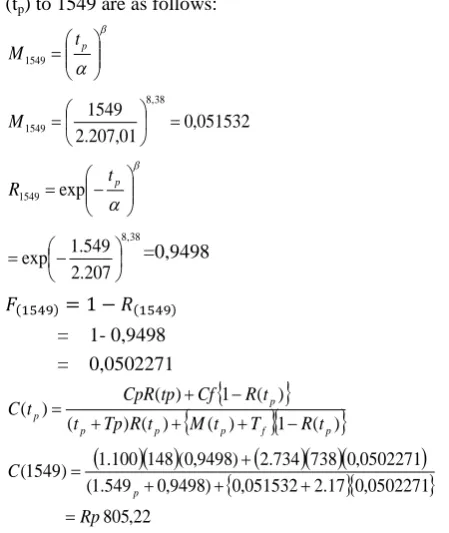
Example calculations for the replacement time interval (tp) to 1549 are as follows:
β
α
= tp
M1549 051532 , 0 01 , 207 . 2
1549 8,38
1549 =
= M β
α
−
= tp
R1549 exp 38 , 8 207 . 2 549 . 1 exp − = =0,9498
𝐹(1549)= 1 − 𝑅(1549)
= 1- 0,9498 = 0,0502271
{
}
{
( )}{
1 ( )}
) ( ) ( ) ( 1 ) ( ) ( p f p p p p p t R T t M t R Tp t t R Cf tp CpR t C − + + + − + =
(
)( )
(
)( )(
)
{
}{
}
22 , 805 0502271 , 0 17 . 2 051532 , 0 ) 9498 , 0 549 . 1 ( 0502271 , 0 738 734 . 2 ) 9498 , 0 ( 148 100 . 1 ) 1549 ( Rp C p = + + + + =Age Replacement charts for bearing 7310 as shown in the picture below:
[image:6.595.301.526.215.482.2] [image:6.595.133.464.525.710.2]Based on the results of the calculations that have been made, the scheduling of replacement of bearing components is obtained using the age replacement method that changes the time interval for 1549 hours. This means that the component must be replaced before operating for 1549 hours or 65 days or there are 6 preventive changes made at intervals in one year.
If the component replacement is done earlier than the waiting time (tp) that has been determined above, it will require greater costs because the use of components will be more and the engine stops more often but the R (tp) value is higher approaching the value of one meaning reliability or reliability from better components. Conversely, if the component replacement is done longer or is extended from the specified replacement time, then the value of R (tp) is smaller than zero, meaning the reliability of the component is worse
4.5. Maintenance Cost Calculation
The calculation of proposed maintenance costs includes the planned replacement cost (preventive replacement cost) which is based on the replacement time interval previously obtained. The calculation of the amount of the planned replacement cost (preventive replacement cost) is:
Preventive Replacement Cost = Labor Cost + Component Cost.
Based on the calculation results obtained that the time interval for replacing bearing components is by using the age replacement method is 1549 minutes or 65 days
a. Preventive Replacement Cost for one time replacement:
= (2.17 hours x 2 people x Rp. 14,074) + Rp. 1,072,000
= Rp. 1,125,481, -b. Amount of replacement
= 12 months x 1 year x 30 days = 360 days = 360 days / 65 days = 6 times
c. Proposed maintenance fees = 6 x Rp. 1,125,481, = Rp. 6,752,886,
-4.6. Discussion and Conclusions
The conclusions that can be drawn from the results of calculations that have been done are as follows (Jabarullah et al., 2017):
1. The calculation results of the preventive replacement time interval using the model age replacement has a time of 65 days, shorter than the average damage time interval of 102 days, resulting in lower prevention replacement costs compared to the cost of damage replacement.
2. The cost of maintenance savings obtained if the company implements the policy of replacing
critical bearing components 7310 with the age replacement method is Rp. 30,688,246 or 82 percent lower than the previous bearing replacement system.
REFERENCES
[1] Abdul Lateef, O. A., Khamidi, M. F., & Idrus, A. (2011). Appraisal of the building maintenance management practices of Malaysian universities. Journal of Building Appraisal, 6(3–4), 261–275.
https://doi.org/10.1057/jba.2011.3
[2] Albert H.C. Tsang, (1995). (1995). Condition-Based Maintenance: Tools and Decision Making. Journal of Quality in Maintenance Engineering,1, 3–17.
[3] Campbell and Jardine. (2001). Maintenance Excellence: Optimizing Equipment Life-Cycle Decisions, New York: Maxwell Dekker.
[4] Chika EU. (2008). Professional Practice for Real Estate. Lagos. TREEM Nigeria Limited.
[5] Dekker, R. (1996). Applications of maintenance optimization models: a review and analysis. Reliability Engineering & System Safety, 51(3), 229–240. https://doi.org/http://dx.doi.org/10.1016/0951-8320(95)000 76-3
[6] Ebeling.C.E. (1997). An Introduction to Reliability and Maintainability Engineering. McGraw Hill.
[7] Enofe, O. M. (2009). Improving Maintenance Perception in Developing Countries - A Case Study, 1–55.
[8] Eti, M. C., Ogaji, S. O. T., & Probert, S. D. (2006). Development and implementation of
preventive-maintenance practices in Nigerian industries.
Applied Energy, 83(10), 1163–1179.
https://doi.org/10.1016/j.apenergy.2006.01.001
[9] Gage, M. W. (2013). Equipment Maintenance and Replacement Decision Making Processes. http://digitalcommons.calpoly.edu/cgi/viewcontent.cgi?arti cle=1124&context=imesp
[10] Ibendahl, G., Farrell, M., Spurlock, S., & Tack, J. (2014). Optimal replacement age of a conventional cotton harvester system. Agricultural Finance Review, 74(1), 2–16. https://doi.org/10.1108/AFR-02-2013-0008
[11] Jardine, Andrew., K. . (2013). Maintenance Replacement, and Reliability, Theory and Application. Retrieved from Taylor and Francis Group
[12] Jabarullah, N. H., Mauldin, C., Navarro, L. A., Golden, J., Madianos, L., & Kemp, N. T. (2017). Modelling and Simulation Analysis for the Prediction of the Performance of Intrinsic Conducting Polymer Current Limiting Device.
Advanced Science Letters, 23(6), 5117-5120.
www.theijes.com
[14] Liao, W. P., & Yuan, J. (1998). Optimal replacement for a one-unit system subject to delivery and test. Journal of Quality in Maintenance Engineering, 4(1), 51–65. https://doi.org/10.1108/EUM0000000004484
[15] Mangano, G., & de Marco, A. (2014). The role of maintenance and facility management in logistics: A literature review. Facilities, 32(5), 241–255. https://doi.org/10.1108/F-08-2012-0065
[16] Nwaeke, L. I., Harcourt, P., Benaiah, K., & Harcourt, P. (2017). THE INTERNATIONAL JOURNAL OF BUSINESS & MANAGEMENT The Role of Competitive Advantage on Value Creation : A Study of Mobile Telecommunication Network Operations in Rivers State , Nigeria, 5(4), 135–141.