Journal of Chemical and Pharmaceutical Research, 2015, 7(4):431-446
Research Article
ISSN : 0975-7384
CODEN(USA) : JCPRC5
Preparation, spectroscopic and thermal investigations on charge-transfer
complexes formed in the reaction of ribavirin drug and various acceptors
Akmal S. Gaballa
Faculty of Specific Education, Zagazig University, Zagazig, Egypt
_____________________________________________________________________________________________
ABSTRACT
Considerable attention has recently been given to the formation of stable charge-transfer complexes that result from the reaction between drugs and acceptors due to the significant physical and chemical properties of these complexes. Charge-transfer complexes formed between ribavirin (RV) as electron donor with different electron acceptors as iodine (I2), picric acid (HPA), chloranilic acid (H2CA), and 2,3-dichloro-5,6-dicyano1,4-benzoquinone
(DDQ) have been investigated in methanol at room temperature. Based on elemental analyses and IR spectra of the solid CT-complexes along with the photometric titration curves for the reactions, the stoichiometries of all complexes were found to be 1:2 molar ratio between RV and I2, and 1:1 molar ratio between RV and acceptors
(HPA, H2CA, and DDQ). The infrared spectroscopic data indicate a charge transfer interaction associated with a
proton migration from the acceptor to the donor followed by intramolecular hydrogen bonding in [(HRV)(PA)] and [(HRV)(HCA)] complexes. Another charge transfer interactions were observed in [(RV)I]⋅I3, and [(RV)(DDQ)]
complexes. The characteristic physical constants (KCT, µ, ∆G, ID, f, ECT) of the formed CT-complexes are shown to
be strongly dependent on the type and structure of the electron acceptors.
Key words: Charge transfer; Ribavirin;Electron acceptors; UV-visible; IR; TGA spectrometry; Antibacterial activity.
_____________________________________________________________________________________________
INTRODUCTION
Charge-transfer (CT) complexes are formed by the interaction between electron donors and electron acceptors. CT complexation is an important phenomenon in biochemical and bioelectrochemical energy transfer process [1,2]. There is no sharp boundary between the coordination complexes and charge-transfer complexes. However, orbitally, in a CT-complex an electron may be transferred from a nonbonding orbital of the donor to an antibonding orbital of an acceptor. In a coordination complex, there is a donation of a lone pair of electrons from the donor to the vacant orbital of the acceptor. A large numbers of different complexes are stabilized by other bonding contributions [3].
In the past years, CT reaction has been widely studied. A large number of different types of drugs are easily determined by spectrophotometric techniques based on formation of stable CT complexes with electron acceptors [4]. The interactions of the charge-transfer complexes are well known in many chemical reactions such as addition, substitution, and condensation [5]. The molecular interactions between electron donors and acceptors are generally associated with the formation of intensely coloured charge transfer complexes, which absorb radiation in the visible region [6]. Electron donor-acceptor CT interactions are also important in the field of drug-receptor binding mechanism [7] as well as in many biological fields [8]. On the other hand, the CT-reactions of π-acceptors have successfully been utilized in pharmaceutical analysis [9].
Sofosbuvir drug (Sovaldi) [13-15] and some other viral infections [16,17]. Ribavirin is a prodrug, which when metabolized resembles purine RNA nucleotides. In this form, it interferes with RNA metabolism required for viral replication [18,19]. It works by stopping the virus that causes hepatitis C from spreading inside the body. It is not known if treatment that includes ribavirin and another medication cures hepatitis C infection, prevents liver damage that may be caused by hepatitis C, or prevents the spread of hepatitis C to other people.
N N
N O
NH2
OH
HO O
HO
I. Structure of Ribavirin (RV)
To continue our interest in studying the synthesis and spectroscopic characterization of various CT-complexes in order to understand the nature of their CT-interaction [20-25], we have investigated the CT interaction of the drug (ribavirin, RV) as electron donor with different electron acceptors (I2, HPA, H2CA, DDQ), II. The nature and
structure of the final products have been characterized using elemental analyses, electronic absorption spectroscopy, IR, and thermal analyses.
OH
NO2 O2N
NO2
O
O
OH
Cl Cl
HO
O
O Cl
Cl NC
NC
HPA H2CA DDQ
II. Structure of the acceptors
EXPERIMENTAL SECTION
Chemicals and spectral measurements
All chemicals used were of high grade. The compound 1-((2R,3R,4S,5R)-tetrahydro-3,4-dihydroxy-5-(hydroxymethyl)furan-2-yl)-1H-1,2,4-triazole-3-carboxamide (Ribavirin, RV) was obtained from Egyptian International Pharmaceutical Industry Co. (EIPICO), Egypt with purity of > 99.00% and was used without further purification. Iodine (I2), picric acid (HPA) chloranilic acid (H2CA), and 2,3-dichloro-5,6-dicyano-p-benzoquinone
(DDQ) purchased from Merck Chemical Co. and were also used as received.
The electronic absorption spectra were recorded in region of 200-900 nm using UV-Vis. Spectrophotometer model JASCO V-530 with quartz cell of 1.00 cm path length. The infrared spectra of the reactants and the obtained complexes were recorded using KBr discs on Perkin-Elmer 1430 ratio recording Infrared spectrometer.
Elemental analyses of the dried and pure samples were carried out in microanalysis unit of Cairo University, Egypt using CHNS-932 (LECO) and Vario Elemental analysers. Chlorine was determined by burning the substance in oxygen with platinum contact and following titration with mercuric nitrate towards diphenylcarbazide. The results of elemental analyses of the solid complexes were in consistence with stoichiometric ratios obtained from photometric titrations.
Spectrophotometric titration measurements
Photometric titrations at (290, 360), (355, 395), (372, 525) and (406, 470) nm were performed for the reactions between RV and acceptors I2, HPA, H2CA, DDQ, respectively in methanol at 25oC using a Helios Gamma Unicam
UV-Vis. Spectrophotometer and Jenway Visible range spectrophotometer model 6300 as follows. A 0.25, 0.50, 0.75, 1.00, 1.25, 1.5, 2.00, 2.50, 3.00 and 3.50 mL aliquot of a standard solution (1.0×10⁻⁴ M) of each acceptor in MeOH was added to 1.00 mL of 1.0×10⁻⁴ M RV, which was also dissolved in MeOH. The concentration of RV (
C
do) in the reaction mixture was maintained at 1×10⁻⁴ M, while the concentrations of the acceptors (C
ao) were changed over a wide range of concentrations (0.25×10⁻⁴ M to 3.5×10⁻⁴ M) to produce solutions with an acceptor molar ratio that varied from 0.25:1.00 to 3.50:1.00. The stoichiometry of the molecular CT-complexes was obtained from the determination of the conventional spectrophotometric molar ratio according to the known method [26].Preparation of the solid complexes
The solid [(RV)I]·I3 (1), [(HRV)(PA)] (2), [(HRV)(HCA)] (3) and [(RV)(DDQ)] (4) complexes were prepared by
adding a methanolic solution (20.0 mL) of the acceptors (2.00 mmol) to a methanolic solution (10.0 mL) of the donor RV (1.00 mmol). The resultant dark brown, scarlet-yellow, dark violet, and dark red solutions of complexes 1,
2, 3 and 4, respectively were stirred for about 5 h at room temperature then left overnight to separate the solid
complexes. The precipitated complexes were filtrated off, washed with MeOH (3×1/2 mL) and dried in vacuo over CaCl2.
[(RV)I]+·I3− (1): Anal found (Calcd. for C8H12I4N4O5, 751.82): C, 12.65 (12.78); H, 2.08 (1.61); N, 7.57 (7.45).
[(HRV)(PA)] (2): Anal. found (Calcd. for C14H15N7O12, 473.31): C, 35.46 (35.53); H, 3.36 (3.19); N, 20.55 (20.72).
[(HRV)(HCA)] (3): Anal. found (Calcd. for C14H14Cl2N4O9, 453.19): C, 37.05 (37.10); H, 3.46, (3.11); Cl, 16.00
(15.65); N, 12.48 (12.36).
[RV)(DDQ)] (4): Anal. found (Calcd. for C16H12Cl2N6O7, 471.21): C, 40.75 (40.78); H, 2.90 (2.57); Cl, 15.77
(15.05); N, 17.91 (17.84) .
Antibacterial activity
The antimicrobial activities of the CT complexes with rebavirin and the pure solvent were tested in vitro against bacterial strains (Pseudomonas aeruginosa, Staphylococcus aureous, Bacillus subtillis, Escherichia coli) using agar well diffusion method. The samples were dissolved in DMSO to make a concentration of 100 µg/mL. The inoculum (1×10⁸ Cfu/mL) was added to molten agar and the media were shaken to disperse the microorganisms. Four millimeters diameter wells were punched in the agar with a sterile cork borer. A 10 µL of the sample was introduced in the well. Antimicrobial activity was evaluated by measuring the diameter of inhibition zone in mm [27,28].
RESULTS AND DISCUSSION Electronic spectra
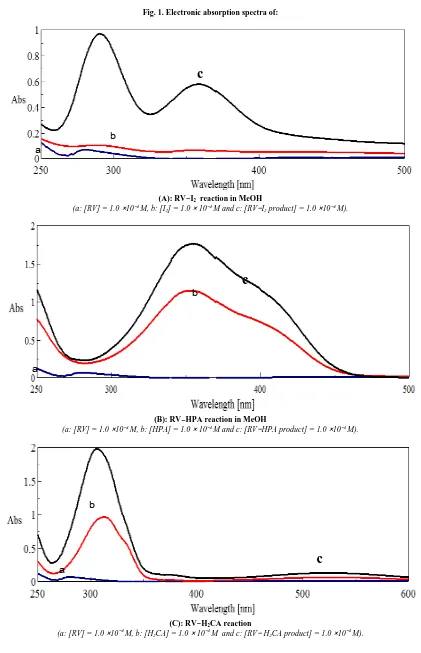
Electronic absorption spectra of the donor RV and of the formed CT-complexes are shown in Fig. 1. These spectra have revealed new strong absorption bands attributed to the CT-interactions. These bands are not present in the spectra of the free reactants and are observed at (290, 360), (355, 39 5, (372, 525), (406, 470) nm for the complexes, ) [(RV)I]·I3(1), [(HRV)(PA)] (2), [(HRV)(HCA)] (3) and [(RV)(DDQ)] (4), respectively. Polyiodides (In when n=3,
5, 7) are characterized by the appearance of two absorption bands in the electronic spectrum of the iodine complex 1 [29-32]. The data obtained indicate the presence of
I
3− species in the polyiodide unit. The formation of triiodide with RV in which I+ is included in the organic moiety of RV is shown in the following proposed mechanism:[(RV)I ]·I
(RV) + I
2[(RV)I ]·I
3+ I
2Fig. 1. Electronic absorption spectra of:
(A): RV−I2 reaction in MeOH
(a: [RV] = 1.0 ×10⁻⁴ M, b: [I
2] = 1.0 × 10⁻⁴ M and c: [RV−I2 product] = 1.0 ×10⁻⁴ M).
(B): RV−HPA reaction in MeOH
(a: [RV] = 1.0 ×10⁻⁴ M, b: [HPA] = 1.0 × 10⁻⁴ M and c: [RV−HPA product] = 1.0 ×10⁻⁴ M).
(C): RV−H2CA reaction
(a: [RV] = 1.0 ×10⁻⁴ M, b: [H
2CA] = 1.0 × 10⁻⁴ M and c: [RV− H2CA product] = 1.0 ×10⁻⁴ M).
b
c
a
c
c
b
b
a
(D): RV−DDQ reaction
(a: [RV] = 1.0 ×10⁻⁴ M, b: [DDQ] = 1.0 × 10⁻⁴ M and c: [RV− DDQ product] = 1.0 ×10⁻⁴ M).
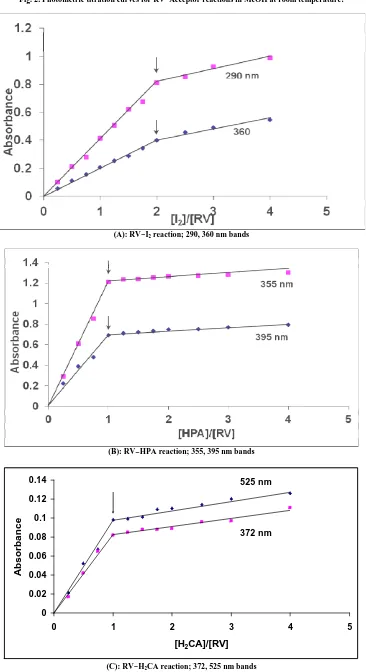
Photometric titration measurements based on these characteristic CT-absorption bands of the CT-complexes, Fig. 2, confirmed the complex formation in a ratio, RV: acceptor of 1:2 for complex 1 and 1:1 for complexes 2−4 [33]. The
obtained spectrophotometric data, Tables 1 and 2(A-C) were used to calculate the values of both equilibrium constants, KCT, and extinction coefficient, ε of the CT-complexes in MeOH for [(RV)I]·I3, [(HRV)(PA)],
[(HRV)(HCA)] and [(RV)(DDQ)] complexes based on the known equation (1) for the 1:2 stoichiometry [34] and equation (2) for the 1:1 stoichiometry [35].
ε
εκ
)
4
(
1
2 o o o
o o
a d a
c a
d
C
C
C
A
C
C
+
+
=
⋅
(1)
ε
ε
o o o
o
a d
c a
d
C
C
K
A
C
C
+
+
=
⋅
1
(2)
where o a
C
ando d
C
are initial concentration of the acceptors (I2, HPA, H2CA, DDQ) and donor RV, respectively.
A is the absorbance of new strong bands at (290, 360), (355, 395), (372, 525), (406, 470) nm.
When (
C
dC
a/
A
2
o
o
⋅
) are plotted against o(
4
o o)
a da
C
C
C
+
for complex 1 andC
do.C
ao/A are plotted against (C
do+C
ao) for complexes 2−4, straight lines are obtained with a slope of 1/ε and intercept of 1/εκc.
Some spectroscopic and physical parameters such as standard free energy (∆Gº), transition dipole moment (µ),
oscillator strength (f) and the ionization potential (ID) were estimated for complexes dissolved in MeOH at 25ºC and
summarized in Table 3.
c
b
Fig. 2. Photometric titration curves for RV−Acceptor reactions in MeOH at room temperature:
(A): RV−I2 reaction; 290, 360 nm bands
(B): RV−HPA reaction; 355, 395 nm bands
0 0.02 0.04 0.06 0.08 0.1 0.12 0.14
0 1 2 3 4 5
[H2CA]/[RV]
A
b
s
o
rb
a
n
c
e
372 nm 525 nm
(C): RV−H2CA reaction; 372, 525 nm bands
0 0.05 0.1 0.15 0.2 0.25 0.3 0.35
0 1 2 3 4 5
[DDQ]/[RV] A b s o rb a n c
e 470 nm
406 nm
[image:7.595.108.476.71.262.2]
(D): RV−DDQ reaction; 406, 470 nm bands
Table 1. Molar concentrations for (RV) with the acceptors in the reaction mixtures
Base conc., × 10−4 M Acceptor Concentration range of the acceptors, M Acceptor-base molar ratio 1.00 I2 0.25 × 10⁻⁴ – 4 × 10⁻⁴ 0.25: 1.00 – 4.00:1.00
1.00 HPA 0.25 × 10⁻⁴ – 4 × 10⁻⁴ 0.25: 1.00 – 4.00:1.00
1.00 H2CA 0.25 × 10⁻⁴ – 4 × 10⁻⁴ 0.25: 1.00 – 4.00:1.00
[image:7.595.102.475.353.537.2]1.00 DDQ 0.25 × 10⁻⁴ – 4 × 10⁻⁴ 0.25: 1.00 – 4.00:1.00
Table 2A. The Values of
C
do⋅
C
ao2/
A
andC
ao(
4
C
do+
C
ao)
for complex 1Va, ml
(5.00 × 10⁻⁴ M)*
o a
C
,× 10-4
Ratio (a/d) A 8 10 ), 4 ( − × + o o o a d
a C C
C 12 2 10 , / − ×
⋅C A
Cd a
o o 1, 290 nm 1, 360 nm 1, 290 nm 1, 360 nm 0.25 0.25 0.25 0.101 0.055 1.063 6.188 1.136 0.50 0.50 0.50 0.211 0.11 2.250 11.848 2.273 0.75 0.75 0.75 0.278 0.156 3.563 2.023 3.606 1.00 1.00 1.00 0.415 0.205 5.000 2.409 4.878 1.25 1.25 1.25 0.505 0.255 6.563 3.109 6.127 1.50 1.50 1.50 0.620 0.288 8.250 3.629 7.813 1.75 1.75 1.75 0.675 0.345 10.063 4.537 8.877 2.00 2.00 2.00 0.811 0.399 12.000 4.932 10.025 2.50 2.50 2.50 0.855 0.456 16.250 7.309 13.706 3.00 3.00 3.00 0.925 0.489 21.000 9.729 18.405 4.00 4.00 4.00 0.989 0.545 32.000 16.178 29.358
*Vd, is 1 ml (5.00 × 10⁻⁴ M);
C
do is 1.00 × 10⁻⁴ M in all systems. Table 2B. The Values ofC
do.C
ao/A andC
do+C
ao for complexes 2 and 3Va, ml
(5.00 × 10⁻⁴
M)*
o a
C
,× 10-4
Ratio (a/d)
A
C
do+C
ao,× 10-4
o d
C
.C
ao,× 10-8
o d
C
.C
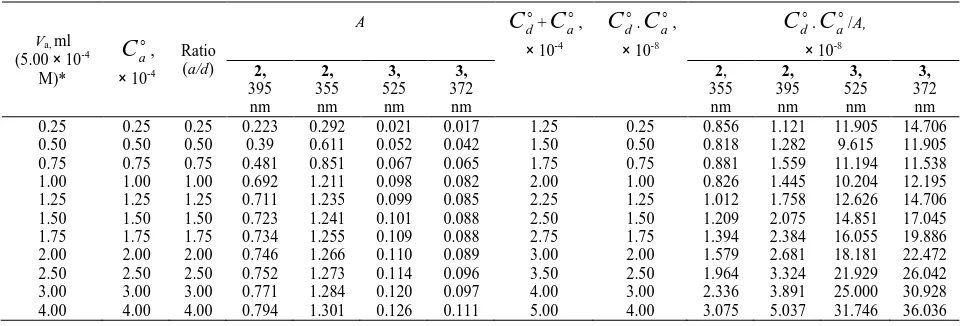
ao/A,× 10-8 2, 395 nm 2, 355 nm 3, 525 nm 3, 372 nm 2, 355 nm 2, 395 nm 3, 525 nm 3, 372 nm 0.25 0.25 0.25 0.223 0.292 0.021 0.017 1.25 0.25 0.856 1.121 11.905 14.706 0.50 0.50 0.50 0.39 0.611 0.052 0.042 1.50 0.50 0.818 1.282 9.615 11.905 0.75 0.75 0.75 0.481 0.851 0.067 0.065 1.75 0.75 0.881 1.559 11.194 11.538 1.00 1.00 1.00 0.692 1.211 0.098 0.082 2.00 1.00 0.826 1.445 10.204 12.195 1.25 1.25 1.25 0.711 1.235 0.099 0.085 2.25 1.25 1.012 1.758 12.626 14.706 1.50 1.50 1.50 0.723 1.241 0.101 0.088 2.50 1.50 1.209 2.075 14.851 17.045 1.75 1.75 1.75 0.734 1.255 0.109 0.088 2.75 1.75 1.394 2.384 16.055 19.886 2.00 2.00 2.00 0.746 1.266 0.110 0.089 3.00 2.00 1.579 2.681 18.181 22.472 2.50 2.50 2.50 0.752 1.273 0.114 0.096 3.50 2.50 1.964 3.324 21.929 26.042 3.00 3.00 3.00 0.771 1.284 0.120 0.097 4.00 3.00 2.336 3.891 25.000 30.928 4.00 4.00 4.00 0.794 1.301 0.126 0.111 5.00 4.00 3.075 5.037 31.746 36.036
[image:7.595.49.535.584.747.2]Table 2C. The Values of
C
do.C
ao/A andC
do+C
ao for complex 4Va, ml
(5.00 × 10⁻⁴ M)*
o a
C
,× 10-4
Ratio (a/d)
A
C
do+C
ao,× 10-4
o d
C
.C
ao,× 10-8
o d
C
.C
ao/A,× 10-8 4,
406 nm
4,
470 nm
4,
406 nm
4,
470 nm 0.25 0.25 0.25 0.022 0.051 1.25 0.25 11.364 4.902 0.50 0.50 0.50 0.051 0.145 1.50 0.50 9.804 3.448 0.75 0.75 0.75 0.071 0.205 1.75 0.75 10.563 3.659 1.00 1.00 1.00 0.088 0.281 2.00 1.00 11.364 3.559 1.25 1.25 1.25 0.091 0.283 2.25 1.25 13.736 4.417 1.50 1.50 1.50 0.094 0.285 2.50 1.50 15.957 5.263 1.75 1.75 1.75 0.095 0.288 2.75 1.75 18.421 6.076 2.00 2.00 2.00 0.101 0.289 3.00 2.00 19.802 6.920 2.50 2.50 2.50 0.104 0.289 3.50 2.50 24.038 8.651 3.00 3.00 3.00 0.105 0.290 4.00 3.00 28.571 10.345 4.00 4.00 4.00 0.108 0.291 5.00 4.00 37.037 13.746
*Vd, is 1 ml (5.00 × 10⁻⁴ M);
o d
[image:8.595.98.481.281.679.2]C
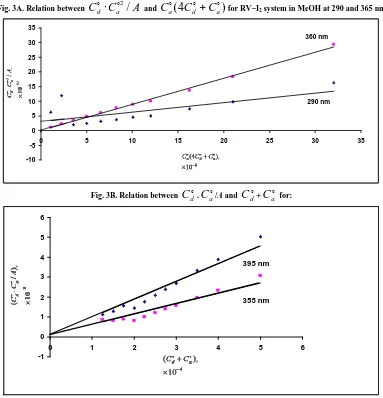
is 1.00 × 10⁻⁴ M in all systems.Fig. 3A. Relation between
C
do⋅
C
ao2/
A
andC
ao(
4
C
do+
C
ao)
for RV−I2 system in MeOH at 290 and 365 nm-10 -5 0 5 10 15 20 25 30 35
0 5 10 15 20 25 30 35
290 nm 360 nm
Fig. 3B. Relation between
C
do.C
ao/A andC
do+C
ao for:-1 0 1 2 3 4 5 6
0 1 2 3 4 5 6
. .
. . .
355 nm 395 nm
0 5 10 15 20 25
0 0.5 1 1.5 2 2.5 3 3.5
525 nm
372 nm
(C) RV−H2CA system in MeOH at 372 and 525 nm
-5 0 5 10 15 20 25
0 0.5 1 1.5 2 2.5 3 3.5
406 nm
570 nm
(D) RV−DDQ system in MeOH at 406 and 570 nm
The oscillator strength (ƒ) is a dimensionless quantity used to express the transition probability of the CT band. From the CT absorption spectra, the oscillator strength (ƒ) can be estimated by equation 3 [36].
)
(
10
319
.
4
×
9ε
max⋅
∆
υ
1/2=
−f
(3)
where εmax is the maximum extinction coefficient of the CT band, and
∆
υ
1/2 is the half-bandwidth in cm-1 (i.e., the
bandwidth at half of the maximum extinction coefficient value).
The transition dipole moments (µ) of the RV CT-complexes have been calculated from equation 4 [37].
2 / 1
max 2 / 1 max )
(
0
.
958
(
υ
)
υ
ε
µ
Debye=
⋅
∆
(4)
The transition dipole moment can be used to determine if a particular transition is allowed; the transition from a bonding π-orbital to an antibonding π* orbital is allowed because the integral that defines the transition dipole moment is nonzero.
The ionization potentials (ID) of the RV donor in the CT complexes were calculated using the empirical equation (5) derived by Aloisi and Pignataro [38].
CT eV
D
I
( )=
5
.
76
+
1
.
53
×
10
−4⋅
υ
where
υ
CT is the wavenumber in cm-1 that corresponds to the CT band formed from the interaction between the donor and the acceptor. The electron-donating power of a donor molecule is measured by its ionization potential, which is the energy required to remove electron from the highest occupied molecular orbital.The energy values (ECT) of the n to π* and π–π* interactions between the donor (RV) and the acceptors were calculated using equation 6 derived by Briegleb [39].
) ( / 667 . 1243 )
( CT CT nm
CT h
E =
υ
=λ
(6)
where λCT is a wavelength of the CT band.
The standard free energy of complexation ∆Gº for each complex was calculated using equation 7 [40].
CT
K RT
G =−2.303 log
∆ o
(7)
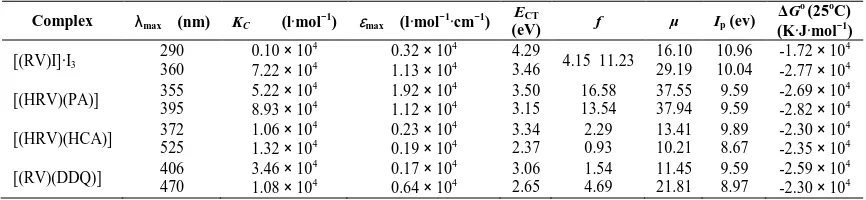
The obtained data in Table 3 showed that, the complexes [(RV)I]·I3 and [(HRV)(PA)] exhibit considerably higher
[image:10.595.73.506.357.457.2]values of both the oscillator strength (f) and the transition dipole moment (µ) which indicated a strong interaction between the donor–acceptor pairs with relatively high probabilities of CT transitions [41]. Also, in complex 1 a relatively higher degree of ionization potential of the donor is observed. The obtained negative values of ∆Go for the CT-complexes indicate that the interaction between the drug and acceptors is exothermic and spontaneous [42,43].
Table 3. Spectrophotometric results for RV CT-complexes in MeOH
Complex λmax (nm) KC (l⋅mol−1) εmax (l⋅mol−1⋅cm−1)
ECT
(eV) f µ Ip (ev)
∆Go(25oC) (K⋅J⋅mol−1)
[(RV)I]⋅I3
290 360
0.10 × 10⁴
7.22 × 10⁴
0.32 × 10⁴
1.13 × 10⁴
4.29
3.46 4.15 11.23 16.10 29.19
10.96 10.04
-1.72 × 10⁴
-2.77 × 10⁴
[(HRV)(PA)] 355 395
5.22 × 10⁴
8.93 × 10⁴
1.92 × 10⁴
1.12 × 10⁴
3.50 3.15 16.58 13.54 37.55 37.94 9.59 9.59
-2.69 × 10⁴
-2.82 × 10⁴
[(HRV)(HCA)] 372 525
1.06 × 10⁴
1.32 × 10⁴
0.23 × 10⁴
0.19 × 10⁴
3.34 2.37 2.29 0.93 13.41 10.21 9.89 8.67
-2.30 × 10⁴
-2.35 × 10⁴
[(RV)(DDQ)] 406 470 3.46 × 10
4
1.08 × 10⁴
0.17 × 10⁴ 0.64 × 10⁴
3.06 2.65 1.54 4.69 11.45 21.81 9.59 8.97
-2.59 × 10⁴ -2.30 × 10⁴
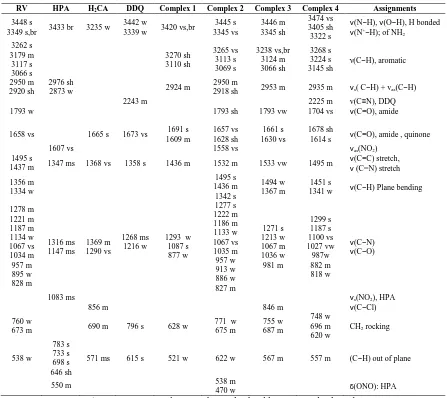
IR Spectra
IR spectra of reactants and the obtained products are given in Fig. 4 and the assignments of their characteristic bands are given in Table 4. The formation of CT- complexes during the reaction of RV with I2, picric acid, chloranilic acid
and DDQ is strongly supported by observing of main infrared bands of the donor (RV) and acceptors (HPA, H2CA,
DDQ) in the product spectra. However, the bands of the donor and acceptors in the complexes spectra reveal small shifts in wavenumber values and intensities compared with those of the free donor and acceptors. This should be attributed to the expected symmetry and electronic structure changes upon the formation of CT- complexes.
For acid–base interaction, a proton transfer from the acceptor (acid) to the donor (base) is expected to occur. This seems to be liable to occur in the case of RV interaction with picric and chloranilic acids. Such assumption is strongly supported as follow; the spectrum of free donor reveals to absorption peaks at 3448 and 3349 cm−1 which is characteristic to the presence of an –NH2 and –OH groups are slightly shifted toward lower frequencies. This small
shift was attributed to the presence of many hydroxo groups, hydrogen bond formation and the (N−H) stretching vibration of hydrogen against positively charged nitrogen. We may suggest that, the acid-base interaction is associated with a proton migration followed by hydrogen bonding formation. The RV–HPA and RV–H2CA
interaction involves a protonation for the basic nitrogen of the CFX nitrogens. Accordingly, we may formulate the complex as [(HRV)+(PA)-] , [(HRV)+(HCA)-]. Due to the increased electron density on the picrate and chloranilate units as a result of charge transfer interaction and deprotonation of the acids upon complexation, the shift of
νas(NO2) of the picric acid and ν(C−Cl) of chloranilic acid to lower frequencies upon complexation can be attributed
[44-47].
the quinones in acceptor goes to lower frequencies upon complexation with DDQ and this is in consistence with the increased electron density on the acceptor upon complexation [46-50].
Table 4. Characteristic infrared frequencies* (cm-1) and tentative assignments for RV and its CT-complexes
RV HPA H2CA DDQ Complex 1 Complex 2 Complex 3 Complex 4 Assignments
3448 s
3349 s,br 3433 br 3235 w
3442 w
3339 w 3420 vs,br
3445 s 3345 vs 3446 m 3345 sh 3474 vs 3405 sh 3322 s
ν(N−H), ν(O−H), H bonded
ν(N+−H); of NH 2 3262 s 3179 m 3117 s 3066 s 3270 sh 3110 sh 3265 vs 3113 s 3069 s 3238 vs,br 3124 m 3066 sh 3268 s 3224 s 3145 sh
ν(C−H), aromatic
2950 m 2920 sh
2976 sh
2873 w 2924 m
2950 m
2918 sh 2953 m 2935 m νs( C−H) + vas(C−H)
2243 m 2225 m v(C≡N), DDQ
1793 w 1793 sh 1793 vw 1704 vs ν(C=O), amide
1658 vs 1665 s 1673 vs 1691 s 1609 m 1657 vs 1628 sh 1661 s 1630 vs 1678 sh
1614 s ν(C=O), amide , quinone
1607 vs 1558 vs νas(NO2)
1495 s
1437 m 1347 ms 1368 vs 1358 s 1436 m 1532 m 1533 vw 1495 m
ν(C=C) stretch,
ν (C=N) stretch 1356 m 1334 w 1495 s 1436 m 1342 s 1494 w 1367 m 1451 s
1341 w ν(C−H) Plane bending
1278 m 1221 m 1187 m 1134 w 1067 vs 1034 m 957 m 895 w 828 m 1316 ms 1147 ms 1369 m 1290 vs 1268 ms 1216 w
1293 w 1087 s 877 w 1277 s 1222 m 1186 m 1133 w 1067 vs 1035 m 957 w 913 w 886 w 827 m 1271 s 1213 w 1067 m 1036 w 981 m 1299 s 1187 s 1100 vs 1027 vw 987w 882 m 818 w
ν(C−N)
ν(C−O)
1083 ms νs(NO2), HPA
856 m 846 m ν(C−Cl)
760 w
673 m 690 m 796 s 628 w
771 w 675 m 755 w 687 m 748 w 696 m 620 w
CH2 rocking
538 w
783 s 733 s 698 s 646 sh
571 ms 615 s 521 w 622 w 567 m 557 m (C−H) out of plane
550 m 538 m
470 w δ(ONO): HPA
*: s, strong; w, weak; m, medium; sh, shoulder; v, very; br, broad.
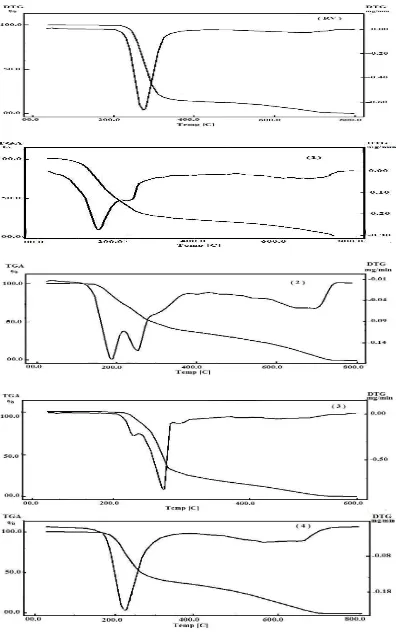
Thermal analysis
The proposed structures for the complexes under investigation were confirmed by measuring TGA, and DTG thermograms (Fig. 5) under nitrogen flow. The thermal data obtained for complexes 1, 2, 3 and 4 together with the free donor, RV are summarized and given in Table 5.
The free RV decomposes in two steps at 272oC and 670oC. The total weight loss associated with these steps of decomposition is close to the theoretical calculation. The decomposition mode of the complexes under investigation occurs in a similar manner.
The decomposition reactions of complex 1 occur in two closed main stages. The first stage of decomposition occurs in one step at 156oC with a weight loss of 69.00% and the second stage at 227oC with a weight loss of 31.00%. These values of weight loss may be due to the loss of two iodine molecules and organic moiety of the donor (RV) in good agreement with the calculated values of 67.52% and 32.48%, respectively.
In complex 4, the decomposition reactions occur in two main stages and each at 224 and 644oC with a weight loss of 52.45% and 47.55%. These values of weight loss may be due to the loss of (RV) and (DDQ) organic moieties in good agreement with the calculated values of 51.83% and 48.17%, respectively [51].
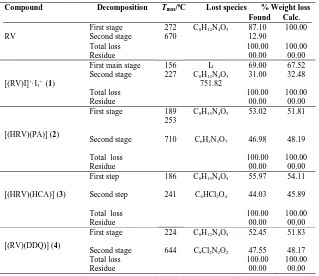
Table 5. The maximum temperature values for the decomposition along with the species lost in each step of the decomposition reaction of the free RV and its CT-complexes
Compound Decomposition Tmax/oC Lost species % Weight loss
Found Calc.
RV First stage Second stage Total loss Residue 272 670
C8H12N4O5 87.10
12.90 100.00 00.00 100.00 100.00 00.00
[(RV)I]+· I3− (1)
First main stage Second stage Total loss Residue 156 227 I4
C8H12N4O5
751.82 69.00 31.00 100.00 00.00 67.52 32.48 100.00 00.00 [(HRV)(PA)] (2) First stage Second stage
Total loss Residue
189 253
710
C8H13N4O5
C6H2N3O7
53.02 46.98 100.00 00.00 51.81 48.19 100.00 00.00 [(HRV)(HCA)] (3) First step Second step
Total loss Residue
186
241
C8H13N4O5
C6HCl2O4
55.97 44.03 100.00 00.00 54.11 45.89 100.00 00.00 [(RV)(DDQ)] (4) First stage Second stage Total loss Residue 224 644
C8H12N4O5
C8Cl2N2O2
52.45 47.55 100.00 00.00 51.83 48.17 100.00 00.00 Antibacterial activity
The antibacterial activity of the CT-complexes with rebavirin were screened in vitro against two gram-positive bacterial strains, Staphylococcus aureus and Bacillus subtilis, and two gram-negative bacterial strains, Escherichia
coli and Pseudomonas aeruginosa. The activity was determined by measuring the inhibition zone diameter values
(mm) of the complexes against the microorganisms. Ampicillin was used as the positive control. The screening data are listed in Table 6. The results indicated that the rebavirin CT-complexes exhibited moderate inhibitory results against all of the gram-positive and gram-negative bacterial species. It is obvious that the antibacterial activities of the CT-complexes are lower than Ampicillin standard and complex 2 have the higher antibacterial activity than other complexes.
Table 6. Antibacterial activity (inhibition zone diameter in mm) of RV CT-complexes
Sample
Bacteria
Bacillus subtillis, G+
Staphylococcus aureus, G+
Esherichia coli, G−
Pseudomonas aeroginosa, G−
DMSO 0.0 0.0 0.0 0.0
Ampicilin 22 23 23 21
Complex 1 18 19 18 17
Complex 2 19 20 19 18
Complex 3 14 15 14 15
Complex 4 17 17 15 15
CONCLUSION
Charge transfer interactions between the donor (RV) with the σ-acceptor like I2 and π-acceptors such as HPA, H2CA
and DDQ were studied in MeOH at 25oC. The synthesized CT-complexes were characterized using various spectroscopic techniques including UV–visible, and IR spectroscopy and confirmed by elemental and thermal analyses. The reactions stoichiometries were found to be 1:2 for complex 1 and 1:1 for complexes 2−4 and had the
formulas: [(RV)I]+·I3− (1), [(HRV)+(PA)-] (2), [(HRV)+(HCA)-] (3) and [(RV)(DDQ)] (4). Reaction of RV with
iodine resulted in formation of tri iodide. The interaction between the donor (RV) and HPA, H2CA acceptors was
[image:14.595.156.425.518.605.2]Finally, we could conclude that the interaction of Rebavirin (RV) as a donor with different acceptors proceeds in a molar ratio of 1:2 and 1:1 according to Scheme 1 as follows:
2 I
2OH NO2
O2N
NO2 O O OH Cl Cl HO O O Cl Cl NC NC
[(RV)I]
+· I
3O O2N
NO2 NO2 H O O O Cl Cl HO
(1)
(2)
(3) (4) N N NO NH2
OH OH O OH
(RV)
N N N O H3NHO OH O OH H N N N O
H2N OH
OH O OH N N N O
H2N OH
OH O OH O O Cl Cl NC NC
Scheme 1. Proposed CT-complexes of Rebavirin (RV) with different electron acceptors
REFERENCES
[1] DK Roy; A Saha; AK Mukherjee, Spectrochim. Acta, 2005, A61, 2017. [2] ME El-Zaria, Spectrochim. Acta, 2008, A69(1), 216–221.
[3] F Gutmann; C Johnson; H Keyzer; J. Molnár. Charge-Transfer Complexes in Biochemical Systems. Marcel Dekker Inc., 1997.
[4] M Pandeeswaran; KP Elango, Spectrochim. Acta, 2010, A75(5), 1462–1469.
[5] FP Flá; J Palou; R Valero; CD Hall; P Speers, J. Chem. Soc., Perkin Transactions, 1991, 2(12), 1925–1932. [6] R Foster. Organic Charge Transfer Complexes. Academic Press, London, UK, 1969.
[7] A Korolkovas. Essentials of Medical Chemistry, chapter 3, John Wiley & Sons, New York, NY, USA, 2nd Edition, 1998, Chapter 3.
[8] AM Slifkin. Charge-Transfer Interaction of Biomolecules. Academic Press, New York, NY, USA, 1971. [9] FM Abou Attia, Farmaco, 2000, 55(11-12), 659–664.
[10] J Carter; V Saunders. Virology, Principles and Applications. John Wiley & Sons, 2007.
[11] GL Davis; E Esteban-Mur; V Rustgi; J Hoefs; SC Gordon; C Trepo; ML Shiffman; S Zeuzem; A Craxi; JK Albrecht, New Engl. J. Med., 1998, 339, 1493.
[12] JG McHutchison; SC Gordon; ER Schiff; ML Shiffman; WM Lee; VK Rutsgi; ZD Goodman; MH Ling; S Cort; JK Albrecht, New Engl. J. Med., 1998, 339, 1485.
[13] FA Berden; W Kievit; LC Baak, Neth J. Med., 2014, 72 (8), 388–400.
[14] E Cholongitas; GV Papatheodoridis, Ann Gastroenterol, 2014, 27(4), 331–337. [15] TT Tran; Am. J. Manag. Care, 2012, 18 (14 Suppl), S340–9.
[16] A Dozal; H Keyzer; HK Kim; WW Wang, Int. J. Antimicrob. Agent, 2000, 14, 261.
[17] AM Ortega-Prieto; J Sheldon; A Grande-Pérez; H Tejero; J Gregori; J Quer; JI Esteban; E. Domingo; C Perales. In Vartanian, Jean-Pierre. PLoS ONE, 2013, 8(8): e71039.
[18] J Paeshuyse; K Dallmeier; J. Neyts, Current Opinion in Virology, 2011, 1(6), 590–8.
[19] Q Zhu; N Li; Q Han; P Zhang; C Yang; X Zeng; Y Chen; Y Lv; X Liu; Z Liu, Antiviral Research, 2013, 98(3), 373–9.
[21] AS Gaballa; C Wagner; EM Nour, SM Teleb; MAF Elmosallamy; GN Kaluderovic´; H Schmidt; D Steinbon,
J. Mol. Struct., 2008, 876, 301-308.
[22] AS Gaballa, J. Mol. Struct., 2013, 1043, 91–102.
[23] MM Ali; AS Gaballa; RA Haggam; NA El-Khososy; SM Teleb, J. chem. Pharm. Research, 2014, 6(11), 570-580.
[24] MM Ali; AS Gaballa; SM Teleb, Russian J. of General Chem., 2015, 85(2),xxx-xxx. [25] AS Gaballa; AS Amin, Spectrochim. Acta, 2015, A145, 302–312.
[26] DA Skoog. Principle of Instrumental Analysis. 3rd Edition, Saunder College Publishing, New York, 1985, Chapter 7.
[27] DJ Beecher; AC Wong, Appl.Microbiol., 1994, 60, 4614–4616.
[28] National Committee for Clinical Laboratory Standards. Methods for Antimicrobial Susceptibility Testing of Anaerobic Bacteria: Approved Standard M11 A3.NCCLS, Wayne, PA, USA, 1993.
[29] AS Gaballa; SM Teleb; E Rusanov; D Steinborn, J. Inorg. Chim. Acta, 2004, 357, 4144−4150. [30] EM Nour; LH Chen; J Laane, J. Phys. Chem., 1986, 90, 2841.
[31] PH Svensson; L Kloo, Chem. Rev., 2003, 103(5), 1649–1684. [32] X Yua; RH Atalla, Carbohydrate Research, 2005, 340, 981–988.
[33] SY Al-Qaradawi; HS Bazzi; A Mostafa; EM Nour, J. Mol. Struct., 2011, 998, 126. [34] A El-Kourashy, Spectrochim. Acta, 1981, A37, 399.
[35] R Abou-Ettah; A El-Korashy, J. Phys. Chem., 1972, 76, 2405. [36] H Tsubomura, RP Lang, J. Am. Chem. Soc., 1961, 83, 2085.
[37] R Rathore; SV Lindeman; JK Kochi, J. Am. Chem. Soc., 1997, 119, 9393. [38] G Aloisi; S Pignataro, J. Chem. Soc., Faraday Trans., 1972, 69 534.
[39] G Briegleb, Z. Angew. Chem., 1960, 72, 401; G Briegleb, Z. Angew. Chem., 1964, 76, 326. [40] R Abu-Eittah; F Al-Sugeir, Can. J. Chem., 1976, 54, 3705.
[41] MEM Hassouna; GA Zaki, Int. J. Adv. Research, 2014, 2(4), 453-461. [42] KM Al-Ahmary; MM Habeeb; EA Al-Solmy, J. Mol. Liqs., 2011, 162, 129. [43] AS Al-Attas; MM Habeeb; DS Al-Raimi, J. Mol. Struct., 2009, 928, 158. [44] AA Adam, Spectrochim. Acta, 2013, A104, 1.
[45] AS Gaballa; SM Teleb; E Nour, J. Mol. Struct., 2012, 1024, 32-39. [46] SM Teleb; AS Gaballa, Spectrochim. Acta, 2005, A62(1-3), 140-145. [47] FJ Muhtadi, Anal. Profiles Drug Subst., 1984, 13, 737.
[48] DW Mayo; FA Miller; RW Hannah. Course Notes on the Interpretation of Infrared and Raman Spectra. John Wiley & Sons, 2003.
[49] B Stuart. Infrared Spectroscopy: Fundamentals and Applications. John Wiley & Sons, Ltd, 2004. [50] SW Azeem; MA Khan; I Ahmad, Pak. J. Pharm. Sci., 2005, 18, 33.