A Proposal to Design of an Integrated System for Analysis
of Structural Performance and Environmental
Impact Assessments
Ali Jamshidi
*, Kiyofumi Kurumisawa, Toyoharu Nawa
Faculty of Engineering, Hokkaido University, Japan
Copyright © 2015 by authors, all rights reserved. Authors agree that this article remains permanently open access under the terms of the Creative Commons Attribution License 4.0 International License
Abstract
This study proposes a simple methodology that enables concrete infrastructure asset (CIA) designers to analyze structural performance and environmental loads, in terms of greenhouse gas emissions. In this respect, mortar samples containing a type of industrial by-product material, namely fly ash, were prepared. The analysis covers material processing, concrete production, and transportation. A methodology to compare sustainability of CIAs based on the Carbon footprint criteria was developed based on the mechanical performance and environmental loadings according to the conditioning procedures. The results clearly showed the efficient performance of the proposal method in green design of CIAs.Keywords
Sustainable Construction, Cleaner Design, Green Pavement, Concrete Block Pavement1. Introduction
A nation’s economy is strongly linked to its ability to feed and shelter citizens and defended itself. Such performances depend on the infrastructure assets designed by engineers. Significant role of infrastructure asset, as foundation of society’s wealth, is often neglected. The infrastructure asset performance affects productivity, emission, public health issue. In addition, a nation’s potentials in natural and manmade disasters are measured based on the available infrastructure assets that classified in seven main groups: (1) Transportation; (2) Water and waste water; (3) Waste management; (4) Energy production and distribution; (5) Buildings; (6) Recreation facilities; (7) Communications.
As shown, transportation is one of the important assets and or CIA that can be considered as cornerstone of a sustainable economic growth. Transportation infrastructure asset consists four main components as follow: (1) Pavements; (2) Drainage systems; (3) Marking, signs, and
signals; and (4) Navigation and control devises.
The pavements are the most important components of the transportation infrastructure assets. They can be considered as long-live assets that provides transportation of passengers and goods in an efficient and safe mode. In fact, the pavements are one of expensive assets that significantly depend on the non-renewable natural resources, aggregate and carbon-based energy carrier. There is a harsh pressure on the aggregate resources due to the fast development of the infrastructure assets. As an example, China flatted 700 mountains to build a city in 2012 [1]. Although crude oil price have been decreased recently, it should not affect the concept of green infrastructure asset. Therefore, it is necessary to find alternative materials, sustainable technologies that ease the pressure on the non-renewable natural resources for the pavement construction. Meanwhile, there is a wide range of pavement material alternatives that will give satisfactory service. The choice of pavement type and the alternative material is often made subjectively. It means that selection is usually a matter of the engineering skill, judgment and experience. Also, characterization of sustainability is important in design and construction of various pavement types. Technically speaking, there is no difference between a traditional and sustainable pavement structural design with and without energy saving and GHG emissions taken into account. The difference lies in the amount of energy saving due to use of various alternative materials and sustainable technology. To address this need, fuel requirement and GHG emissions are measured and compared for various concrete block pavements as selected CIA in this study. Also, an integrated system is defined as a tool for the sustainable/structural evaluation and comparison of various pavement type.
2. Material and Methods
By-product Materialslab was PG 64. Tables 1 and 2 show the binder properties and aggregate gradation, respectively. Asphalt mixture was produced at 130°C.
Table 1. Rheological properties of asphalt binders Aging State Material Property Value
Unaged (original state)
Viscosity at 135ºC (mPa.s) 465.0 G*/sin (δ) at 64ºC (kPa) 1.23 Short-term-aged G*/sin (δ)at 64ºC (kPa) 2.68 Long-term-aged G*sin (δ) at 25ºC (kPa) 2959
Table 2. Aggregate gradation for the asphalt concrete slab Aggregate size Percent Passing
100 100
14 90-100
10 67-86
5 50-62
3.35 40-54
1.18 18-34
0.425 12-24
0.15 6-12
0.75 4-8
Cement Concrete Base
Cement mortar (mixture of cement paste and sand) was chosen for base layer. Table 3 shows the property of the
Elastic modulus GPa
15% FA 20.16
30% FA 15.86
Traffic Loading
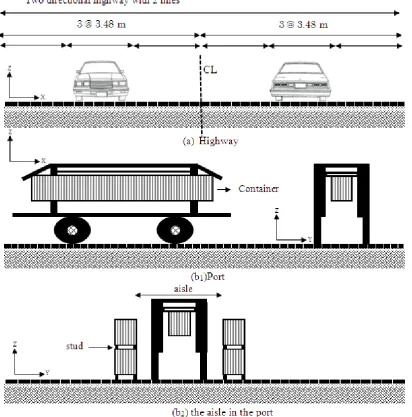
The pavements were designed for two applications: (1) highways; (2) ports. Traffic loading of the highway pavement was 1,000,000 equivalent standard axle load (ESAL) 8.2 ton (80 kN or 18 kips). For the highway pavement, a 10 km two directional highway was assumed that each line has three lanes or carriage way (width is 3.48 m). Figure 1(a) illustrates the schematically assumed highway pavement in this study.
Design vehicle for the pavement port is a straddle carrier with two axles with twin wheel (Figure 1(b1)). The tire
pressure is 0.9 MPa with 1,000,000 passes. The effects of the vehicle wander were also included in the structural design. The length of the track way or aisle in the port was 10m (Figure 1(b2)). The pavement is design for the laden
straddle carrier with 50% standard container 12m (40ft) and 6m (20 ft), i.e., 50% container 12m and 50% container 6m.
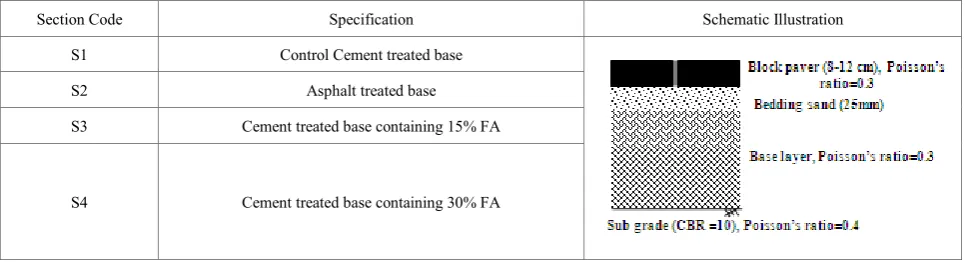
[image:2.595.59.297.276.502.2]Four prototypes of pavement section were chose for evaluation (Table 4). The paving layers is concrete block with various thicknesses (80, 100, and 120 mm). The elastic modulus of the block paver is 2,500 MPa. The block shape and laying pattern were rectangular and herringbone, respectively.
Table 4. Various pavement section
Section Code Specification Schematic Illustration
S1 Control Cement treated base
S2 Asphalt treated base S3 Cement treated base containing 15% FA
[image:2.595.64.547.558.689.2]Figure 1. Schematic illustration of the pavement section
Environmental Impact Assessment
The energy required to produce the cement, asphalt, and aggregate production was converted to the required amount of natural gas as an industrial fuel type. Amount of energy consumption for raw material production, asphalt and concrete placement were computed according to Zapata and Gombatese [2]. Conversion coefficient used for the natural gas was 0.02610824 cubic meter per mega Joule [3] and the conversion factors for GHG in terms of CO2, is 2.023 kg
CO2e/unit [4].
3. Result and Discussion
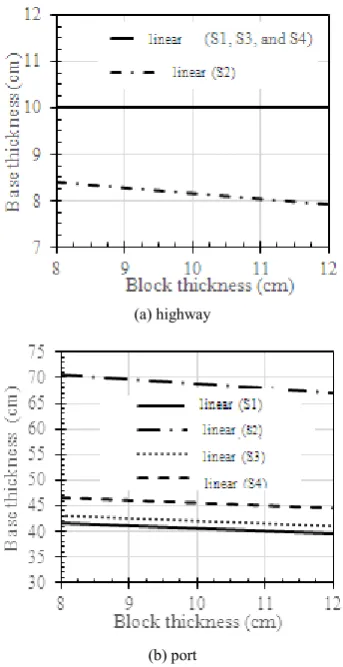
Figures 2 shows the required base thickness for the various pavement sections. Figure 2(a) clearly shows that required thickness for the asphalt slab (S2) is lower than those of concrete slab. As a result, the low thickness of the
[image:3.595.103.516.87.505.2](a) highway
[image:4.595.91.263.79.413.2](b) port
Figure 2. Required base thickness for the various concrete block pavement sections.
Figure 3 shows the amount of fuel consumption for the highway and port pavement constructions. Although less materials are consumed for S2 for the highway pavements due to lower thickness, fuel requirement is much higher than the other pavement sections for the highway (Figure 3 (a)). For example, S2 with block paver 80 cm requires 5.6×10⁷ m3 natural gas, while S1 as a control section
requires 2.8×10⁶ m3 with the same block thickness, which is
The lowest emission is for S4, however it needs thicker base layer in comparison with the other concrete base sections (S1 and S4). Therefore, the structural response of the concrete base for the highway pavement is equal, but their sustainable characteristics are different.
The same manner can be found in the port pavement section. Meanwhile, higher block thickness reduce fuel consumption, hence GHG emission, in the pavement construction. As an instance, S4 with 10 cm block requires 8.8×10⁶m3 fuel, 17.940 kton CO
2, but the corresponding
values are 8.6×10⁷m3 and 17.546 kton CO
2 for the same
section with 12 cm block.
In the other words, Figure 3 and Table 5 clearly show that S2 is significantly depend on the non-renewable natural resources, while S3 and S4 contains the by-product materials with higher strength, which resulted in thinner base. However, all the pavement section can withstand against 1,000,000 ESAL. So, structural response of the sections can be supposed equally. In contrast, their sustainable performance is different. As a result, an indicator is required to evaluate sustainability of the infrastructure assets with equal structural performance. To address this, the indicator is required to cover both structural and sustainability performances of a given assets. In this study, all the sections are able to withstand 1,000,000 ESAL; hence it is selected as a structural parameter. Meanwhile, amount of CO2 emission is selected
as parameter to measure sustainability.
[image:4.595.129.488.562.712.2]
[image:5.595.117.483.81.233.2]
S2 S1, S3, and S4
[image:5.595.333.528.264.460.2]Figure 3. Fuel requirement for the pavement construction
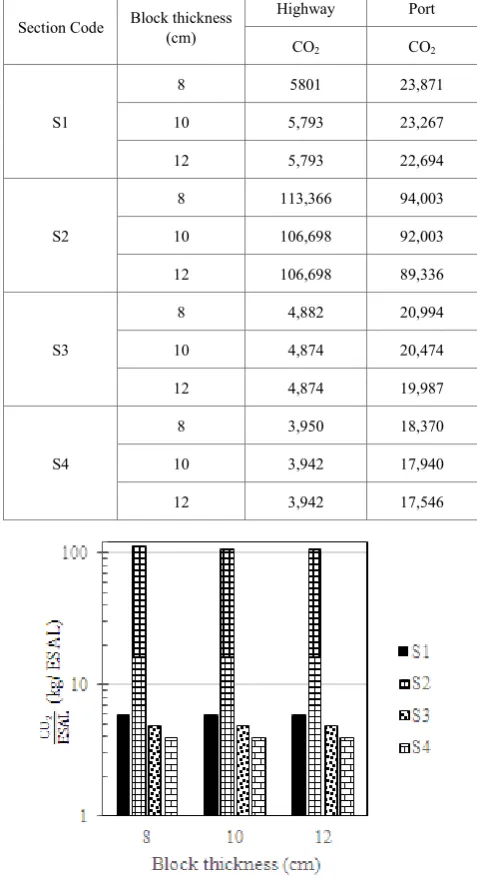
Table 5. GHG emissions (kilo ton) for various sections for highway
Section Code Block thickness (cm) Highway Port CO2 CO2
S1
8 5801 23,871
10 5,793 23,267
12 5,793 22,694
S2
8 113,366 94,003
10 106,698 92,003
12 106,698 89,336
S3
8 4,882 20,994
10 4,874 20,474
12 4,874 19,987
S4
8 3,950 18,370
10 3,942 17,940
12 3,942 17,546
(a) for the highway
(b) for the port
Figure 4. CO2
per traffic load ratios for various pavement sections
CO2 emission per ESAL is defined as a parameter that
considers both structural response and sustainability. It means that amount of CO2 emission for design of the
pavement that withstand for a given traffic loading (1,000,000 ESAL as traffic loading). When two highway pavement sections with various CO2
ESAL ratios are compared,
the higher ratio means more CO2 are emitted to construct
pavement that carries an equal traffic loading over the design life. Figure 4(a) shows CO2
ESAL ratios for the various
highway pavement sections. It can be seen that CO2
ESAL
ratios of S2 is significantly higher than those other pavement sections for both highway and port.
As an example, the ratio for S2 of highway pavement with 10 cm block is 106.69 that indicates 106.69 kg CO2 is
emitted for construction of a pavement to withstand 1 ESAL. In contrast, the corresponding ratio values for S1, S3, and S4 are 5.79, 4.87, and 3.94 kg CO2 per 1 ESAL
[image:5.595.57.296.284.723.2]4. Conclusions
Analysis of pavement sections showed that sustainability of pavement systems can be significantly different that depends on pavement application, material type, and amount of by-product material; however, their structural performance are equal. It means that the structural response of the concrete base incorporating the by-product materials, in terms of required thickness to withstand the traffic loading, is significantly depends on the pavement application. Moreover, the proposed indicator, showed that CO2 emissions of concrete base pavements per unit ESAL
( CO2
ESAL ) and unit pass of the design vehicle
( CO2
1 pass of the straddle carrier) were much lower than the
pavements with asphalt bases, irrespective of the block paver thicknesses. Therefore concrete bases incorporating FA can be proposed as an alternative with high sustainability and structural performance for base layer of highways. CO2
ESAL or CO2
1 Pass can be also used as an indicator
to develop an integrated system not only consider structural properties, but also cover emissions in the pavement construction as one of most important infrastructure assets.
REFERENCES
Uddin, W., Hudson, W.R., and Hass, R. (2013). Public [1]
Infrastructure Asset Management (second edition) McGraw-Hill Education, New York, United States. 2013. Zapata, P and Gambatese, J.A. Energy consumption of [2]
asphalt and reinforced concrete pavement materials and construction, J. Infra. Syst. ASCE, 11 (1), pp. 9–20. 2005. Häkkinen, T., and Mäkelä, K. Environmental adaptation of [3]
concrete; environmental impact of concrete and asphalt pavements. Technical Research Centre of Finland, Espoo, Finland.1996.
Department for Environment, Food and Rural Affairs [4]
(DEFRA), Guidelines to GHGs calculation, Version 1.2.1. 2010.
Interlocking Concrete Pavement Institute (ICPI). Structural [5]