Journal of Chemical and Pharmaceutical Research, 2014, 6(4):599-606
Research Article
CODEN(USA) : JCPRC5
ISSN : 0975-7384
Valorization of natural clay from agadir (Morocco):
Characterization and study of the isotherms adsorption of methylene blue
T. Ainane1,2, A. Abourriche1, M. Kabbaj2, M. Elkouali2, A. Bennamara1, M. Charrouf1 and M. Talbi2
1
Biomolecules and Organic Synthesis Laboratory, Faculty of Sciences Ben Msik, University Hassan II, Casablanca, Morocco
2
Laboratory of Analytical Chemistry and Physical Chemistry of Materials, Faculty of Sciences Ben Msik, University Hassan II, Casablanca, Morocco
_____________________________________________________________________________________________
ABSTRACT
Activated carbon is used for a long time as an adsorbent dyes, but it is expensive and ecological requirements imposed on manufacturers to seek new materials, cheaper, can replace the carbon. The clay materials abundant in Morocco, can be used as adsorbent, due to its physical and chemical characteristics and its specific surface well developed, it can be used in the treatment and disposal of toxic chemicals contained in contaminated effluents. This work has allowed us to study the adsorption of methylene blue on the natural clay, the latter was characterized by X-ray diffraction (XRD), X-ray fluorescence (XRF), and Fourier transform infrared (FTIR). A theoretical study of the adsorption has been made. It is difficult to clearly identify the binding reactions put into play when the solute is in contact with an adsorbent because the environment is complex and poorly defined. Resulting models provide a relationship between the concentration of a species in solution and the amount of that species adsorbed per unit weight of adsorbent. In this work, we conducted a study of adsorption isotherms, where we have used the theoretical models LANGMUIR and FREUNDLICH to explain the mechanism of binding of methylene blue on clay. From the values of maximum adsorption capacity and equilibrium constants, and the comparison of these values with previous work, the natural clay used in this study is effective in removing dyes.
Keywords: Adsorption, natural clay, mineralogical characterization, Methylene Blue, Insulated, modeling.
Abbreviations: C0: initial concentration, Ce: Equilibrium concentration, CR: Rating clay, FTIR: Fourier Transform Infrared, KF, and n:
FREUNDLICH parameters, m: Mass of clay, MB: Methylene Blue, q: adsorption capacity, qm,L, KL and RL: LANGMUIR parameters, R2:
Coefficient of correlation, T: temperature, V: Volume of the methylene blue solution, XRD: X-ray diffraction, XRF: X-Ray Fluorescence
_____________________________________________________________________________________________
INTRODUCTION
Morocco is a developing country that has many potential in industrial sector. One of the industries that grow finely is the textile industry.
Textile industry effluents exhibit large amounts of dye chemicals which create severe water pollution. Therefore, it is important to reduce the dye concentration in the wastewater before discharging it into the environment. Discharging large amounts of dyes into water resources, accompanied by organics, bleaches, and salts, can affect the physical and chemical properties of fresh water.[1]
Dyes in wastewater can obstruct light penetration and it is highly visible and unacceptable, which is not good to water life. Dyes are also stable to light irradiation and heat and toxic to microorganisms. The removal of dyes is stringent due to their complex structure and synthetic origins. [2]
as activated carbon, peat, chitin, clay, and others. [3] Adsorption is a process by which atoms, molecules or ions are retained on the surfaces of solids by chemical or physical bonding.
The presence of methylene blue (3,7-bis(Dimethylamino)-phenazathionium chloride tetramethylthionine chloride), an organic dye, in discharged water is hazardous for human beings and limits light diffusion and consequently the photosynthesis processes are reduced [4], [5] and [6]. Activated carbon is suitable for removing minor amounts of such organic dyes from aqueous solutions. Unfortunately, this effective adsorbent is expensive and has high regeneration cost. For these reasons, different studies have been carried out in order to find out inexpensive adsorbing materials. Thus, the adsorption capacities of some clay minerals (e.g. [7], [8] and [9]), agricultural residues (e.g. [10]) fly ash and mud [4] and [11] and other materials [12] and [13] were evaluated.
In the present work, the adsorption we performed tests of adsorption using methylene blue on a natural clay from morocco, it has been characterized by spectroscopic methods such as X-ray diffraction (XRD), X-ray fluorescence (XRF) and Infrared Fourier Transform Infrared (FTIR).
EXPERIMENTAL SECTION
Clay preparation and Characterization
Clay CR which is the subject of this study comes from Agadir Morocco (AZIAR community). This clay was crushed, ground, washed with distilled water and sieved to 40 µm in order to homogenize the clay fraction.
The next step, clay fraction has been characterized by spectroscopic methods such as X-ray fluorescence (XRF) to analyse the chemical composition or elements present in the sample using Axios Panalytical XRF spectrometer. X-ray diffraction (XRD) patterns of clay were obtained on a powder X-X-ray diffractometer Model Bruker D8. with CuKα radiation. And analysed for its vibrational spectra with the aid of Fourier transform infrared spectroscopy (FTIR) using Vertex 70 model instrument in the range 400 - 4000 cm–1 as potassium bromide pellet.
Sorption experiments and analytical method
All the experiments were conducted at a constant temperature of 25±1 °C and at a constant pH = 6.8 to be representative of environmentally relevant conditions. Batch equilibrium sorption experiments were carried out in 200mL Erlenmeyer flasks containing methylene blue solutions (75 mL) of known concentrations, which varied from 40 to 80 mg L−1. Known amounts of biomass were added to each flask and the mixtures were agitated on the rotary shaker.
After the sorption was reached, the change in methylene blue concentration due to sorption was determined colorimetrically (Shimadzu 1240 spectrophotometer), the absorbance was measured at wavelength (λ) 664 nm.
Methylene blue uptake capacities and sorption isotherm
The amount of methylene blue sorbed at equilibrium, q (mg.g−1), which represents the dye uptake, was calculated from the difference in dye concentration in the aqueous phase before and after adsorption, according to the following equation [14] :
C0 and Ce are the initial and equilibrium concentration of methylene blue in solution (mg.l −1
), respectively, and m is the mass of clay (g). where V is the volume of Methylene blue solution (L).
Freundlich adsorption model
The Freundlich model [15] habitually gives a better fit particularly for adsorption from liquids and can be expressed as:
In this model, the mechanism and the rate of adsorption are functions of the constants 1/n and KF (L.g−1). For a good adsorbent, 0.2 < n < 0.8, and a smaller value of n indicates better adsorption and formation of rather strong bond between the adsorbate and adsorbent. Many researchers have used this model to interpret their sorption data for various systems [16–19].
Langmuir adsorption model
The Langmuir adsorption isotherm [20,21] is given by the following equation:
Formula for linear expression can be written in the form:
In this model, qm,L (mg.g−1) is the amount of adsorption corresponding to complete monolayer coverage, i.e., the maximum adsorption capacity and KL (L.mg−1) is the Langmuir constant.
A host of research workers have applied this model to interpret their sorption data [16–19,22]. For Langmuir type adsorption process, to determine if the adsorption is favorable or not, a dimensionless separation factor is defined as [23]:
If RL > 1, the isotherm is unfavorable, RL = 1, the isotherm is linear, 0 < RL < 1, the isotherm is favorable, RL = 0, the isotherm is irreversible.
RESULTS AND DISCUSSION
Mineralogical characterization of clay CR
The analysis of our sample CR by X-ray Fluorescence (Table 1) reveals high percentages of SiO2 (48.92%) and Al2O3 (22.13%). MgO (7.05%) and CaO (12.51%) are present in relatively large an amount, which confirms the presence of carbonates. For cons, the contents of other elements such as K2O, Fe2O3, Na2O, TiO2, P2O5, SO3, SrO and Rb2O are quite low.
Table 1: Chemical analysis of clay CR by XRF.\
Chemical composition Weight (%) SiO2 48.92
Al2O3 22.13
CaO 12.51
MgO 7.05
K2O 2.92
Fe2O3 2.79
Na2O 0.58
TiO2 0.44
P2O5 0.14
SO3 0.09
SrO 0.02
Rb2O 0.01
that attributed to the Dolomite (d = 3.7341 A°, 2.8633 A°, 2.5465 A°, 2.4016 A°, 2.1986 A°, 2.0292 A°, 1.8084 A°, 1.7820 A°). There are other reflections are attributed to clay minerals: Kaolinite, Illite and Chlorite.
10 20 30 40 50 60
0 20 40 60 80 100
D D D D
C C C
Q Q
Q Q
Q I I
D Q C D DK K
Ch
K C
K K K K
Q
D C
Q I Ch
K
In
te
n
si
ty
[image:4.595.157.447.126.324.2]2θ
Fig. 1. XRD diffractogram of the sample CR
(Q: quartz; D: Dolomite C: Calcite, K: kaolinite, I: Illite, Ch: chlorite)
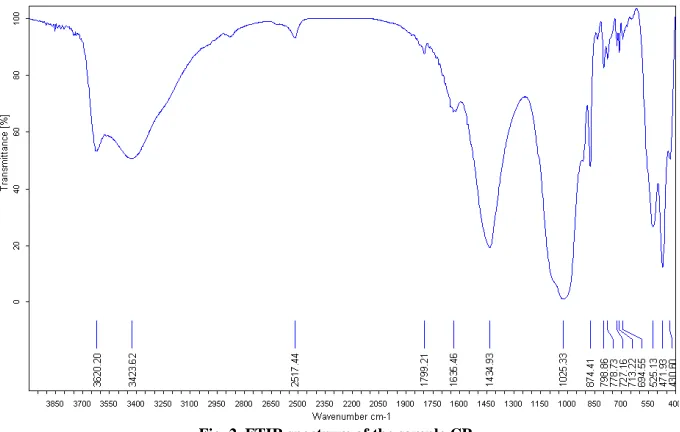
The last step is analysis of the sample CR by Infrared Fourier transform (Figure 2) shows that: The strips located at 1635 cm-1 and 3423 cm-1, respectively are characteristic vibration deformation and elongation of the OH groups of H2O. [25] The intense and broad band centered at 1025 cm
-1
[image:4.595.138.478.442.658.2]corresponds to the stretching vibrations of the Si - O in clay minerals. [25] bands located at 525 cm-1, 471 cm-1 and 430 cm-1 are assigned respectively to the deformation vibrations of Si - O - Al, Si - O - Mg and Si - O - Fe bands located at 3620 cm-1 and 3700 cm-1 are assigned respectively to the vibrations of Al - OH and Mg - OH. [25] The bands located at 727 cm-1, 874 cm-1 and 1434 cm-1 correspond to the vibrations of C - O bond in carbonates. [25]
Fig. 2. FTIR spectrum of the sample CR
Study of the adsorption of Methylene Blue by clay CR
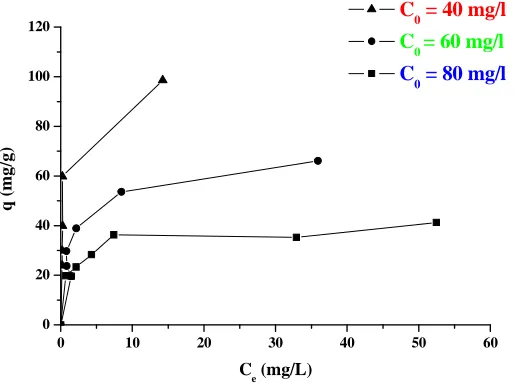
To determine the equilibrium isotherm of adsorption of Methylene Blue on the sample CR, we varied the masses of 0.05g to 0.3g of CR in a volume of 75 ml of Methylene Blue at initial concentrations C0 = 40, 60, 80 mg.L-1, and for a time sufficient to reach adsorption (2h).
We note from this curve, an increase of q as a function of the equilibrium concentration Ce, and when the initial concentrations of Methylene Blue increase, adsorption capacities of Methylene Blue decreases.
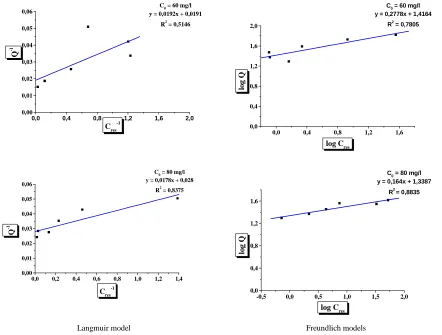
The experimental data of adsorption isotherms can be interpreted by the two models generally Langmuir and Freundlich who described previously. The modeling was performed by the linear representation of Ln qe according to Ln Ce for Langmuir model and the linear representation of 1/qe based 1/Ce for Freundlich model, the results for linear representations are displayed in Figure 4, and Table 2 lists the parameters of Langmuir and Freundlich obtained.
0 10 20 30 40 50 60
0 20 40 60 80 100
120 C0 = 40 mg/l
C0 = 60 mg/l
C0 = 80 mg/l
q
(
m
g
/g
)
[image:5.595.180.438.193.385.2]Ce (mg/L)
Fig. 3. Adsorption isotherms of Methylene Blue on the CR sample (T = 25 ° C, pH = 6.8)
Table 2. Isotherms model parameters for Methylene Blue Adsorption on CR sample
Modèles Paramètres C0 = 40 mg/l C0 = 60 mg/l C0 = 80 mg/l
LANGMUIR
Qm 113.636 52.356 35.714
KL 1.872 0.994 1.573
RL 0.013 0.0160 0.008
R2 55.23 51.46 83.75
FREUNDLICH
Kf 51.808 26.085 21.812
n 0.247 0.278 0.164 R2 65.48 78.05 88.35
0 1 2 3 4 5 6
0,00 0,01 0,02 0,03 0,04
0,05 C0 = 40 mg/l
y = 0,0047x + 0,0088 R2
= 0,5523
Q
-1
Cres -1
-1,0 -0,5 0,0 0,5 1,0 1,5 2,0
0,0 0,5 1,0 1,5 2,0 2,5
C0 = 40 mg/l y = 0,2469x + 1,7144
R2 = 0,6548
lo
g
Q
0,0 0,4 0,8 1,2 1,6 2,0 0,00 0,01 0,02 0,03 0,04 0,05 0,06
C0 = 60 mg/l
y = 0,0192x + 0,0191 R2 = 0,5146
Q
-1
Cres -1
0,0 0,4 0,8 1,2 1,6 0,0 0,4 0,8 1,2 1,6 2,0
C0 = 60 mg/l
y = 0,2778x + 1,4164 R2
= 0,7805
lo
g
Q
log Cres
0,0 0,2 0,4 0,6 0,8 1,0 1,2 1,4
0,00 0,01 0,02 0,03 0,04 0,05 0,06
C0 = 80 mg/l
y = 0,0178x + 0,028
R2
= 0,8375
Q
-1
Cres-1
-0,5 0,0 0,5 1,0 1,5 2,0 0,0
0,4 0,8 1,2 1,6
C0 = 80 mg/l
y = 0,164x + 1,3387 R2 = 0,8835
lo
g
Q
log Cres
[image:6.595.86.528.80.415.2]Langmuir model Freundlich models
Fig. 4. Linear representations the Langmuir and the Freundlich models
From the values of coefficients of determination R2, we can conclude that the Freundlich model is closest to the experimental results obtained in the adsorption isotherms, 65.48% for C0 = 40 mg / L, 78.05% for C0 = 60 mg / L, and 88.35% for C0 = 80 mg / L. We also note that all the coefficients "n" of this model are generally accepted, where 0.1 <n <0.5 meant that a good adsorption of methylene blue on clay CR.
0 20 40 60 80
0 20 40 60 80 100 120
C0 = 40 mg/L
C0 = 60 mg/L
C0 = 80 mg/L Langmuir Model q ( m g /g )
0 20 40 60 80 0
40 80 120
C0 = 40 mg/L
C
0 = 60 mg/L
C0 = 80 mg/L Freundlich Model
q
(
m
g
/g
)
[image:7.595.149.447.99.311.2]Ce (mg/L)
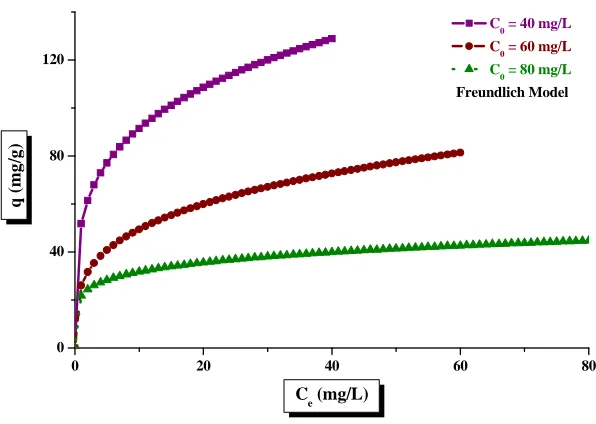
Fig.5. Modeling the adsorption of CR by methylene blue
The other Langmuir model also presents significant coefficient of determination R2 which requires to take into in the modeling performed, 55.23% for C0 = 40 mg / L, 51.46% for C0 = 60 mg / L, and 83.75% for C0 = 80 mg / L. Thus, all parameters tend to 0 which explains why the adsorption of methylene blue on clay CR is favorable.
To better demonstrate the effectiveness of these two models, we reported on Figure 5 Modeling of adsorption isotherms of methylene blue on clay CR.
To place the results we obtained in the adsorption of methylene blue on clay CR, we have shown in Table 3 the comparison of our results with those of the literature on the adsorption of methylene blue to other samples. From these values we can consider that the CR is a good clay adsorbent material.
Table 3. Sorption capacities for MB using different materials
Materials q (mg.g-1) Refs
Clay CR 40 - 100 Present study
Coir pith carbon 5.87 [26]
Spent coffee grounds 18.73 [27]
Tea waste 85.16 [28]
Garlic peel 82.64–142.86 [29]
Cedar sawdust 111.97 [30]
Dehydrated peanut hull 108.6–161.3 [31] Dehydrated wheat bran carbon 122.0–222.2 [32] Brazilian pine-fruit shell 185 [33] Sulphuric acid treated Brazilian pine-fruit shell 413 [33]
CONCLUSION
The chemical analysis XRD, XRF and FTIR show that clay is mainly constituted of alumina and silica in major quantities and iron, calcium, magnesium oxide and other elements in minor quantities. The loss on ignition value indicates that clay has lower carbonaceous matter and higher mineral matter contents. X-ray diffraction study shows the presence of Quartz, carbonates (Calcite and Dolomite), Kaolinite, Illite and Chlorite as major phases. The presences of above minerals were further confirmed by FTIR analysis.
[image:7.595.170.442.483.605.2]REFERENCES
[1] E Erdem; N Karapinar; R Donat. Journal of Colloid and Interface Science, 2004, 280, 309–314. [2] QH Hu; SZ Qiao; F Haghseresht. Industrial & Engineering Chemistry Research , 2006, 45,733-738. [3] SS Tahir; Naseem Rauf. Chemosphere, 2006, 63, 1842-1848.
[4] TA Albanis; DG Hela; TM Sakellarides; TG Danis. global nest international journal, 2000, 2(3), 237–244. [5] D Ghosh; KG Bhattacharyya. applied clay science, 2002, 20, 295–300.
[6] A Gürses; S Karaca; Ç Doğar; R Bayrak; M Açikyildiz; M Yalçin. Journal of Colloid and Interface Science ,2004, 269, 310–314.
[7] G McKay; G Ramprasad; P Mowli. Water Research, 1987, 2(3), 375–377 .
[8] M Hajjaji; S Kacim; A Alami; A El Bouadili; M El Mountassir. applied clay science, 2001, 20, 1–12. [9] G Atun; G Hisarli; WS Sheldrick; M Muhler. Journal of Colloid and Interface Science , 2003, 261, 32–39. [10] T Robinson; B Chandran; P Nigam. Bioresource Technology, 2002, 85 (2), 119–124.
[11] S Wang; Y Boyjoo; A Choueib; ZH Zhu. Water Research, 2005, 39, 129–138.
[12] MA Al-Ghouti; MAM Khraisheh; SJ Allen; MN Ahmad. Journal of Environmental Management, 2003, 69(3), 229–238.
[13] VK Garg; R Gupta; AB Yadav; R Kumar. Bioresource Technology, 2003, 89 (2), 121–124. [14] Y Nacera; B Aicha. Chemical Engineering Journal, 2006, 119, 121.
[15] H Freundlich. Zeitschrift für Physikalische Chemie , 1907, 57, 385–470.
[16] TVN Padmesh; K Vijayaraghavan; G Sekaran; M Velan. Chemical Engineering Journal, 2006, 122, 55–63. [17] S Kundu; AK Gupta. Chemical Engineering Journal, 2006, 122, 93–106.
[18] AK Golder; AN Samanta; S Ray. Chemical Engineering Journal, 2006, 107–115. [19] YS Ho; G McKay. Chemical Engineering Journal, 1998, 70, 115–124.
[20] I Langmuir. Journal of the American Chemical Society, 1916, 38, 2221–2295. [21] I Langmuir. Journal of the American Chemical Society, 1917, 39, 1848–1906.
[22] MAM Khraisheh; YS Al-Degs; WAM Mcminn. Chemical Engineering Journal, 2004, 99, 177–184.
[23] KR Hall; LC Eagleton; A Acrivos; T Vermeulen. Industrial & Engineering Chemistry Fundamentals, 1966, 5, 212–223.
[24] Joint Committee on powder diffraction standards. Selected Powder Diffraction Data for Minerals, 1st edition. Data book USA, 1974, 1190-1197.
[25] H M V Marel; H Bentelspacher. Elsevier Scientific Pub, 1976, 396. [26] O Hamdaoui. Journal of Hazardous Materials, 2006, 135, 264–273. [27] AS Franca; LS Oliveira; ME Ferreira. Desalination, 2009, 249, 267–272.
[28] MdT Uddin; MdA Islam; S Mahmud; Md Rukanuzzaman. Journal of Hazardous Materials, 2009, 53–60. [29] BH Hameed; AA Ahmad. Journal of Hazardous Materials, 2009, 164, 870–875.
[30] H Deng; G Li; H Yang; J Tang. Chemical Engineering Journal, 2010, 163, 373–381. [31] D Özer; G Dursun; A Özer. Journal of Hazardous Materials , 2007, 144, 171–179.
[32] B Royer; NF Cardoso; EC Lima; JCP Vaghetti; NM Simon; T Calvete; RC Veses. Journal of Hazardous Materials , 2009, 164, 1213–1222.