Journal of Chemical and Pharmaceutical Research, 2017, 9(4):165-170
Research Article
CODEN(USA) : JCPRC5
ISSN : 0975-7384
165
Characterization of the Quality of the Polluting Load of an Industrial Zone
Merimi I
1*, Oudda H
1, El Ouadi Y
2, El Hajjaji F
3and Hammouti B
21Laboratory of Separation Processes, Université Ibn Tofail, Faculté des Sciences, Kenitra, Morocco 2
Laboratoire de chimie analytique appliquée, matériaux et environnement (LC2AME), Faculté des Sciences, Oujda, Morocco
3Laboratoire d'Ingénierie des Matériaux, Modélisatio n et Environnement, Faculté des Sciences Dhar El
Mahraz, Université Allal Ben Abdellah, Atlas, Fès, Morocco
_____________________________________________________________________________
ABSTRACT
Our study focused on the characterization of effluents from industrial production of carbonated beverages (soft drinks) in order to measure the amount of polluted material entering the water supply. We analyzed the effluent's physical and chemical characteristics (pH, temperature, and conductivity) as pollution indicators (biological oxygen demand over five days [BOD5] and chemical oxygen demand [COD]). Daily sampling was done on liquid effluents and analyzed in the monitoring station laboratory in order to detect variations in entrance and the exit station water. The analysis of wastewater shows a high organic load, which requires treatment before any direct discharge into the environment or before it can be reused.
Keywords:Industrial pollution; Wastewater; pH; Conductivity; COD; BOD5
_____________________________________________________________________________
INTRODUCTION
Mild Environmental protection requires special attention with respect to industrial activities which, because of the manufacturing processes and transformation of the raw material to finished products, uses large quantities of water and generates diverse types of pollutants. Wastewater has heterogeneous composition, some of which may be toxic in nature, thus contributing to the degradation of ecosystems by introducing polluting substances into the water/environment. Industrial and domestic effluents constitute sources of pollution which can cause irreparable environmental damage [1-3]. If industrialization has the purpose of satisfying the growing needs of populations, it should not, however, be the source of pollution to this population’s surrounding environment. The present study was aimed at analyzing the physicochemical characteristics of industrial liquid effluents in order to assess the effluent pollution load with the intention of promoting safe environmental practices for eliminating wastewater.
MATERIALS AND METHODS
Presentation of the Zone of Study
A treatment plant for wastewater treatment produced during the course of carbonated beverage production was installed. The wastewater can then be rerouted via pipe to the water purification station in common Oujda, Morocco. All wastewater produced during production is collected into a container of power, and during the course of corresponding pretreatment (separation of solid substances) is then added to homogenization container (reservoir of balance and mixer). The wastewater is then buffered, homogenized, and neutralized in the homogenization container.
Description and Operation of the Station
166
Separation of solid substances Rotating screens
Homogenization container Heat exchangers
Anaerobic sludge bed processor Post-aerobic
Chemical compounds dosing station
Processor control system with visualization and screen control
Pumping Container
The wastewater resulting from production is first sent to the pumping container. At the level of the entrance to the pumping container, wastewater crosses a screen. The screen first separates large solid substances such as glass pieces. The pumping container also temporarily stores the wastewater. The wastewater is then directed from the pumping container to the screen with the help of two redundant, submerged centrifugal pumps in the reservoir. The container is equipped with a device to measure the level of continuous filling and a probe to monitor overflow.
Screens Rotating
After separation of solid substances in the rotating sieve, the waste water flows by gravity directly into the homogenization vessel. Solid and crude substances >1 mm are separated in the rotating sieve and disposed of into the carriage sludge.
Homogenization Container
The wastewater without solid substances is pumped according to the water level in the pumping container by the centrifugal pumps and rerouted to the homogenization container. The centrifugal pumps work in conjunction with each other. The capacity of the homogenization container rises to 350 m³ in half a day and corresponds to a volume of wastewater of 700 m³ a day. The container is equipped with a probe to measure the level of continuous filling and to monitor overflow. The wastewater is stored in the homogenizing container and homogenized using an agitator. Pre-acidification of the wastewater organic components occurs first. The organic substances present in the wastewater are hydrolyzed and acidified in order to facilitate their subsequent degradation in the downstream anaerobic reactor. Hydrolysis of the organic substances results in the formation of organic acids that cause a pH decrease in the wastewater. The pH of the wastewater is permanently monitored by a pH meter installed in the reservoir. This meter is equipped with a combined temperature and pH sensor. The pH can be regulated automatically with by addition of a caustic soda or sulphuric acid. The reservoir works at a 50% filling level. Wastewater goes out of the homogenization container and is directed via both centrifugal pumps to the anaerobic reactor. The side towards the anaerobic reactor anaerobic is the area of filling for the homogenization container. The level is maintained at 50%, and the centrifugal pumps are regulated in a corresponding manner. The wastewater pH must be approximately 6.5. In the case of many pH fluctuations, wastewater cannot be directed to the reactor without first undergoing neutralization.
Anaerobic Reactor
Wastewater exits the homogenization container and is directed through the group of pumps to the anaerobic reactor. Before arriving in the reactor, wastewater is brought to a temperature of 35°C, which is the optimum working temperature for anaerobic treatment in the two heat exchangers. The first heat exchanger produces hot water with the flow of the anaerobic reactor. The wastewater is brought to approximately 30°C. The second heat exchanger is used to raise the temperature of the wastewater to the operating temperature of the anaerobic reactor (35°C). This increase is obtained by heating the water to produce a biodegradable gas (biogas). The target temperature is monitored and can be adjusted. The anaerobic treatment takes place in the reactor with the help of bacterial acetogens and methanogens (biosludge). These bacteria degrade the organic components of wastewater in the biogas. The biogas consists essentially of a mixture of methane and carbon dioxide (CO2).
167
tank is variable, and differences in power are obtained during recirculation, thus guaranteeing a constant speed for optimal flow. The wastewater is taken from the upper part of the reactor and is flows freely into the degasser, which serves to facilitate the desorption of CO2 in the wastewater. In the process of generating a
counter-current, wastewater moves from the top to the bottom under the degasser, while at the same time, air is blown in the degasser by the fan and that the latter circulates from the bottom to the top. The filling container, which is located in the degasser, allows for an optimal distribution of wastewater. This last step simplifies the desorption of CO2. CO2 in the wastewater is thus expelled/desorbed, and the pH increases. The wastewater is
redirected via the pump in the flow of power to the aerobic reactor. The gas compartment at the head of the reactor is equipped with a pressure safety valve and a probe. A valve to regulate the flame is installed between the anaerobic reactor and biogas container to control vaporization of the gas with the flame. This last device aims at protecting the gas compartment from igniting in the presence of the flame.
Aerobic Reactor
Sludge-and gas-free wastewater flow freely out of the anaerobic reactor into the pumping container and then are directed into the aerobic reactor via the redundant pumps and the heat exchangers. The aerobic treatment of wastewater occurs in the aerobic reactor. The reactor is ventilated on a regular basis by an intermediate aeration system mounted to the ground. The aeration is carried out via two air compressors. The air introduced in the reactors is essentially an extract of the reactor. In addition, the outgoing air from the tanks is also drawn into and rerouted to the aerobic reactors. The compressors are monitored by an O2 probe installed in the reservoir, which
helps to maintain a constant O2 content. The reactor is also equipped with a device for pH and temperature
measurements. The pH value may, if necessary, be adjusted with either caustic soda or sulfuric acid. The aerobic reactors operate by batch processing. A reactor is then filled with treated wastewater in the anaerobic reactor, while the other reactor is aerated or emptied. The wastewater leaves the aerobic reactors and flows freely into the pipe via a special settling system. The flow is then constantly monitored and recorded.
Dosage Station Chemicals
Solutions of caustic soda and sulfuric acid are necessary for pH adjustment. This solution is made available by the dosage station. All chemicals are stored in 1000 liter maximum dosing reservoirs. These are prepared on containers collectors that may receive the entire volume of the tanks in case of a leak.
All collection receptacles are equipped with sensors for leak detection, which automatically triggers an alarm in case of a leak. The chemicals are extracted from the dosage containers with the help of the dosing pumps and are rerouted to the processing container via suction pipes equipped with level detectors set at empty or almost empty. The flocculant is automatically added in the flocculant station.
Biogas Dryer
Biogas must be dried to allow its thermal recovery. The temperature of the biogas surpasses approximately 40°C to reach its dew point in the dryer. The resulting moisture condenses and may be converted by the trap to condensation. After the conversion to biogas, the gas is subject to thermal recovery using a biogas compressor adjusted to the proper pressure for recovery.
Biogas Flame
If no levy of the biogas in the thermal recovery is possible on a temporary basis, the biogas is securely burned by a fully-set automatic flame. The flame works with a cover so that no interference in the flame's environment occurs. The flame is controlled by the pressure between the gas and anaerobic reactor compartments. The flame is monitored constantly. If no flame appears after the process of ignition, the gas supply is automatically interrupted via rapid closing of the valve.
Heating
The biogas resulting from the anaerobic process is used in the heating. The water is heated to a temperature up to 80°C. The hot water is used for the heating of the wastewater, which is directed to the anaerobic reactor.
Methods
168
RESULTS AND DISCUSSION
Temperature
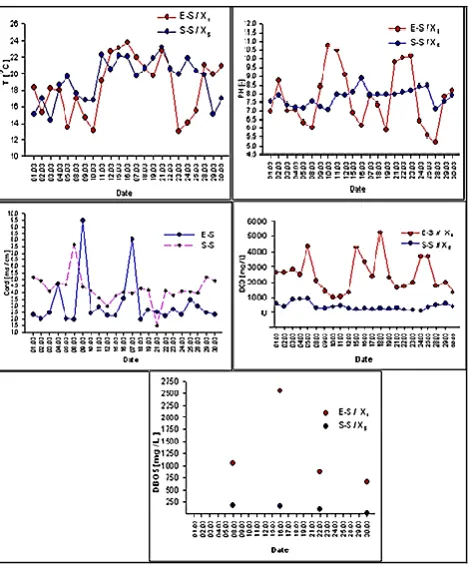
According to the results obtained in Figure 1a, the entry station during the month of March 2014 averaged a temperature of 18.55°C, and we noted a slight variation in temperature during this month. This was mainly due to the treatment water. This temperature variation is due in some cases to exergonic reactions related to the addition of acid and soda during the treatment, and in other cases it is due to the use of water-heated material. Temperature fluctuations are related to local climate conditions and more particularly to air temperature and water evaporation. These characteristics are as stressed [4]. However, a rise in temperature is accompanied by a density modification that decreases when the temperature increases, leading to a reduction in viscosity [5-7], an increase in the saturation vapor pressure at the surface (evaporation), and a decrease in gas (oxygen) solubility. The temperature increase favors the development of micro-organisms which consume oxygen, leading to a reduction in dissolved oxygen content. It can be inferred in our case that the temperature was exclusively linked to time and not to variations in sampling stations [8-11].
pH Potential
pH is an important element in defining water characteristics. According to the results obtained in the Figure 1b, during the month of March, an average pH value of 7.75 confirms that the effluent was slightly alkaline, but this value did not exceed the value allowed by the Moroccan standards of direct discharge, which is 8.51.
The pH indicates the alkalinity of the wastewater, and its role is crucial in microorganism growth, which generally has an optimum pH growth range from 6.5 to 7.5. When the pH < 5 or > 8.5, microorganism growth is directly affected. In addition, the pH is an important element for pipe corrosion in the purification facilities. pH variations may be an important variable in the water and basin functions.
Conductivity
Provides information on the degree of mineralization of waters and their salinity Salinity [12] is proportional to conductivity; it depends on the temperature, concentration, and types of ions present [13,14]. The results obtained in the conductivity average of the effluent were 3.13 ms/cm, which exceeds the standards as indicated in Figure 1c. The electrical conductivity shows significant difference on comparison of industrial area with respect to residential, rural and commercial areas [15].
[image:4.595.141.454.577.661.2]This result can be explained by the fact that the wastewater is very rich in minerals and reflects the nature of the cleaning solutions added to water (sodium hydroxide, nitric acid) at the time of the sanitation process. It also has other salts from the regeneration of water softeners located upstream of the purification plant. The increase in water salinity has a direct effect on flora and aquatic life, which is manifested by migration and wildlife mortality. Indeed, a very high osmotic pressure can cause in the diffusion phenomena through the cell walls and sometimes death of the corresponding cells in fish gills and other external bodies. Beyond 3000 μs/cm, unfavorable conditions for a normal ecological balance occur, which reflects moderate to strong pollution. There are several pollution parameters that can be measured. Industrial effluent causes a considerable increase in the organic load in the receiving environment. The result is a variable O2 consumption, which is reflected by variations in both BOD5 and COD. These two parameters are the main indicators of organic pollution and allow an indirect measure of the overall load polluting load of the effluent. Figure 1d and Table 1 of the DCO show that the average value of the chemical O2 demand is 2490.04 mg/L.
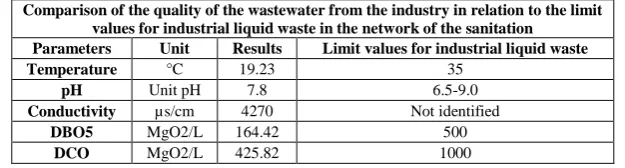
Table 1: Standard of the general limit values of the industrial liquid rejections in the network of the sanitation
Comparison of the quality of the wastewater from the industry in relation to the limit values for industrial liquid waste in the network of the sanitation
Parameters Unit Results Limit values for industrial liquid waste
Temperature °C 19.23 35
pH Unit pH 7.8 6.5-9.0
Conductivity µs/cm 4270 Not identified
DBO5 MgO2/L 164.42 500
DCO MgO2/L 425.82 1000
This value is particularly high at the entrance of the station. This is due to the variability of the composition of the effluent, and 425.82 mg/L O2 for the treated waters at the outflow station. The rate of yield is 79.52%. The
169
[image:5.595.181.416.115.400.2]1e, Table 1 with a yield of 83%. Corresponding to a performance of cleansing is very high. It points out that there is an important elimination of organic matter. The results obtained in Table 1 show that several physicochemical and pollution parameters are not elevated and do not exceed the standard values for industrial liquid effluent.
Figure 1:The results of the analyzes of the physicochemical parameters and the parameters of pollution as a function of time: temperature, pH, chemical demand and biological oxygen (COD, BOD5) at the inlet and the outlet of the basin (E-S and S-S); (a) T;
(b) pH; (c) conductivity during the month of March
CONCLUSION
It can be concluded that treatment by use of anaerobic environment supports the degradation of organic matter by anaerobic bacteria with the conditions necessary to complete their reactions in the absence of O2. We have
calculated the means of the results of analysis and their yields and then compared them with the standards for general discharge limits for industrial wastewater. It was found that our parameters met the standards of rejection, which allowed us to conclude that the station works well in general and appears to be effective during the first year of operation.
REFERENCES
[1] Hadj Sadok MZ. Modélisation et estimation dans les bioéacteurs; prise en compte des incertitudes: application au traitement de l'eau (Doctoral dissertation), 1999.
[2] J Steyer. Modelisation, Commande et Diagnostic des procédés biologiques de dépollution. Habilitation à Diriger des Recherches, Laboratoire de Biotechnologie–INRA, Narbonne, France. 1998.
[3] I Queinnec. Contribution à la commande de procédés biotechnologiques: application au traitement biologique de la pollution (Doctoral dissertation, Université Paul Sabatier-Toulouse III), 2000.
[4] Semroud R. Thèse de troisième siècle USTH. Alger, 1983, 137.
[5] R Desjardins. Le traitement des eaux. Presses inter Polytechnique; 1997.
[6] M Franceschi. Contribution à l'étude des mécanismes de coagulation-floculation. Modélisation de la phase de floculation. Etude de la morphologie des agrégats formés (Doctoral dissertation), 1991. [7] FF Peng; P Di. J Colloid Interf Sci, 1994, 164(1), 229-237.
[8] Y Mabrouki ; AF Taybi; H Bensaad; A Berrahou. J Mater Eviron Sci. 2016, 7(1), 231-243. [9] JL Potelon; K Zysman. J Mater Eviron Sci. 2016, 7(1), 231-243.
[10] A Chahlaoui. Etude hydrobiologique de l'Oued Boufekrane (Meknès): Impact sur l'environnement et la santé, 1996.
170
[12] A Nahli; N Sakhraoui; S Hebabase; C Hmimidi; C Brand; M Chlaida. J Mater Eviron Sci. 2016, 7(1), 40-49.
[13] JD Hem. Study and interpretation of the chemical characteristics of natural water. US Government Printing Office; 1959.
[14] IC El Fehri; A El Abidi; M Fekhaoui; A Bellaouchou; R El Jaoudi; S Abdelkader. Physical and chemical parameters of groundwater area agricultural sidi abdelrrazak (province of khemisset).