2016 International Congress on Computation Algorithms in Engineering (ICCAE 2016) ISBN: 978-1-60595-386-1
1 INTRODUCTION
It was put up clearly that we should establish the most strict water resources management, carry out “Three Systems” of boosting the total water and water use efficiency and limiting pollutant in water function area by Decision of the CPC Central Committee and State Council on Accelerating the Development of Water Reform (Zhong Fa [2011], short for No. 1 Document) and Views of the State Council on the Implementation of the Strictest Water Resources Management System. The red control line of water consumption efficiency was pointed out by No.1 Document that water con-sumption of ten thousand GDP and ten thousand yuan of industrial added value would be significantly lower, and the efficient utilization coefficient about the irri-gation water would increase to more than 0.55 by 2020. In order to implement the strictest water man-agement system, it was requested by No.1 Document that the responsibilities and the appraisal system of water resource management should be established, and
this document also put out clearly that the mainly local governments above the county level was overall re-sponsible for water resources management and protec-tion of the administrative district. According to the spirit of the No.1 Document, water consumption of ten thousand yuan industrial added value is an evaluation index of red control line which can measure the man-agement level of industrial water efficiency [1]. At present, the safeguard measures to implement the most strict water resources management system are imple-mented one by one, and the practices of many areas have provided a working basis for the three red lines’ index assessment [2-4], such as the Gansu Main Points for Compiling Water Efficiency Control Index and Assessment System of Cities (states) and Counties in Gansu Province and the water use efficiency assess-ment of qualitative index and quantitative index for area, industry, agriculture and life which is put for-ward by the government of Yunnan Province. From the domestic and foreign related research, the existing research results are mostly focused on the establish-ment of industrial water use efficiency evaluation index system, index calculation and the index value
Application Study on Industrial Water Efficiency Evaluation by
First-Order Directory Sampling
GeMeng1, YuanfengQiu2*, Yinghua Liu3, Tian Tian1 & SenZhao1
1
School of Resource and Civil Engineering, Wuhan Institute of Technology, Wuhan, Hubei, China 2
School of Water Resource and Hydropower Engineering, Wuhan University, Wuhan, Hubei, China 3
Wuhan Institute of Design and Sciences, Wuhan, Hubei, China
ABSTRACT: In the implementation process of the strictest water resources management system, based on the sampling survey method which is characterized with low cost and high efficiency, the first-order directory sam-pling method is designed to test one area value’s truth of water consumption of ten thousand yuan industrial added value which is reported by itself and, water consumption of ten thousand yuan industrial added value is a red control line evaluation index which can measure the management level of industrial water efficiency. From the first-order directory sampling application process and the results in above-scale industry of Hubei Province, it is tested that the first-order directory sampling can evaluate the index of water consumption efficiency with high accuracy and, this method is easy and low-cost. If it is applied to the practical evaluation, the result of inspection can reflect the real and comprehensive industrial water efficiency. Then the most strict water resources manage-ment system can be promoted and implemanage-mented.
Keywords: first-order directory sampling; industrial water efficiency; evaluation; water consumption of ten thousand yuan industrial added value
[5-8]
. But there is no uniform evaluation methods for mastering the local economic and social status of wa-ter use to provide reliable wawa-ter efficiency information for the national economic and social development, especially few literatures on expand in detail for the truth degree of the index value of the efficiency of water use assessment methods, for example, the cen-tral People's Government issues an control target on a province that ten thousand yuan of industrial added value of the amount of water averagely decreases by 5% annually. A year later, the local People's Government reports figures showing that the target which has been completed that the thousand yuan of industrial added value of water consumption is decreased by 5%, so whether the data submitted is true is the focus of as-sessment and it can be verified by a sample survey in the industrial enterprises of this area. In the assess-ment process, as the number of industrial enterprises in assessed area is sizable, surveying all industrial enterprises will make the problems of excessive sam-ple calculation cumbersome, heave investigative workload and high cost of assessment [9, 10]. Then the problems may lead to assessment work can’t be smooth and efficient. Therefore, in the assessment, the sampling survey method can be used in the regional water industrial enterprises to verify the truth degree of the index value of the efficiency. Sampling investi-gation is a kind of comprehensive investiinvesti-gation, it only selects part units to investigate, and then esti-mates the characteristics of whole investigated objects. Although sampling investigation is not full-scale in-vestigation, it aims to obtain information that can re-flect the overall situation and play the role of a com-prehensive investigation. Its basic characteristics are low-cost and high-efficiency [11]. Many specific meth-ods can be used in the sample survey, such as first-order directory sampling, two-stage catalogue sampling, cluster sampling, etc. In the course of the study, first-order directory sampling, two-stage cata-logue sampling and representative sampling were designed for water efficiency assessment. But from the test results in Hubei Province, the process of two-stage catalogue sampling was complex and the sampling ratio was so high that could lead high oper-ating costs. Although the sampling ratio of representa-tive sampling was relarepresenta-tively small and the calculation was simple, investigators should make comprehensive and subjective judgments in advance. The calculation of first-order directory sampling was simple, the in-vestigation cost was low and the workload was suita-ble. So the first-order directory sampling was consid-ered for water use efficiency assessment.
2 IDEAS AND METHODS
2.1 General idea
Considering the representative, key water
consump-tion industrial enterprises can be chosen and assessed firstly in the assessment and, a sample survey is con-ducted only among the key water consumption indus-trial enterprises [12]. Through checking the water bal-ance tests of key enterprise and reviewing measure-ment records and production in many ways, the au-thenticity of the reported data about assessed area can be judged.
First, calculating the water consumption of the area ten thousand yuan industrial added value based on reported control red line indicator data of assessed area in specific assessment process:
Y Z =
X (1)
Among them, Z is water consumption of ten thou-sand yuan industrial added value of the assessed area (m3/104 yuan), Y is the total industrial water consump-tion of the assessed area (m3) and X is the total indus-trial added value (104 yuan).
When calculating total industrial added value data, use the statistics data of the People's Government of the assessed area and water resources departments verified the authenticity of water consumption data by a sample survey around the water consumption data which is reported by the People's Government of the assessed area. In the application, determine the sample points in the key water consumption industrial enter-prises at first, and then investigate and verify sample business data to calculate the estimated value of water consumption of ten thousand yuan of industrialZˆ, and
then Zˆ will be compared with Z. If the error is within a certain range, the water consumption efficiency index value of the red control line which is reported by the assessed local Government of the People can be considered as a true value and can further determine whether the water use efficiency index value achieves the desired goals. It shows from the application of the first-order directory sampling survey in above-scale industrial in Hubei Province that the review of water consumption data is easy; using first-order catalog sample survey to estimate the ten thousand yuan of industrial added value of water consumption can meet the accuracy requirements; the sample size is small; job cost and workload are appropriate.
2.2 Methods
2.2.1 Sampling frame
The scope of the sampling frame was the key water consumption industrial enterprises in the assessed area. The sampling frame content should include the basic properties of indicators, the basic value terms, and water consumption indicators.
2.2.2 Enterprises layered
enter-prises in the tested area by industrial output value, sales revenue or water consumption. Every tested area can make flexible hierarchical number and hierar-chical boundaries, the key water consumption indus-trial enterprises can be generally divided into 3-6 lay-ers.
(2) Layer by industry categories.
2.2.3 Sample size and distribution (1) The sample size is calculated as follows:
H h kh kh k k H h kh kh k S N t Y r S N n 1 2 2 2 1 = (2) Among them: 2 1 1 2 11
Nkh kh
i N i kh khi khi kh kh N Y Y N
S (3)
Among them, h is layer (h=1, 2,…, H), and H is the number of total layers of all key water consumption industrial enterprises in the tested area. Yk is the total
water consumption of these industrial enterprises, and Ykhi stands for the total water consumption of the i-th
enterprise in the layer h. Nkh is the number of total
industrial enterprise these in the layer h, and nk stands
for the number of total enterprises in the sample. 2
kh
S
is the variance of water total consumption of these enterprises in the layer h, rk is the maximum relative
mistake, and t is the probability level of assurance [13]. Here, these data that are used in sample size calcula-tion all are reported data from the related area.
(2) Distribution of sample
The number of total enterprises in the sample nk
which is calculated above and adjusted can be distrib-uted by the Neyman allocation method. The formula [13]
for calculating the layer h sample size nkh is:
H h kh kh kh kh k kh S N S N n n 1 (4)2.2.4 Samples selection
It is mainly considered two methods in layering a sample, one is symmetrical systematic sampling and the other is simple random sampling method. Consid-ering specific circumstances of the assessed area, and one of these methods can be chosen.
2.2.5 Estimator
When calculate various estimators, the sample size nk
and nkh are the actual number of the sample enterprises
that are surveyed, and the total number of enterprises Nk and Nkh is adjusted number of enterprises based on
the actual situation. Water consumption data of the sample enterprises is the data of assessment survey [13]: (1) The water consumption estimator of all key wa-ter consumption industrial enwa-terprises in the tested area is shown as follows:
H h H h n i khi kh kh kh k kh Y n N Y Y1 1 1
ˆ
ˆ (5)
(2)
k
Yˆ 's variance estimator is:
kh kh H h kh kh kh k n s n N N Y v 2 1 ) ( ) ˆ (
(6) Among them:
nkh
i
kh khi kh
kh Y Y
n s 1 2 2 ) ˆ ( ) 1 ( 1
, (7)
nkh
i khi kh kh Y n Y 1 1 ˆ (8)
(3)
Y
ˆ
k's maximum relative error is:ˆ ) ˆ ( k k k Y Y v t
r (9)
(4) Water consumption estimator of ten thousand yuan industrial added value of the tested area is:
k k X
Y
Zˆ ˆ (10)
Here,
k
Yˆ is estimated value of total water
con-sumption of all key water concon-sumption industrial en-terprises. Xk is total added value of all key water
con-sumption industrial enterprises.
3 SIMULATED EXPERIMENT
Hu-bei Provincial Bureau of Statistics data were compared to determine the authenticity of the statistics. Then it can be determined whether the above-scale industrial water efficiency indicators can be done, and the feasi-bility that the first-order directory sampling survey methodology is used in the assessment of industrial water use efficiency can be tested.
3.1 Survey object and scope
According to the data from Hubei Provincial Bureau of Statistics, there are 14,959 above-scale industrial enterprises whose income are up to or over 5 million yuan in Hubei Province. If make all the above-scale industrial enterprises as the survey population, it will be huge workload and will cause high-cost work. In order to make the cost of the work and the workload balance and make calculations can reflect results of actual situation of the industrial water use efficiency in the assessed area, we choose 1% of enterprises of the overall above-scale industrial enterprises as key water consumption industrial enterprises. These enter-prises that are chosen often use large amount of water can create great added value, or their water consump-tion change rate is irregular. Ultimately, we select 166 industrial enterprises as key water consumption indus-trial enterprises. (Due to the enterprises’ technical secret, the enterprises’ name and detailed data in this article will not be listed.) According to statistics, these 166 industrial enterprises covering 35 industry catego-ries, accounting for 90% of total industry categories; the total water consumption is 2,418,506,983.00m3, accounting for 53% of the total industrial added value of 33,590,374.76×104 yuan according to the propor-tion of total water regulapropor-tions and accounting for 55% of the value added of above-scale industrial enterpris-es.
3.2 Selecting and extracting the sample points
Layer 166 key industrial enterprises by the amount of water consumption, and then take the methods of symmetrical and systematic sampling to take samples. The sampling precision is set to probability level of assurance t = 95% and the maximum relative error l r ≤ 10%.
(1) Divide layers
Arrange 166 key water consumption industrial en-terprises from small to big according to water con-sumption, and 30 enterprises are regarded as one layer, so divide these 166 key water consumption industrial enterprises into six layers. Layer 6 which has the highest water consumption only contains 16 enter-prises. Hierarchical information is shown in Table 1.
Then, according to the stratification, calculate the sample variance of every layer, the calculated results are showed in Table 2.
Calculate the sample size according to the formula 2:
2 6
kh kh h =1 k 2
6 2 k k
kh kh h -1
N S
n = = 17
r Y
+ N S
t
To achieve sampling accuracy which has been set, it needs to extract at least 17 enterprises as sample.
(2) Distribute sample sizes
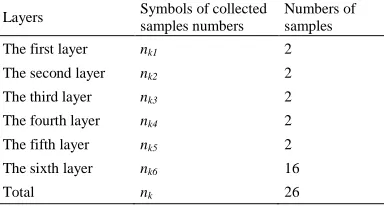
[image:4.516.267.375.58.108.2]Distribute sample size among the layers by Neyman allocation method and ensure that at least on enter-prise is drawn in one layer, the total number of sample enterprises that has been adjusted is 26, and the sam-ple number of every layer is shown in Table 3.
Table 1. Hierarchical information in First-order directory sampling.
Layer
The number of enterprises of this layer
Water consumption distribution (m3) of enterprises
The first layer 30 1.20×10³~5.62×10⁴
The second layer 30 5.68×10⁴~2.16×10⁵
The third layer 30 2.17×10⁵~5.20×10⁵
The fourth layer 30 6.30×10⁵~1.63×10⁶
The fifth layer 30 1.65×10⁶~1.31×10⁷
[image:4.516.266.462.226.332.2]The sixth layer 16 1.58×10⁷~7.57×10⁹
Table 2. Layer’s sample variance in first-order directory sampling.
Layers Sample variance
symbols Sample variance (m
3)
The first layer S2 3.54×10⁸
The second layer S2 2.28×10⁹
The third layer S2 8.23×10⁹
The fourth layer S2 8.76×10¹⁰
The fifth layer S2 1.51×10¹³
The sixth layer S2 3.80×10¹⁶
Table 3. First-order directory sampling layers of the distribution of sample number.
Layers Symbols of collected
samples numbers
Numbers of samples
The first layer nk1 2
The second layer nk2 2
The third layer nk3 2
The fourth layer nk4 2
The fifth layer nk5 2
The sixth layer nk6 16
Total nk 26
4 RESULT ANALYSIS
4.1 Sampling survey statistical data analysis
[image:4.516.268.460.486.589.2]added value and total water consumption in 2014, and then calculate the overall water consumption of ten thousand yuan industrial added value in key water consumption industrial enterprises in 2014.
72.00 6
33590374.7 .00 2418506983 X
Y
Z (m3/104 yuan)
Where Z is the water consumption of ten thousand yuan industrial added value in key water consumption industrial enterprises in Hubei Province in 2014, Yis the overall water consumption in key water consump-tion industrial enterprises in Hubei Province in 2014, and X is the total industrial added value in key water consumption industrial enterprises in Hubei Province in 2014.
Based on statistics, the water consumption of ten thousand Yuan industrial added value in all above-scale industrial enterprises in Hubei Province in 2014 is 74.42m3/104 yuan. Compare 72.00m3/104 yuan with 74.42m3/104 yuan, the difference is only 2.42m3/104 yuan. So the conclusion can be drawn that the results can reflect the actual situation of above-scale industrial water use efficiency in Hubei Province from the sample survey of these 166 key water consumption industrial enterprises.
4.2 Calculating overall estimate
Determine the water use data of the sample enterprises in 2014 by inspecting, analyzing, summarizing and balancing their water consumption metering, monitor-ing and recordmonitor-ing, and back steppmonitor-ing water consump-tion according to its producconsump-tion and water quotas, and then calculate the estimator of the key industrial water of above-scale industrial enterprises in Hubei Province in 2014, according to the survey data:
6
1 6
1 1
ˆ ˆ
h h n i
khi kh kh kh k
kh
Y n N Y
Y =2.4753×10⁹ (m3/104 yuan)
The estimator of sample variance is:
) ˆ (Yk
v =9.21×10¹⁴(m3/104 yuan)
The water consumption of ten thousand yuan indus-trial added value in above-scale key water consump-tion industrial enterprises is estimated:
k k
X Y
Zˆ ˆ 73.69
6 33590374.7
.00
2475342405
(m3/104 yuan)
Here, Z is the estimator of water consumption of ten thousand yuan industrial added value in above-scale key water consumption industrial enter-prises in Hubei Province in 2014,
k
Y is the estimator
of overall water consumption in above-scale key water consumption industrial enterprises in Hubei Province
in 2014, and Xk is the total industrial added value of
above-scale key water consumption industrial enter-prises in Hubei Province in 2014.
4.3 Analysis on errors and confidence intervals
Infer water consumption of above-scale key water consumption industrial enterprise under the probabil-ity of degree t = 1.96 and within the 95% of confi-dence interval:
) ˆ ( ˆ )
ˆ ( ˆ
k k k k
k tvY Y Y tvY
Y
So water consumption of ten thousand yuan indus-trial added value in above-scale key water consump-tion industrial enterprises will meet:
Zˆ-1.96*
<Z<Z
ˆ
+1.96*
, Which the average error
=0.90,That is,71.92Z75.46
The water consumption of ten thousand yuan indus-trial added value in above-scale key water consump-tion industrial enterprises is 72m3/104 yuan according to the reported statistical value by various enterprises within the range of 71.92Z75.46, so the reported statistic is true. Then assume that the controlled objec-tive of the above-scale industrial water use efficiency is 76m3/104 yuan or less in Hubei Province in 2014, a conclusion can be obtained that the controlled objec-tives of the above-scale industrial water use efficiency in Hubei Province in 2014 have been achieved.
5 CONCLUSION
department to promote the most strict water resources management system implementation.
REFERENCES
[1] Chen lei. 2015. Implement the strictest water resources management system to guarantee the economic and so-cial sustainable development. China Water Resources, (5): 9-17.
[2] Wang Ende. 2014. Water resources utilization efficiency preliminary evaluation of Liaoning along Bohai region.
Environmental Science and Management, 30(5): 16-18. [3] Deng Hongbing & Liu Tianxing. 2014. On utilization
ef-ficiency of water resources in China based on production function. Advances in Science and Technology of Water Resources, 30(5):16-18.
[4] Lu Lei. 2008. Research on industrial water efficiency of Zhejiang province, Hangzhou: Zhejiang University. [5] Sun Yufei, Wang Jianping & Wang Xiaojuan. 2014.
Some viewpoints about ‘the three red line’ index system.
Water Resources Development Research, (8): 62-65. [6] Bai Ying, Wang Hongrui & Xue Xinyi, et al. 2014.
Rel-evant issues on utilization efficiency and evaluation methods for water resources. Journal of Economics of Water Resources, 28(3): 1-4.
[7] Alsharif, K., Feroz, EH. & Klemer, A, et al. 2008. Gov-ernance of Water Supply Systems in the Palestinian Ter-ritories: A data envelopment analysis approach to the management of water resources. Journal of Environ-mental Management, 87(1): 80-94.
[8] Arup Mitra. 1999. Agglomeration economies as mani-fested in technical efficiency at the firm level. Journal of Urban Economics, 4(4): 490-500.
[9] The First National Water Resources Survey Leading Group Office of the State Council of China. 2014. The first national water resources survey overall scheme.
China Water Resources, (22): 11-27.
[10] Rogers P., SilaR., Bhatia R. 2002. Water is an economic good: How to use price to promote equity, efficiency and sustainability. Water Policy, (4): l-17.
[11] Zhao Junkang. 2002. Sampling Design Theory and Method in Statistical Investigation. Beijing: China Sta-tistics Publishing House, pp: 36+230.
[12] Sun Debin, Wang Zhiwei & Jia Guoqing, et al. 2008. The sampling method study for industrial below-scale enterprises. Statistics and Consultation, (4): 10-11. [13] Enterprise Survey Group of National Bureau of Statistics