Injury Risk Estimation Expertise Assessing the ACL Injury Risk Estimation Quiz
8
0
0
Full text
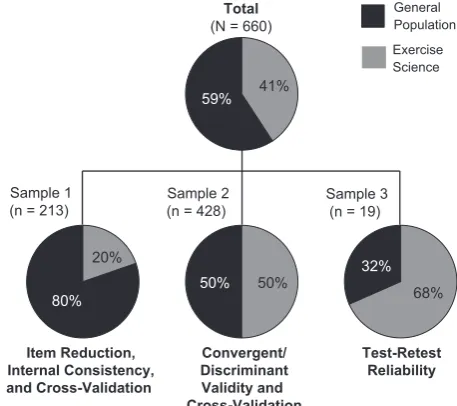
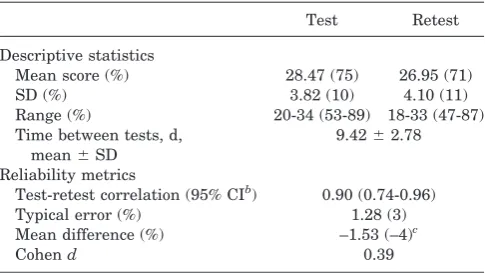
Figure


Related documents