Nanoscale
crystallinity modulates cell proliferation on plasma
sprayed surfaces
Alan M Smith
2, Jennifer Z Paxton
1, Yi-Pei Hung
1, Martin J Hadley
1, James
Bowen
1, Richard L Williams and Liam M Grover
1*1
School of Chemical Engineering, University of Birmingham, Edgbaston, B15 2TT, UK
2
School of Applied Sciences, University of Huddersfield, Huddersfield, HD1 3DH, UK
*author to whom all correspondence should be addressed
Email: [email protected]
Tel: +44 121 414 3887
Fax: +44 121 414 5324
Abstract
Calcium phosphate coatings have been applied to the surface of metallic prostheses to mediate
hard and soft tissue attachment for more than 40 years. Most coatings are formed of high purity
hydroxyapatite, and coating methods are often designed to produce highly crystalline surfaces. It
is likely however, that coatings of lower crystallinity can facilitate more rapid tissue attachment
since the surface will exhibit a higher specific surface area and will be considerably more
reactive than a comparable highly crystalline surface. Here we test this hypothesis by growing a
population of MC3T3 osteoblast-like cells on the surface of two types of hip prosthesis with
similar composition, but with differing crystallinity. The surfaces with lower crystallinity
facilitated more rapid cell attachment and increased proliferation rate, despite having a less
heterogeneous surface topography. This work highlights that the influence of the crystallinity of
HA at the nano-scale is dominant over macro-scale topography for cell adhesion and growth.
Furthermore, crystallinity could be easily adjusted by without compromising coating purity.
These findings could facilitate designing novel coated calcium phosphate surfaces that more
1. Introduction
Hydroxyapatite (HA) is the main mineral constituent of bone comprising almost 70 wt% of the
mass of our skeleton. Since HA is relatively simple to synthesise using both wet chemical and
reactive sintering routes, it has been widely investigated for use as a bone graft replacement [1,
2, 3]. The osteoconductive nature of the HA also means that it has found significant use as
coating on metallic implants, where it can facilitate the attachment of both hard and soft tissues
and allow firm attachment of the prosthesis in vivo [4].
There are a multitude of methods that have been employed to coat metallic prostheses with HA,
which have recently been reviewed in detail [5]. The majority of clinically available prostheses,
however, are coated using a high temperature plasma in which the HA is ‘melted’ before
deposition on the implant surface [6]. It is possible to adjust the composition and crystallinity of
the deposited coating however, by varying gas phase, atmospheric pressure and anode current.
The use of high energy coating conditions can result in a considerable reduction in crystallinity
[7], which may be coupled with the deposition of impurity phases within the coating. These
impurities may include tetracalcium phosphate (Ca4(PO4)3O), calcium oxide (CaO), amorphous
calcium phosphate (ACP; CaxHy(PO4)z.nH2O), β-tricalcium phosphate (β-TCP; Ca3(PO4)2) and
oxyapatite (Ca10(PO4)6O) [8, 9]. The formation of these phases within the implant coating has
been shown to result in the accelerated localised dissolution of the coating [10]. Numerous
workers have striven to eradicate the formation of these impurity phases from the coating [8, 9,
10]. As a consequence, the majority of commercially available calcium phosphate coatings are
formed from highly crystalline HA. Although easy to characterise using X-ray diffraction and
required by some standards, one might expect that the high crystallinity and low solubility of the
attachment. Other materials which facilitate bone attachment, such as bioglass, are thought to
form an intimate adhesion with bone through the dissolution of their surface and their subsequent
re-precipitation in surrounding tissues [11]. While undoubtedly the localised dissolution of
highly basic phases such as TTCP and CaO could have a deleterious biological reaction and so
their formation should be avoided, it would seem surprising that more products are not based
around the other more soluble calcium salts (ACP, oxyapatite etc.) that may facilitate this
process.
In this study, the attachment of MC3T3 cells to the surface of two compositionally identical
commercially available hydroxyapatite coated prostheses of distinct crystallinity has been
investigated. The topography of both coatings was characterised using scanning electron
microscopy and white light interferometry. Quantification of the crystallinity of the coatings was
performed using X-ray diffraction and crystallite size was estimated from the XRD data using
the Scherrer equation, while coating crystallinity was further varied by adjusting the anodic
current during the coating process. In addition, elemental composition of the coatings was
investigated using X-ray Fluorescence spectroscopy (XRF).
2. Materials and Methods
2.1 Preparation of prostheses
Two types of carbonated hydroxyapatite coated hip prosthesis with similar composition but
contrasting crystallinities were sourced directly from manufacturers (JRI; Depuy). Both types of
prosthesis were sectioned using a diamond saw in order to produce samples of appropriate
autoclaved for sterilisation. From here on, the prostheses will be referred to as group A (lower
crystallinity) and group B (higher crystallinity).
2.2 Cell culture and attachment to prostheses
To evaluate cell attachment to each prosthesis coating, MC3T3 cells (European collection of cell
cultures - ECACC) were defrosted and seeded into T150 flasks with Dulbecco’s minimum
essential medium (D-MEM) containing 10w/v% foetal bovine serum. After they reached
confluency (approximately two days), the cells were removed from the surface of the culture
flask using trypsin-EDTA, were redispersed in medium at a cell density of 4.05 ×10⁵ cells per
mL and were then passaged 3 times prior to surface seeding. Sterilised (by autoclave and UV
radiation) surfaces were seeded with MC3T3 cells at a density of 1 ×10⁵ cells per sample. The
number of cells on the surface of the implants were counted on days 1, 9, and 21 and compared
with the control (tissue culture plastic). For counting, the live cells were stained using Calcein (a
fluorescent green stain which only stains live cells) and were then visualised using a fluorescence
microscope. At least five areas of the surface were imaged and then fluorescent cells counted
within the field (1 mm2), and the average cell number per unit area of the surface was
subsequently calculated. The data were collected for at least three samples in each sample set,
making each result the average of 45 measurements.
2.3 SEM images
The surface morphologies of the coatings were evaluated using scanning electron microscopy.
The unembedded prostheses were mounted on aluminium stubs using carbon tape. The surface
Following preparation, images were captured using a scanning electron microscope at an
accelerating voltage of 10 kV. The embedded samples were examined using a scanning electron
microscope forming an image using back scattered electrons, these images were used to
determine the thickness of the implant coatings. The samples were unsputtered and charging
was prevented by painting the sample surfaces using silver dag adhesive paint.
2.4 Interferometry
In order to enable quantitative characterisation of the topography of the calcium phosphate
coatings, interferometric measurements of samples were performed using a MicroXAM
interferometer (Scantron, UK), operating using a white light source. Samples were imaged at
31X magnification, acquiring images in a grid array which were subsequently stitched together.
The final image had dimensions of 3.64mm x 2.71mm. Scanning Probe Image Processor
software (Image Metrology, Denmark) was employed for the analysis of acquired images,
yielding Sa and Sq values for surface roughness.
2.5 X-ray diffraction analysis
To characterise the crystalline component of the coating, the coating was carefully removed from
the surface of the implant using a razor blade and X-Ray Diffraction measurements were carried
out on the resulting powder using a Bruker D8 diffractometer, arranged in transmission mode
using Cu Kα1 radiation (ƛ = 1.5406Å) between 5o
and 80o 2-θ, with a step size of 0.0197o and a
step time of 0.2secs. The collected patterns were compared with JCPDS patterns for HA and any
impurity phases likely to be found within the coating. The crystallinity of the coatings were
compared by determining the area under the diffraction pattern for a strong peak indicative of the
powder was given a value of 100. It should be noted that this gives a relative and not absolute
measurement of crystallinity. To evaluate the influence of process conditions on crystallinity, the
coatings were deposited using vacuum plasma spraying and the anodic current was varied
between 400-700 A. Crystallite size was estimated from the XRD data using the Scherrer
equation:
eqn. 1
where λ is the wavelength of the monochromatic X-ray beam (λ = 0.15406nm for CuKα
radiation), FWHM is the full width at half maximum of the diffraction peak under analysis
[radians] and θ is the Bragg angle at which the peak is located. Diffraction peaks at 2θ = 25.784°
{002} and 2θ = 32.981° {300}, which correspond to the c- and a- axes of the HA crystal lattice,
respectively. These peaks were chosen due their isolation from the other diffraction peaks
(enabling a more reliable estimation of crystallite size) and as they represent the major axes of
HA crystal growth. Fraction of crystalline phase, Xc, was estimated using the following equation:
eqn. 2
where V112/300 is the intensity minimum between the {112} and {300} diffraction peaks of HA,
and I300 is the intensity of the {300} diffraction peak of HA.
To identify the elemental composition of the coatings X-ray Fluorescence spectroscopy (XRF)
was carried out using a S8 TIGER XRF spectrometer (Bruker Corp., U.S.A). Samples were
prepared as described for the X-Ray Diffraction measurements.
2.7 Statistical analysis
The data were expressed as the mean ± the standard deviation and analysed using Primer for
biostatistics software. For the analysis of the cell attachment data one way analysis of variance
(ANOVA) was used with a post hoc Tukey (HSD) test to identify significant differences at a
confidence limit of P < 0.01.
3. Results
3.1 Cell culture and attachment to prostheses
When seeded onto the surface of the prostheses, cell attachment was noted within one day of
seeding on each of the surfaces investigated (Figure 1). The cells exhibited morphology typical
of osteoblasts with an approximate diameter of 20 µm. At day one, the cells attached to the
surface of Group A exhibited a polygonal morphology and those attached to the surface of the
tissue culture plastic (Control) and Group B demonstrated a more spindle-like structure. As
culture time increased, the morphologies of the cells on each surface exhibited a more polygonal
morphology. Another major difference between the two test samples was the larger number of
cells attached to Group A following day 1 of the study (Figure 1). When the number of cells on
the prostheses and tissue culture plastic were quantified, the number of cells found per mm2 of
the material was significantly higher (p<0.01) for Group A (420 ± 135 cells) than for Group B
there was no significant difference between the number of cells on the surfaces and beyond this
time-point, in the case of all groups there was a steady reduction in the number of cells found on
the surface of the samples. After 21 days of attachment, regions of Group A seemed devoid of
cells, suggesting that the cell culture had reached confluence resulting in cell death which was
not apparent in Group B (Figure 1).
3.2 Prostheses topography
Since the attachment of cells to implant surface can be influenced by topographical variation, the
topography of the coated samples was determined by means of scanning electron microscopy
(SEM) and white light interferometry. At the highest level of magnification, each coating
exhibited a similar structure with the presence of submicrometer irregularly shaped particles
(Figure 2), although some more plate-like crystals were observable within the Group B coating.
At lower levels of magnification, the coating on the surface of Group B seems marginally more
pitted and irregular than the Group A coating, however, this is difficult to quantify using only
scanning electron microscopy. Further characterisation of the surface coating was therefore
undertaken using interferometry. From visual inspection of the surface profiles generated using
the laser profilometer, the Group B coating appeared to be most irregular, although this is hard to
quantify simply by inspection of Figure 3a. Quantitative analysis of the surface profiles
demonstrated that there was virtually no differences between the surface area roughness (Sa)
values for the samples (Figure 3b), with the Group A coating exhibiting an Sa of 11.94 ± 0.83
µm and the Group B coating an Sa of 11.78 ± 6.2 µm. The large standard deviation of the group
B coating however is indicative of a more heterogeneous surface topography. This would
Since the contrast in early stage cell attachment cannot be explained by surface topography, the
coated surfaces were further characterised with respect to their compositions, since composition
is also known to have a significant influence on cell attachment.
3.3 X-ray diffraction and X-ray Fluorescence
The crystalline compositions of the calcium phosphate coatings were determined using X-ray
diffraction. Both Groups A and B resulted in the formation of diffraction patterns that displayed
the main peaks for hydroxyapatite, both with the presence of no crystalline impurity phases
(Figure 4). Although the principle peaks for each of the coatings occurred in similar positions on
the diffraction patterns, the morphology of the peaks collected from Group A and Group B
contrasted significantly. The diffraction pattern collected from Group A contained significantly
broader and less intense peaks than those found on the diffraction pattern for samples from
Group B. The broader and less intense peaks both suggest that the calcium phosphate coating
that was found on the surface of Group A was of lower crystallinity than that found on the Group
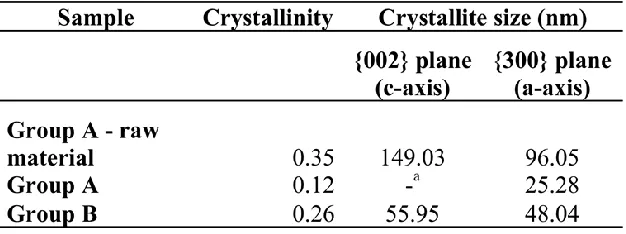
B. This was verified by estimating the crystalline fraction of the coatings along with the
crystallite size (Table 1), which showed that the crystals of Group A were smaller in both the c-
and a-axes compared to Group B (in fact the {002} peak of Group A was too weak to permit a
reliable estimation of crystallite size along this plane. In addition to reduced crystallite size,
Group A was also found to have a lower crystalline fraction compared to Group B. As the
crystallinity of the two coatings was the only significant difference between the coatings that
could explain enhanced cell attachment of Group A, efforts were made to further reduce coating
crystallinity by changing process parameters. Samples were therefore formed using the
feedstock used for Group A but with anodic coating currents of 400, 500, 600 and 700 A. The
increased anodic potential resulted in a monotonic reduction in crystallinity (Figure 6).
Importantly, although crystallinity was reduced by up to 60% (when compared with the raw
powder) there was no detectable presence of impurity phases within the coated surface. This was
further supported by the elemental analysis performed using XRF which detected Ca, P, low
levels of Mg (which is typical in calcium phosphate coatings) and Ti (from underlying metallic
surface) (Table 2).
4. Discussion
Despite previous efforts to produce HA coatings of extremely high purity and crystallinity [8, 9,
10,], there has recently been a realisation that the production of coatings which are comparable
with the nanocrystalline HA found in the body could have significant benefits [12]. The higher
specific surface area of nanocrystalline HA compared with microcrystalline HA means that the
attachment of cell adhesive proteins and the localised dissolution of coating can be significantly
increased [13, 14]. Consequently, a number of workers have sought to develop methods
whereby metallic surfaces may be coated with HA based coatings without the need for heating,
which can result in significant crystal growth. For example, authors have reported the
production of coatings alternate dipping, ‘biomimetic’ precipitation [15] and even electrolysis
[16]. All of these methods can be undertaken in almost ambient conditions. Although a number
of workers have investigated the influence of processing on the crystallinity and purity of
calcium phosphate salts [17, 18, 19], to date there has been relatively little work on the effect that
In this study, initial cell attachment and proliferation occurred more rapidly on Group A than on
the Group B prosthesis. Systematic investigation of parameters known to influence cell
attachment, such as topography and crystallinity, revealed that Group B had a more
heterogeneous surface topography compared with Group A whilst the coating on Group A was of
lower crystallinity. This suggests that purity and nanostructure of HA coated implant is the
dominant factor over the surface topography for initial cell attachment. The mechanism of
enhanced initial cell attachment and proliferation on the surface of the Group A prosthesis could
be as a result of two or more complimentary factors both related to the specific surface area
exhibited by the HA coating. It is well established that cells attach to proteins adsorbed onto the
surface of materials [20]. The higher specific surface area exhibited by the Group A coating
would have resulted in an increase in the quantity of protein adsorbed onto the surface and
therefore may have stimulated greater cell attachment. The higher specific surface area of the
material could also have resulted in the more rapid dissolution of the calcium phosphate coating
on immersion in culture medium [14]. This dissolution would have resulted in an increase in the
local concentration of calcium, a factor that is known to mediate the attachment of
osteoblast-like cells to surfaces. This mechanism has also been shown to expedite the attachment of a range
of cells to materials such as bioglass [21] and silicon substituted hydroxyapatite monoliths [22].
While a number of researchers have reported the formation of nanocrystalline coatings using
processes at room temperature [13, 14, 15], relatively few have sought to tailor crystallinity to
enhance cell attachment using a high temperature plasma. It is well established that introducing
more energy into the system results in amorphisation of the calcium phosphate droplets [23], but
this has previously been treated as an unwanted phenomenon, and most studies have sought ways
surface. We have demonstrated that it is possible to adjust crystallinity in a monotonic manner
with increasing anodic potential, without jeopardising the purity of the final coating and
compromising biological activity.
5. Conclusion
Here we have shown that nanoscale crystallinity of HA based coatings is the dominant factor
over the macroscale topography for initial cell adhesion and cell growth. We have also
demonstrated that it is possible to adjust coating crystallinity by making small changes to
processing, without compromising coating purity. It is possible that the findings of this study
will be of utility in designing novel coated calcium phosphate surfaces that more rapidly bond to
bone following implantation.
References
[1] Ohgushi H, Okumura M, Yoshikawa T, Inoue K, Senpuku N, Tamai S, Shors EC. Bone formation process in porous calcium carbonate and hydroxyapatite. J Biomed Mater Res. 1992;26:885-895.
[2] Hannouche D, Petite H, Sedel L. Current trends in the enhancement of fracture healing J Bone Joint Surg Br. 2001;83:157-164.
[3] Bauer TW, Muschler GF. Bone graft materials. An overview of the basic science. Clin Orthop Relat Res. 2000;371:10-27.
[4] Kroon PO, Freeman MAR. Hydroxyapatite coating of hip prostheses: effect on migration into the femur J Bone Joint Surg Br. 1992;74:518-522.
[5] Desmet T, Morent R, De Geyter N, Leys C, Schacht E, Dubruel P. Nonthermal Plasma Technology as a Versatile Strategy for Polymeric Biomaterials Surface Modification: A Review Biomacromolecules. 2009;10:2351-2378.
[7] Pálka V, Poštrková E, Koerten HK. Some characteristics of hydroxylapatite powder particles after plasma spraying Biomaterials. 1998;19:1763-1772
[8] Yang C-W, Lee T-M, Lui T-S, Chang E. A comparison of the microstructural feature and bonding strength of plasma-sprayed hydroxyapatite coatings with hydrothermal and vacuum post-heat treatment Mater Trans. 2005;46:709-715.
[9] Wang BC, Chang E, Lee TM, Yang CY. Changes in phases and crystallinity of plasma-sprayed hydroxyapatite coatings under heat treatment: A quantitative study. J Biomed Mater Res. 1995;29:1483–1492.
[10] Gross KA, Berndt CC. Thermal processing of hydroxyapatite for coating production J Biomed Mater Res.1998;39:580–587.
[11] Zhong JP, Greenspan DC, Feng JW. A microstructural examination of apatite induced by Bioglass® in vitro J Mater Sci: Mater Med. 2002;13:321-326.
[12] Sato M, Asiani A, Sambito MA, Kalkhoran N.M, Slamovich EB, Webster TJ.
Nanocrystalline hydroxyapatite/titania coatings on titanium improves osteoblast adhesion. J Biomed Mater Res. 2008;84A:265-272.
[13] Balasundarm G, Sato M, Webster TJ. Using hydroxyapatite nanoparticles decreased crystallinity to promote osteoblast adhesion similar to functionalising with RGD. Biomaterials 2006;27:2798-2805.
[14] Sum L, Berndt CC, Khor KA, Cheang HN, Gross KA. Surface characteristics and dissolution behavior of plasma-sprayed hydroxyapatite coating. J Biomed Mater Res A. 2002;62:228-236.
[15] Habibovic P, Barrere F, Van Bitterswijk CA, de Groot K, Layrolle P. Direct formation of nanophase hydroxyapatite on cathodically polarised electrodes. J Am Ceram Soc. 2002;85:517-522.
[16] Shirkhanzadeh M. Biomimetic hydroxyapatite coating on metal implants. J Mater Sci Mater Med. 1998;9:67-72.
[17] Salimi MN, Bridson RH, Grover LM, Leeke GA. Effect of processing conditions on the formation of hydroxyapatite nanoparticles. Powder Technol. 2011;218:109-118.
[18] Murray MGS, Wang J, Ponton CB, Marquis PM. An improvement in processing of hydroxyapatite ceramics. J Mat Sci. 1995;30:3061-3074.
[20] Howlett CR, Evans MDM, Walsh WR, Johnson G, Steele JG. Mechanisms of initial
attachment of cells derived from human bone to commonly used prosthetic materials during cell culture Biomaterials, 1994;15:213-222.
[21] Cao W, Hench LL. Bioactive materials Ceram Int. 1996;22:493-507.
[22] Botelho CM, Brooks RA, Best SM, Lopes MA, Santos JD, Rushton N, Bonfield W. Human osteoblast response to silicon substituted hydroxyapatite. J Biomed Mater Res A. 2006;79A:723-730.
[23] Guipont V, Espanol M, Borit F, Llorca-Isern N, Jeandin M, Khor KA, Cheang P. High-pressure plasma spraying of hydroxyapatite powders Mat Sci and Eng A 2002;325:9-18.
Figure Captions
Figure 1. A population of cells attached to coated surfaces and tissue culture plastic and stained
using Calcein AM.
Figure 2. Scanning electron micrographs of the surface of the calcium phosphate coatings on
group A and B prostheses.
Figure 3. a.) White light interferometry images showing the surface topography of the calcium
phosphate coatings on Group A and B prostheses and b.) the mean Sa values of each sample
group.
Figure 4. X-ray diffraction patterns of coatings removed from the coated metallic prostheses.
The coating removed from Group A samples was of lower crystallinity than that removed from
Group B. Miller indices of the major diffraction peaks of HA are also presented.
Figure 5. A typical diffraction pattern indicating the presence of no crystalline impurity phases
.
Figure 6. The reduction in crystallinity of the coating applied to group B with varying anodic
current.
Table Captions
Table 1. Crystallite size and fraction of crystalline phase of the three implant coatings estimated
from the XRD data using equations 1 and 2, respectively. aPeak too weak to be fully identified
from the background.
Table 1.
[image:20.612.149.462.109.226.2]