2017 2nd International Conference on Communications, Information Management and Network Security (CIMNS 2017) ISBN: 978-1-60595-498-1
Multi-Layer, Multi-Dimensional and Multi-Granularity
Network Model to Measure Network Security
Xiao-lin ZHAO
1,*, Yi-man ZHANG
1, Hang YA
1,
Xian-hua ZHANG
2and Yi-ning YANG
11
School of Software, Beijing Institute of Technology, Beijing 100081, China
2
Beijing Aerospace Control Center, Beijing 100094, China
*Corresponding author
Keywords: Network security, Multi-layer, Multi-dimensional, Multi-granularity, Measurement.
Abstract. Recently, network security is more and more important and the network security measure is the premise to build a robust and secure network. However, the methods of measuring the network security are limited. For example, the most methods are not comprehensive, which only consider a part of the network ignoring the overall network. Therefore, this paper proposes a new multi-layer, multi-dimensional and multi-granularity network model based on the attack graph and CVSS. The model divides the network into four layers. The four layers can measure the network security completely and effectively. For each layer, two dimensions are quantified. The measure value of each layer is rated score 0-10. In addition, this model takes the different network granularities into account, making the network security model more comprehensive. In order to examine the validity of the network model, this paper carries out two experiments by configuring five networks with different security configurations. It is found that this model not only can identify the network security level effectively but also can quickly locate the security problems.
Introduction
Network Security and Network Evaluation
Nowadays, people can’t live without the Internet. For example, bank account management and bank payment are transferred to the Internet. However, there are many network attacks resulting from hiding sensitive data in the Internet. Up to now, many problems of network security have been caused by the destructive network attacks. Therefore, it is very urgent to build a secure network. The first step to build a secure network is to evaluate the existing network condition. Therefore, it is more important to evaluate network security effectively.
The evaluation of the network should be comprehensive instead of only considering a part of the entire network. Moreover, the measurement of a single network node is not effective and useful. Therefore, for network security, on the one hand, the connection between the hosts should be measured; on the other hand, the resource of the hosts also should be concerned. Besides, network evaluation should consider the vulnerabilities in the network. In addition, the network performance is also important for network evaluation. Therefore, a complete model of network security measurement should be able to cover the four parts.
Researches on the Network Security
attack graph generation and usage in network security [5]. They introduced a classification scheme for a systematical study of the methods applied in each phase of the attack graph generation process, including the usage of attack graphs for network security.
Despite the studies have been paid much attention and have made a good achievement on security metric, there remains gaps. For a particular network, many researches only analyze qualitatively without quantitative measurement [6]. Besides some security measure methods just metric each network node quantitatively, which don’t consider the connection with the entire network [7]. For example, the attack graph only considers the attack paths and the CVSS only measures the vulnerabilities, which are not complete and comprehensive.
This paper proposes a multi-layer, multi-dimensional and multi-granularity model (3M) to measure network security. 3M model improves the existing security model based on the common multi-layer model, which combines the attack graphs and CVSS. 3M model is a complete, computable and reasonable model to evaluate network security. In this paper, two experiments are carried out to examine the validity of 3M model. The results show that 3M model is reasonable, which can find where the defects effectively.
Models of the Network Security
Qualitative measure and quantitative measure are two ways to evaluate the network security. Qualitative measure uses the non-quantitative data to assess the system, but this method is not objective [8]. Besides, the qualitative methods based on expert experience tend to focus only on the impact of security incidents, ignoring the probability of security incidents. The calculation is usually relatively simple. Thus, for small network, it is also effective.
Different from the qualitative measure, the quantitative measure establishes a mathematical model based on the various indicators of the network [9]. The result is an accurate value. The method is more complex than qualitative method, but it is suitable for the high accuracy of network. Therefore, this paper combines the quantitative and qualitative methods, which divides the network into four layers qualitatively and uses attack graphs and CVSS model to measure different layer quantitatively.
Attack Graph Model
Attack graphs depict how multiple hosts combine multiple attack ways [10]. In attack graphs, attackers tend to take advantage of multiple vulnerabilities to attack more hosts. A specific network and configuration are as the input of attack graphs. The attack graph generation system automatically generates all possible attack paths according to the start and end points [11]. However, the attack graph only describes the attack paths without analyzing the difficulty and harm of the attack quantitatively.
In this paper, MulVAL is utilized to generate attack graphs [12]. In MulVAL system, attack graphs are modeled as conditions nodes and exploits nodes. In mathematics, I define attack graph as follows:
) , , , , ,
(N N N E
G r p d
(1)
) (
)) (
(Nr Np Nd Nd Nr
E
(2)
E is a set of attack paths, stands for attack goals. ζ maps the node to the marks. Nr, Np,Nd are
nodes in the attack. Graph Np, conditions nodes is as the input of MulVAL. Nd represents the goals
in the attack graph after reasoning.
CVSS Model
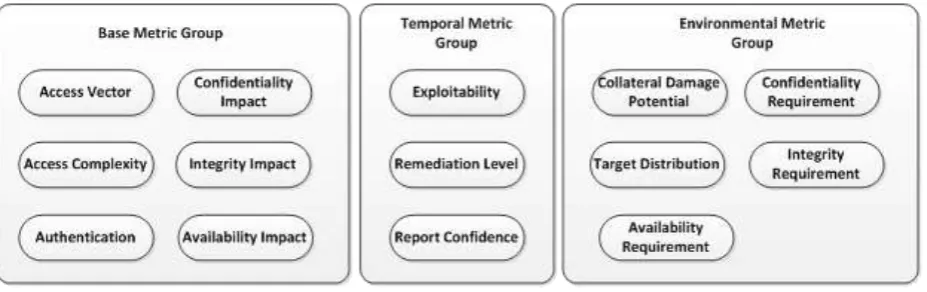
group reflects defects vary over time. The environment metric group indicates defects vary over users. In CVSS, the temporal metric group and the environment metric group are well adjusted to meet the users’ situation. In addition, the base metric group is based on the defect. The temporal metric group is measured combining the base metric group and temporary. The value of the environment metric group is the temporal metric group combined environment. This paper is not about a specific network, thus the base metric group is more concerned.
In CVSS, all values are rated form 0 to 10. The base metric group is divided into six parts: Access Vector, Access Complexity, Authentication, Confidentiality Impact, Integrity Impact and Availability Impact. Besides, each part contains several rating level. The functions of scoring are shown in following. The data of the base metric group is from CVSS and the results are shown in NVD database, which is National Vulnerability Database.
[image:3.595.68.532.443.589.2]Although CVSS is a good method to measure the network security, there are still some problems. CVSS is more concerned on a single vulnerability. In addition, CVSS doesn’t consider the combination effects of vulnerabilities. Attack graphs measure the entire network qualitatively by vulnerabilities. Besides, the attack graph utilizes all system vulnerabilities including the combination of vulnerabilities. Therefore, it is good to combine CVSS with attack graphs for measuring network security.
Figure 1. CVSS architecture.
Methodology and Implements
System Architecture Description
This paper explores a new model of 3M built on the previous theory, especially the attack graphs and CVSS. The 3M model can measure the entire network security comprehensively. This model divides the network into 4 layers. There is a clear delimitation between layer and layer. In a specific layer, two dimensions are quantified. The granularity refers some nodes which are concerned by users. This paper provides three granularities: the overall network, the sub-network and a single node. The 3M model calculates each dimension in each layer separately. To simplify, all the values are between 0 and 10. The network security can be judged by the values.
BaseScore6=round_to_1_decimal(((0.6*Impact)+(0.4*Exploitability)–1.5)*f(Impact))
Impact=10.41*(1-(1-ConfImpact)*(1-IntegImpact)*(1-AvailImpact))
To ensure that the attack paths are present clearly, all the paths of the attack graph are restored into the network topology. Figure 2 depicts the attack graph of all hosts in physical structure and provides a complete connection revealing whether the attack path has cross-domain characteristics.
Figure 2. Attack path graph.
System Architecture Diagram
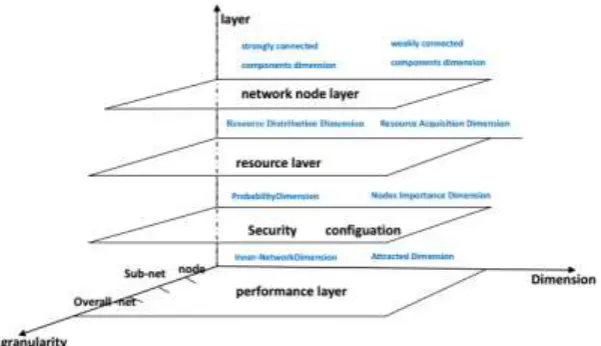
The architecture of 3M model using three-dimensional axes is shown in Figure 3. Four layers are in the architecture, and two dimensions are in every layer and 3 kinds of granularity. In total, there are 24 kinds of measure methods.
More specifically, the network is divided into network node layer with weakly connected components dimension and strongly connected components dimension, resource layer with resource distribution dimension and resource acquisition dimension, the security configuration layer with probability dimension and the node importance dimension and performance layer with inter-network dimension and attacked dimension.
The network node layer measures the network reliability and structure without considering the resources of nodes and the resource layer measures the nodes’ resource. So these two layers are combined to measure the network security from the network itself point of view. By contrary, the security configuration layer measures the vulnerabilities and defects of the network using attack graphs and CVSS model. This layer measures the network form the attacks point of view. In addition, the performance layer concerns the environments of the network. The four layers not only take the defensive side into account, but also consider the offensive side. Except for the offensive side and defensive side combination, this model also concerns the environment of the network. Therefore, this model is reasonable and complete to measure the network security.
Figure 3. System architecture.
Four Layers of the 3M Network Model
Network Node Layer
[image:4.595.148.449.501.674.2]performance. Besides, in this layer, network reliability is considered. Network reliability is one of the most demanding requirements for system security and requires a network system can perform a required function within a limit time. Therefore, the network structure is very important to measure the reliability of the network. The network structure is stronger, the reliability is better. In order to measure the network structure, the attack graph of the network is used. The attack graph of the network shows the connection and relationship between nodes. In mathematics, the nodes and edges are used to define the network structure. In an attack graph G(V,E,Sub) , in which
V v v v v
E 1 2, 1, 2 . The nodes are defined by V indicting the hosts in the network, and the
edges are defined by E indicting the attack paths in the network. Sub shows all the sub-networks, in which
sub
Sub
expressing the nodes in V belonged to the same subnet.In this layer, weakly connected components dimension and strongly connected components dimension are utilized to measure the attack graph of the network quantitatively and comprehensively. For connectivity, it is not often distinguishable for a single node or a sub-network with small size, so it is not significant to measure the granularity in this layer. Therefore, the network node layer may be weakened to measure smaller granularity.
Weakly Connected Components Dimension. All the connected zones in the attack graph are analyzed in the weakly connected components dimension. A connected zone can be a potential harmful attack in the attack graph. The weakly connected components dimension only measures the connected zone of the network. Thus, all potential harmful attacks that are in one subnet are measured in this dimension. In weakly connected components dimension, the most secure situation is that all nodes have no connection to other nodes, and the most insecure situation is that all nodes connect to others. The best way to calculate the weakly connected components dimension is to count the weakly connected components.
It is assumed that the numbers of the weakly connected components are the numbers of the nodes showing the most secure situation in the network and the weakly connected components are one showing the most insecure situation in the network. The model of the weakly connected dimension is supposed to be linear. As shown in following, the function can be deduced. v represents the number of nodes in the network, and d represents the number of the weakly connected components.
0 . 10 1 v d v
Mw (3)
To implement this function, depth first search is selected. As long as there is a path between nodes, the node is connected to the other. In specifically, firstly the attack graph is generated form the attack graph generation system, then the DFS algorithm is used to search all nodes. Based on the DFS to count the numbers of the connected zones, the final measure can be calculated finally.
As shown in function 3, this mathematical model can also be used in sub-network. However, for a single node or a small sub-network with only one node, this model is invalid. For this, if the node is invaded, the final measure is 10, otherwise the final measure is 0.
Strongly Connected Components Dimension. The strongly connected components dimension emphasizes attacks that can cross the subnet. So, if there is one attack, the attack can attack all hosts of the network, which causing the very huge damage. Contrast to weakly connected components dimension, the strongly connected components dimension is more important. But, the measure of the strongly connected components dimension is similar to the weakly connected components dimension. The mathematical function to measure the strong connected components dimension is shown in function 4.d represents the number of the strongly connected components.
the time complexity of. The key to Tarjan is that when a node's successor is assigned a lower "timestamp" or packet, the node and the subsequent node are in a strongly connected component.
Similarly, for a single node or a sub-network with only one node, this model is also invalid. The solution is the same as the weak connected components dimension.
Resource Layer
In network node layer, the resources of the nodes are ignored. So, this layer only measures the resources of the nodes in the network. Therefore, the network node layer and the resource layer can measure the network security completely. In order to measure the resource completely, there are two kinds of dimensions in this layer, the resource distribution dimension and resource acquisition dimension. Two dimensions can evaluate the whole resource layer completely. In this layer, all resources of the node are quantified simply.
On the one hand, for the resource distribution dimension, network administrator can grade hosts different qualitative resource importance, such as unimportant, medium and important. To ensure that the final measure is not influenced by the end user, it should be considered both the network user and attackers.
On the other hand, different from the resource distribution dimension, resource acquisition dimension has emphasis on the maximum amount of resources available to an attacker after the successful invasion. In this dimension, the resources of the node is taken into account regardless of the effect of an invaded node to an adjacent node is not noted. For the attacker, such as DNS server, control server and file server. The damage for these servers is huger, but the resource to attacker is more valuable. The multi-layer firewall demonstrates DMZ host [15]. Based on the different servers, this paper presents an adjustment strategy of the resource importance by overlay the coefficient. For example, for a specific attack, the attacker is most likely to get the database of a specific application. But due to the different attack target of attackers, the attack network wanted the data only is expressed by the probability.
Resource Distribution Dimension. The resource distribution dimension only takes the defense into account. This dimension based on CVSS, is a joint measure of the resource and system defects on a same host. To a host, if there are the more important resources, the system defects are more serious, causing the host in the risk of being attacked very likely. The risk of being attacked not only is in the current network configuration, but also in the changeable network configuration. The difference between the resource distribution dimension and other dimensions is that it does not use the attack graph to measure.
To implement the measure, the resources of all nodes are combined into a united vector based on the adjustment resources. At the same time, the vulnerability scores of all nodes are also merged into a vector, and the two vectors are operated by dot product operation. Finally, the result of the resource distribution dimension is obtained.
Resource Acquisition Dimension. The resource acquisition dimension only considers the offensive. The resource acquisition dimension is connected with attack graph to measure the length of the attack path that the attacker enters from the outside to the Internet. Resource acquisition dimension can be measured by the importance of each node resource divided by the difficulty of resource acquisition. Resource acquisition function is shown in function 5. Inr represents the importance of each node resource and Dra represents the difficulty of resource acquisition.
Dra Inr
Specifically, the reciprocal of the servers’ attack depth is put into a vector. It solves the attack difficulty quantification of the nodes that are not attacked in the attack graph. The node is harder to be attacked; the data in the vector is smaller. Then, the vector is unitized and plotted with the resource importance vector.
Security Configuration Layer
The network node layer measures the network structure and the resource layer measures the network resource. The vulnerabilities and defects are not included in the two layers, so this layer studies the vulnerabilities and defects in the network. The vulnerability scanning software could obtain the most of exposed vulnerabilities and defects, so it is easy to obtain the system vulnerabilities and defects of the overall network using the software. In this layer, apart from vulnerabilities and defects in the hosts, the vulnerabilities and defects between networks also considered. It is very different between the harm in the sub hosts and the harm in the key hosts. So, the probability dimension and nodes importance dimension are complete to measure security configuration layer. The probability dimension measures the vulnerabilities and defects in the hosts and the nodes importance dimension focuses on the physical connection and protocol of each node between networks.
This layer measures probability dimension and nodes importance dimension. Probability dimension measure combines attack graphs and CVSS by probability. There are many existing methods to measure the vulnerabilities and defects using attack graphs. In this paper, I highlight CVSS and do some formal changes for MulVAL attack graph. Nodes Importance dimension focuses on the configuration information of the network connection. Some network traffic nodes are analyzed through network connection, which can measure the overall network. The granularity is easily to act on the dimensions. When the granularity is smaller, the metric algorithm considers a single or a few nodes.
Probability Dimension. In MulVAL attack graph generation system, the nodes in the attack graph consists conjunctive nodes and disjunctive nodes. Exploits nodes are conjunctive nodes. To generate the attack graph using MulVAL, the names of the system vulnerability are defined conjunctive nodes and disjunctive nodes. The attacks only begin when the system had this vulnerability.
For each node, I define individual score and cumulative score. Each node exploit e and condition
c connects with two probabilities, p(c) and p(e) for the individual score, P(c) and P(e) for the cumulative score. Individual score indicates the prior knowledge of the exploit. For example, the vulnerability is easy to attack by using statistical knowledge. Cumulative Score is the rate of successful attack, representing the proportion of a group of attackers who can successfully attack with the same given condition in the same time period to reach the next security condition. Cumulative score is accumulated by individual score.
Access Vector, Access Complexity and Authentication in CVSS are related to attack ways. These factors decide the probability of successful attack using this vulnerability. Confidentiality Impact, Integrity Impact and Availability Impact are the effect to the system after attack. Therefore, cumulative score is individual by Access Vector, Access Complexity and Authentication. However, this method is limited. Therefore, this paper introduces Confidentiality Impact, Integrity Impact and Availability Impact to improve the method. These factors would be added to the evaluation system by multiplying the cumulative score.
For a network with a single node, if there is no vulnerability, the probability dimension is 0. If there are one or more vulnerabilities in the node, the probability dimension is be integrated by before results, but the upper limit is 10. When the granularity extends to a subnet, the final result would be huge. In order to solve this problem, when integrating the results, the results are multiplied by the scale factor. Therefore, the function for multi-nodes network is shown in function 6.
A
e
v P ve im pacte o A len A len p
M ( )
) (
) (
Nodes Importance Dimension. In this paper, the node importance is judged by deleting node algorithm. If connection after deleting some nodes become more unobstructed than before, the node deleted is very important. Thus, it is possible to quantify the node importance by comparing the distance between the nodes and after the deletion of the node.
The loss is divided into three parts after deleting the node: the loss of the connectivity between deleted nodes and deleted nodes, the loss of the connectivity between nodes and deleted nodes and the loss of the connectivity between nodes and nodes. To quantify this model, the mathematical model is used to describe the loss. Assuming d is the distance between two nodes. It is deduced the three function (see function 7, 8, 9). Then, accumulate the three losses into the whole loss function (see function 10). There is no need to consider the probability that the node is successfully attacked, so the impact vulnerability can be directly used without the attack node and attack probability. Therefore, add base impact, named impacte, into this model, getting the measure of the node importance as follows(see function 11).
1 ,
i j
inner i j d
v v
loss v v v d
(7)1 1
,
i j j i
between i j j d
v v v v
loss v v v v v
d d
(8)1 1
,
i j j i
outer i j d
v v v v
loss v v v v
d l
(9)v inner between outer
loss loss loss loss (10)
2 ' 2 ( ) ' v i losss lossv
M v V existVul v impact
v V
(11)For large network, the measurement of node importance is relatively low, otherwise the measurement is relatively high for small network. Therefore, it is not recommended to compare the single dimension between the different granularities.
Performance Layer
Compared to the three layers, performance layer evaluates the network security form the network’s environments points. The network’s environment includes the inner sub-networks environment and the nodes environment with the configurations. In the network environment, attacks must be considered, because the attacks affect the network very seriously.
The network scale is most closely related to network security. There are two dimensions to measure the performance of the network: inner-network dimension and attacked dimension. The inter-network dimension measures the proportion of internal attacks across subnets and subnets, and the attacked dimension measures the proportion of all nodes that may be attacked under the existing configuration. Therefore, performance layer is covered by the two dimensions completely.
Inner-Network Dimension. An entire network is divided into several independent sub-networks. The connectivity inner sub-network is better than the connectivity between sub-networks. The attack across sub-networks is more serious. Because the connectivity inner sub-network is very good, the attack can do harm to more and more hosts.
network attack path to all attack paths is used to calculate the inner-network dimension quantitatively. Function 12 shows the mathematical model.
( )
10
( )
inner i
len E M
len E
(12)
There are differences in the measurement of the dimensions for the different granularity. For Example, if there are some sub-networks in a network, the inner-network dimension describes the attack between two sub-networks. But if there are no subnets, the inner-network dimension describes the attack between two nodes. When measuring the node attack, determine whether it has attacks pointed to their own.
Attracted Dimension. This dimension measures the attacked single node in the network. The attack graph can be generated when the network configuration has been determined. It is assumed that the attack is only successful or failed, which means there is no middle state attack. So, the overall network can be divided two states, network has been attacked and network is secure. Therefore, the attacked dimension is designed the proportion of two nodes(see function 13).
( ) 10
( )
e v
len V M
len V
(13)
The attacked dimension well reveals the granularity. For larger network, the same attack causes less damage to the overall network, because there is a smaller probability for the intruded node to steal the complete sensitive information. This result is the same as the resource layer. Besides, the invaded nodes would not have a significant impact on their services. To implement the measure of the attacked dimension, DFS is used to obtain the numbers of the intruded nodes.
Experiment and Results
This paper designs two experiments to examine the 3M model. First experiment is the integrity experiment, which makes a global measure of the network. First experiment designs a simple network configuration including network topology, network attack graph and network attack path to test the 3M model architecture. The second experiment is to measure the network security quantitatively including the five networks. In the second experiment, some control variables between networks are different. We can examine the validly of 3M model based on the results of these control variables.
Integrity Experiment
Figure 4. Network topology graph. Figure 5. Attack path graph.
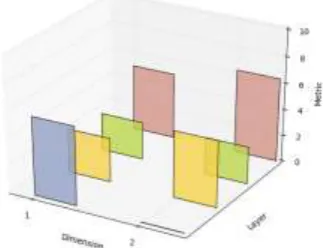
Figure 4 shows the global network consisting of fileServers subnet, workStation subnet, dmz subnet, subnet1 and two hosts. All subnets are directly connected with Internet except workStation. There is a partial vulnerability in each host of the network and the vulnerability has been inputted by Prolog. Network topology graph (see Figure 4) and network attack path graph (see Figure 5) are generated by graph_gen.sh command. Figure 6 is the result of the four layers in the global network.
Figure 6. Results of four layers. Figure 7. Configuration of network.
Quantitative Experiment
Quantitative experiment includes five network of different configuration. They have a common physical connection topology. The first network is a standard network, which contains four subnets, a history backup host and a subnet2 host, each subnet has ten hosts. The subnet is divided into dmz subnet, file server subnet, workstation subnet and custom subnet. The physical connection of the Internet and the connection between the internal network is shown in Figure 7.
In this experiment, the vulnerabilities settings of all hosts are based on the CVSS and the results of four layers are based on the math functions in this paper. Besides, the results can be compared with CVSS. Therefore, the experiment is reasonable to examine the validly of 3M model.
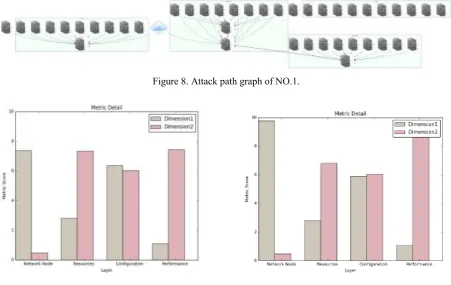
[image:10.595.106.268.435.559.2]attack path from No.9 host to NO.10 host has a strong connection. The results (see Figure 9) show that only the strongly connected components in the network node layer and the inner-network dimension is secure.
Figure 8. Attack path graph of NO.1.
[image:11.595.71.523.114.399.2]
Figure 9. Results of NO.1. Figure 10. Results of NO.2.
The second network opens the http service on No.10 host located in the subnet1, causing subnet1 is in the risk of invasion. The measurements are shown Figure 10.
Because the attack extends, the weakly connected component result increases 32.24% and the attacked nodes increases 31.18%. However, the resource distribution dimension reduces 7.95% and the inner-network dimension reduces 3.7%. subnet1 is exposed to outside network, so the total available resource become low. Similarly, the NO.10 host is exposed to the sub-network, so internal attacks increment is greater than external attacks, causing inner-network dimension smaller.
The third network is based on the second network. A new system defect configuration in the rest hosts of the subnet1 is deployed. The results are as following (see Figure 11).
Compared to the second network, the strongly connected dimension increases 202.12% and the inner- network dimension reduces. The increased attacks in the third network are all intranet attacks. The fourth network improves the structure of the first network. The resource is swapped between the subnet1 and the workStation. The results are as following (see Figure 12).
The resource distribution dimension of the first network has declined by 22.37%. Because the workStation is not directly connected with the outside network and subnet1 directly connected. The sensitive resource is placed in deeper position from the outside network.
The fifth network optimizes the more important nodes, which updates the vulnerabilities of the NO.10 host in the fileServer. The node importance of NO.10 host is the highest. After updating the vulnerabilities, there is only one defect of NPN form NVD.
Figure 11. Results of NO.3. Figure 12. Results of NO.4.
Figure 13. Attack path graph of NO.5.
Results Analysis
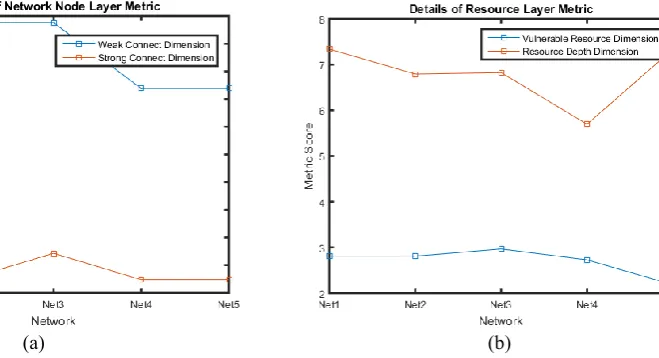
The Figure 14 shows the final results of the five networks. It is found that the second and third networks are less secure than the first network. The fourth and fifth networks after the configuration adjustment is better. For every layer in the second network is better than the first. Nodes importance dimension on the third network is less secure than the second network. The resource layer on the fourth network is better than the first. The nodes importance dimension of the third network is worse than the second network.
(c) (d)
(e)
Figure 14. (a) Results of network node layer, (b) Results of resource layer, (c) Results of security configuration layer, (d) Results of performance layer, (e) Results of overall.
If use CVSS to measure the first network and the fourth network, the results should be same. But it is not same according to 3M model, which is consistent with the real network environment. Besides, the 3M model improves the probability method. It turns to be very effective to use 3M model to measure it accurately where the node number is very large in the attack graph. Therefore, the 3M model is very reasonable to measure the network security according to the results of two experiments. Besides, the system defect or vulnerability can be found quickly and effectively in 3M model.
Conclusion
Due to the limits of the qualitative measure and the quantitative measure, there is a need to develop a new model to measure the security effectively. What could be found is 3M model, which is complete, quantitative and reasonable.
In 3M model, four layers layer can cover the entire network completely and two dimensions of each can cover the layer completely. 3M model also provides three granularities. Besides, the each dimension is calculated quantitatively, which is described by math functions. In addition, 3M model improves the probability method and combines the vulnerability and the defects. The results are more accurate and more convincing. The two experiments show that the revise is reasonable to identify the security level of the network and quickly find out security issues.
[image:13.595.77.518.72.455.2]Acknowledgement
This work was supported by National Key R&D Program of China (Grant No. 2016YFB0800700).
References
[1] Kumar S N. Review on Network Security and Cryptography[J]. International Transaction of Electrical & Computer Engineers System, 2015.
[2] Nguyen V H, Dashevskyi S, Massacci F. An automatic method for assessing the versions affected by a vulnerability[J]. Empirical Software Engineering, 2015:1-30.
[3] Kundu A, Ghosh N, Chokshi I, et al. Analysis of attack graph-based metrics for quantification of network security[C]// India Conference. IEEE, 2012:530-535.
[4] Noel S, Jajodia S. Metrics suite for network attack graph analytics[C]//Proceedings of the 9th Annual Cyber and Information Security Research Conference. ACM, 2014: 5-8.
[5] Kaynar K. A taxonomy for attack graph generation and usage in network security[J]. Journal of Information Security & Applications, 2016, 29(C):27-56.
[6] Zhang Yongzheng, Yun XiaoChun. Network Operation Security Index Classification Model with Multidimensional Attributes [J]. Chinese Journal Of Computers, 2012, 35(8): 1666-1674.
[7] Ben-Asher N, Gonzalez C. Effects of cyber security knowledge on attack detection[J]. Computers in Human Behavior, 2015, 48(C):51-61.
[8] Vadim S L. How to measure qualitative data[C]// Fuzzy Information Processing Society. IEEE, 2015:1-4.
[9] Leau Y B, Manickam S. Network Security Situation Prediction: A Review and Discussion[J]. Communications in Computer & Information Science, 2015, 516:424-435.
[10] Liu S C, Liu Y. Network security risk assessment method based on HMM and attack graph model[C]// Ieee/acis International Conference on Software Engineering, Artificial Intelligence, Networking and Parallel/distributed Computing. IEEE, 2016:517-522.
[11] Kaynar K, Sivrikaya F. Distributed Attack Graph Generation[J]. IEEE Transactions on Dependable & Secure Computing, 2016, 13(5):519-532.
[12] Prasad K, Kumar S, Negi A, et al. Generation and Risk Analysis of Network Attack Graph[M]// Proceedings of the 4th International Conference on Frontiers in Intelligent Computing: Theory and Applications (FICTA) 2015. Springer India, 2016.
[13] Keramati M, Akbari A, Keramati M. CVSS-based security metrics for quantitative analysis of attack graphs[C]// International Econference on Computer and Knowledge Engineering. IEEE, 2013:178-183.
[14] Lowe G. Concurrent depth-first search algorithms based on Tarjan’s Algorithm[J]. International Journal on Software Tools for Technology Transfer, 2016, 18(2):129-147.