R E S E A R C H A R T I C L E
Open Access
Determinants of suicidal ideation and suicide
attempts: parallel cross-sectional analyses
examining geographical location
Kerry J Inder
1,2,3*, Tonelle E Handley
3, Amy Johnston
4, Natasha Weaver
2,5, Clare Coleman
6, Terry J Lewin
1,7,
Tim Slade
4and Brian J Kelly
1Abstract
Background:Suicide death rates in Australia are higher in rural than urban communities however the contributors to this difference remain unclear. Geographical differences in suicidal ideation and attempts were explored using two datasets encompassing urban and rural community residents to examine associations between socioeconomic, demographic and mental health factors. Differing patterns of association between psychiatric disorder and suicidal ideation and attempts as geographical remoteness increased were investigated.
Methods:Parallel cross-sectional analyses were undertaken using data from the 2007 National Survey of Mental Health and Wellbeing (2007-NSMHWB, n = 8,463), under-representative of remote and very remote residents, and selected participants from the Australian Rural Mental Health Study (ARMHS, n = 634), over-representative of remote and very remote residents. Uniform measures of suicidal ideation and attempts and mental disorder using the World Mental Health Composite International Diagnostic Interview (WMH-CIDI-3.0) were used in both datasets. Geographic region was classified into major cities, inner regional and other. A series of logistic regressions were undertaken for the outcomes of 12-month and lifetime suicidal ideation and lifetime suicide attempts, adjusting for age, gender and psychological distress. A sub-analysis of the ARMHS sample was undertaken with additional variables not available in the 2007-NSMHWB dataset.
Results:Rates and determinants of suicidal ideation and suicide attempts across geographical region were similar. Psychiatric disorder was the main determinant of 12-month and lifetime suicidal ideation and lifetime suicide attempts across all geographical regions. For lifetime suicidal ideation and attempts, marital status, employment status, perceived financial adversity and mental health service use were also important determinants. In the ARMHS sub-analysis, higher optimism and better perceived infrastructure and service accessibility tended to be associated with a lower likelihood of lifetime suicidal ideation, when age, gender, psychological distress, marital status and mental health service use were taken into account.
Conclusions:Rates and determinants of suicidal ideation and attempts did not differ according to geographical location. Psychiatric disorder, current distress, employment and financial adversity remain important factors associated with suicidal ideation and attempts across all regions in Australia. Regional characteristics that influence availability of services and lower personal optimism may also be associated with suicidal ideation in rural communities.
Keywords:Rural mental health, Suicidal ideation, Suicide attempts, Psychiatric disorder, Remoteness, Social determinants of health
* Correspondence:[email protected]
1Centre for Translational Neuroscience and Mental Health, University of Newcastle, Callaghan, Newcastle, New South Wales (NSW), Australia 2Hunter Medical Research Institute, Newcastle, NSW, Australia Full list of author information is available at the end of the article
© 2014 Inder et al.; licensee BioMed Central Ltd. This is an Open Access article distributed under the terms of the Creative Commons Attribution License (http://creativecommons.org/licenses/by/4.0), which permits unrestricted use, distribution, and reproduction in any medium, provided the original work is properly credited. The Creative Commons Public Domain Dedication waiver (http://creativecommons.org/publicdomain/zero/1.0/) applies to the data made available in this article, unless otherwise stated.
Inderet al. BMC Psychiatry2014,14:208
Background
Suicide death rates have been consistently higher in rural than in urban settings across all states and territories of Australia between 2001 and 2010 [1], particularly in men [2]. Psychiatric disorder, particularly depression, is the strongest predictor of suicide death rates, [3] however the prevalence of depression is similar across urban and rural areas in Australia [4] and elsewhere [5]. Differences in urban and rural suicide rates have been linked to a number of factors other than mental health including socio-demographic factors [6], health service related factors such as access and availability of services [7,8], and access to lethal means [9].
People who experience suicidal ideation and those who make suicide plans are at increased risk of suicide attempts, and people who experience all forms of suicidal thoughts and behaviours are at greater risk of completed suicide [4]. An estimated 13.3% of community dwelling adults in Australia experience suicidal ideation during their lifetime with 3.2% attempting suicide during their life-time, highlighting an important public health problem [10]. Suicide deaths are higher in males; however suicidal ideation and behaviours occur more commonly among females, younger people, those outside the workforce, and those experiencing a mental disorder [10].
While the 2007 Australian National Survey of Mental Health and Wellbeing (NSMHWB) was under-representative of residents from remote and very remote communities [11], recent suicidality research in an exclusively rural sample obtained largely similar results [12]. In a rural population in New South Wales, Australia, suicidal ideation was predicted by younger age, being currently unmarried, not being in the workforce, and lifetime anxiety and sub-stance use disorders, after controlling for depression, the strongest predictor of suicidal ideation [12]. This indicates the importance of the presence of mental disorder among people with suicidal ideation. This also suggests that rural/urban differences in suicide may be best examined by investigating differing triggers from the presence of disorder to the development of suicidal ideation and behaviour. These triggers may involve differing social contexts (e.g., potential mediators such as social support and service availability), differing levels of severity of symptoms (e.g., through delays in presentation for treat-ment) or differing patterns of psychiatric comorbidity.
The relationship between suicidal behaviour and geo-graphical location has previously been explored [13,14], focusing on the extent of the difference between urban and rural suicide rates [15]. A major limitation of existing studies exploring the relationship between suicidal behav-iour and geographical location is that they conceptualise location as a dichotomous construct, exploring ‘urban’ versus‘rural’areas, and frequently under-represent remote and very remote residents [16]. Such an approach may
obscure differences between‘rural’communities, which may be highly heterogeneous, restricting our understanding of the potential influence of residence on mental health [17]. Exploring this issue using a broader classification of locality may enhance our ability to identify differential effects be-tween geographical locations and in particular, may reveal factors that contribute specifically to rural suicide [17].
This study draws upon two datasets with uniform mea-sures of suicidal ideation, suicide attempts and mental disorder to examine associations between demographic, socioeconomic, mental and physical health factors and suicidal ideation and suicide attempts across urban, regional, and rural/remote regions. We investigated differ-ing patterns of association between psychiatric disorder and suicidal ideation and suicide attempts as geographical remoteness increased, hypothesising that 12-month and lifetime rates of suicidal ideation and lifetime suicide attempts would be significantly higher in more remote residents.
Methods
Sampling strategies
Data were obtained from two existing complimentary studies (the 2007-NSMHWB and the Australian Rural Mental Health Study, ARMHS) to undertake parallel cross-sectional analyses to explore the determinants of suicidal ideation and suicide attempts across geographical regions. Sampling for both studies involved randomly selected participants residing in private dwellings and both studies used the same standardised and validated instrument to measure suicidal ideation and suicide attempts at a similar point in time.
The 2007-NSMHWB, conducted between August and December 2007 by the Australian Bureau of Statistics (ABS), assessed the prevalence of mental disorders in Australia using the World Mental Health Composite International Diagnostic Interview version three (WMH-CIDI-3.0) [18], administered by face-to-face interviews. Following informed consent, a total of 8,463 Australian residents aged 18 to 85 years completed the interview (response rate 60%); however, respondents were under-representative of remote and very remote residents [11].
The ARMHS is a longitudinal cohort study that aims to examine the determinants of mental health in rural and remote communities, including suicidal ideation and attempts [19]. Of the 2,638 non-metropolitan participants aged 18 years and over who gave informed consent and completed the ARMHS baseline postal survey (response rate 27%) a selected sample of 634 participants completed the WMH-CIDI-3.0 suicidality module (response rate 73%). ARMHS participants were selected for the WMH-CIDI-3.0 using stratified sampling according to psychological distress scores measured by Kessler-10 (K10) [20]: all participants with a score of 25 or greater (indicating high distress),
Inderet al. BMC Psychiatry2014,14:208 Page 2 of 20
three-quarters of those with a score from 16 to 24 (moder-ate distress) and 16.7% of participants scoring 10 to 15 (low psychological distress) were invited to participate in a telephone interview. ARMHS excluded residents of major cities. ARMHS and associated comparative analyses were approved by the Human Research Ethics Committees of the participating institutions: the University of Newcastle, University Sydney, Greater Western Area Health Service, Hunter New England Area Health Service and the North Coast Area Health Service.
Measures
The WMH-CIDI-3.0 is a standardised diagnostic inter-view used to assess psychiatric diagnoses according to the Diagnostic and Statistical Manual (DSM-IV) [21] and International Classification of Diseases (ICD-10) [22] criteria. The WMH-CIDI-3.0 has been shown to have excellent inter-rater reliability, good test-retest reliability and validity and to be an acceptable method to determine lifetime psychiatric diagnoses [23]. The WMH-CIDI-3.0 includes a screening module and a number of diagnostic modules, including depressive, anxiety and substance use disorders, among others. The suicide module asks ques-tions related to serious suicidal thoughts, suicide plans and suicide attempts, however participants screen out of the module if they answer“No”to the first question which asks ‘Have you ever seriously thought about committing suicide?’
Geographical location variables
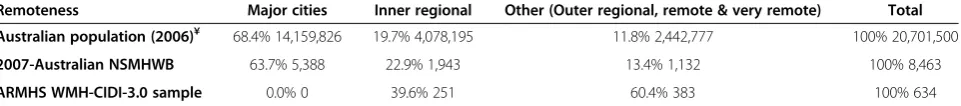
Parallel analyses of these two WMH-CIDI-3.0 datasets allowed comparison of the determinants of suicidal idea-tion and attempts across geographical regions by using the ABS Remoteness variable (RAO1CX). Household residence was categorised as: Major cities, Inner regional and Other [24]. The Other category combines Outer regional, Remote and Very remote regions from the Australian Geographical Classification System [25]. Data for the three individual components of this Other category were available for ARMHS, however not for the 2007-NSMHWB dataset; therefore, a more fine-grained analysis of remoteness was not possible. A separate ARMHS analysis was used to explore additional variables and sub-group differences, including comparisons between Inner regional, Outer Regional and Remote/very remote regions. For the targeted age range (18–85 years), the 2007-NSMHWB data on remoteness made available by the ABS included 5,388 residents in Major cities, 1,943 in Inner regional areas and 1,132 in the rest of the state (Other). This population distribution is similar to that of the 2006 Australian Census data (see Table 1), with a small over-representation of regional residents. The ARMHS sample includes a greater proportion of residents from
Outer regional, Remote and Very remote areas of New South Wales, as shown in Table 1.
Characteristics
Demographic, socioeconomic, and health related variables of interest, common to both surveys, were identified as follows:
Demographic characteristics
Age was categorised as 18–44, 45–64 and 65–85 years. Gender was categorised as male or female and marital status was categorised as currently married versus not currently married. Level of education was categorised as university or higher degree versus no university degree, and employment was categorised as employed/not employed/or not in the workforce.
Socioeconomic characteristics
Financial adversity was measured by the number of finan-cial adversity questions to which the respondent answered “Yes”, then categorised as low (0), moderate (1 or 2) or high (3 to 6) for analysis. The questions asked were:“Since January 2006 did any of the following happen to you be-cause of a shortage of money?”1) Could not pay electricity, gas or telephone bills on time; 2) Sold something; 3) Went without meals; 4) Unable to heat your home; 5) Sought financial help from friends or family; 6) Sought assistance from welfare/community organisations.
Physical health
Physical health was measured in terms of smoking status (currently smoking or not) and self-reported number of chronic diseases (heart disease, stroke, cancer or diabetes).
Mental health
Current psychological distress was measured by K10 [20], a 10-item measure of symptoms of distress during the previous four weeks, where scores range between 10 and 50 with higher scores indicating higher distress. The K10 has been shown to be sensitive to non-specific psychi-atric distress [20,26], and normative data for Australian populations have been developed [26,27]. Mental disorder was assessed using the WMH-CIDI-3.0 and variables of interest included lifetime and 12-month diagnoses of any affective disorder, any anxiety disorder, any substance use disorder and any psychiatric disorder, or two or more life-time psychiatric disorders (i.e., comorbidity). Service use for mental health problems was measured by self-reported contact with a mental health professional in the past 12 months (yes or no) and reporting that mental health services met their needs (yes or no).
Inderet al. BMC Psychiatry2014,14:208 Page 3 of 20
Outcome variables
The primary outcome variables were derived from the WHO-CIDI-3.0 Suicide module: experiencing serious suicidal thoughts in the past 12 months, reported as 12-month suicidal ideation; ever experiencing serious suicidal thoughts during your lifetime, reported as lifetime suicidal ideation; and ever attempting suicide, reported as lifetime suicide attempt. A sub-analysis was undertaken in the ARMHS sample for the outcome of lifetime suicidal ideation, incorporating the following additional variables that were not available as part of the 2007-NSMHWB:
Current functioning
A) The Well-being Index included seven scores in an aggregate measure: overall K10 score, days out of role in the past month, overall physical health, overall mental health, ability to perform everyday duties and tasks, satisfaction with relationships, and overall satisfaction with life [28], where higher scores indicate greater current well-being; B) the Alcohol Use Disorder Identification Test (AUDIT) [29], a 10 item measure of harmful or hazardous alcohol use during the previous six months, with a max-imum total score of 40, where higher scores represent higher alcohol use and/or related harmful behaviours; C) Recent adverse life events were assessed using a 12-item measure of events in the past 12 months, including marital difficulties, becoming unemployed, experiencing a court case, or major financial difficulties [30].
Social support
The Community and Personal Support variable is a com-posite measure of five scales: perceived availability of social support [31], social networks [32], sense of community [33], community participation [34], and sense of place, which assesses connection with the local environment and landscape [35]. Higher scores indicate higher levels of support [36].
Personality
Personal optimism was measured by the 12-item version of the Hunter Opinions and Personal Expectations Scale (HOPES-12) [37,38], administered to a sub-sample of baseline survey participants (n = 159). Neuroticism was assessed using the 12-item short form Eysenck Personality
Inventory measure (EPI-12) [39], from which a 7-item subset was identified (i.e., being easily hurt, a nervous person, a worrier, being highly strung, suffering from nerves, worrying too long, and often guilty) that conceptu-ally reflected pre-dispositional or trait characteristics, and may be usefully delineated from current distress items [28].
Socioeconomic factors
A) The Index of Relative Socio-Economic Advantage and Disadvantage (IRSAD) [40], a standardised score based on collation of household level census data that summarises information about the economic and social conditions of people and households within an area, including both relative advantage and disadvantage measures, where a score indicates a relative lack of disadvantage and greater advantage in general; B) Perceived prosperity was assessed using an item from the Household, Income and Labour Dynamics in Australia study asking about perceived prosperity (“Given your current needs and financial responsibilities, would you say that you and your family are: Prosperous, Very comfortable, Reasonably comfortable, Just getting along, or Poor?”) [41].
Physical health
Serious injury was assessed by asking participants to report whether or not they had experienced a serious injury in the last 12 months that required treatment from a doctor or hospital [42].
Service need and utilisation
[image:4.595.59.540.113.166.2]A) Participants’ estimated need for professional mental health services was assessed using the Predicted Service Need Index [43]. This index is a composite of seven key measures of health and wellbeing: overall mental health; overall physical health; K10; AUDIT; Patient Health Questionnaire-9 [44]; recent adverse life events; and current smoking status. Scores on the index range from 0 to 14, with higher scores indicating a higher estimated need for mental health services; B) Actual use of mental health services in the previous 12-months was also reported.
Table 1 Remoteness distribution across 2007-NSMHWB and ARMHS samples (aged 18 years and over, who completed the WMH-CIDI-3.0 suicidality module)
Remoteness Major cities Inner regional Other (Outer regional, remote & very remote) Total
Australian population (2006)¥ 68.4% 14,159,826 19.7% 4,078,195 11.8% 2,442,777 100% 20,701,500
2007-Australian NSMHWB 63.7% 5,388 22.9% 1,943 13.4% 1,132 100% 8,463
ARMHS WMH-CIDI-3.0 sample 0.0% 0 39.6% 251 60.4% 383 100% 634
NSMHWB: National Survey of Mental Health and Well-being; ARMHS: Australian Rural Mental Health Study; WMH-CIDI-3.0: World Mental Health Composite International Diagnostic Interview version 3.0; Remoteness is measured using the Australian Bureau of Statistics (ABS) Remoteness variable (RAO1CX);¥
2006 Australian Census population data, accessed fromhttp://www.abs.gov.au/AUSSTATS/[email protected]/Lookup/4102.0Chapter3002008.
Inderet al. BMC Psychiatry2014,14:208 Page 4 of 20
Rural factors
A) Living on a farm–participants were asked to report if they currently lived on a farm; B) Proportion of time spent living in a rural area was assessed through the number of years residing in the current rural district; C) Infrastructure and services accessibility was assessed using four items specifically designed to reflect common concerns in rural communities (population change; access to health care or other services; concerns regarding fuel prices, people moving in or out of the district), with each item scored on a 5-point Likert scale ranging from‘not at all’to‘a lot’; and D) Remoteness of residence was assessed using the Australian Standard Geographic Classification [25]: Major cities, Inner regional, Outer regional, Remote and Very remote. This sub-analysis combined Remote and Very remote categories.
Statistical analysis
As the ‘Other locations’ categories were not directly comparable across the two datasets, due to differences in sampling strategies, and the non-availability of additional remoteness sub-categories for the ABS 2007-NSMHWB dataset, a parallel analysis strategy was adopted. That is, data from both samples were analysed independently, using SAS software version 9.2. Our 2007-NSMHWB dataset excluded participants aged less than 18 years. Proportions of participants reporting suicidal ideation and attempts were calculated for both samples across geographical regions. Demographic, socioeconomic, phys-ical and mental health factors were initially compared between regions within samples, and across samples, for differences in proportions. Where appropriate, raw and back-weighted percentages are reported (e.g., the ARMHS interview data were back-weighted to repre-sent the ARMHS baseline sample, to counteract the stratification of participants based on K10 psychological distress scores).
A series of logistic regression analyses were then undertaken for each of the primary outcomes of 12-month suicidal ideation, lifetime suicidal ideation and lifetime suicide attempts, reported as Adjusted Odds Ratios (AORs) and associated p-values. These analyses were not repeated for suicidal attempts in the last 12 months as relatively small proportions of those with suicidal ideation also reported a suicide attempt in this time period. Of note, interview questions about attempts were only initiated if ideation was reported. Due to the ARMHS sampling methods and survey response profiles [19,28], all of the logistic analyses were adjusted for age, gender and psychological distress (K10) to minimise potential recruitment/selection biases. In practice, each predictor (or exposure) variable was included in a separate logistic regression, controlling for these three covariates; the decision to use a small, core set of covariates, versus
inclusion in the regression models of all potential pre-dictors, was based largely on the mixed nature of the predictor variables, which varied in their timeframes (e.g., lifetime factors, experiences during the past 12 months) and their levels of inherent interdependence (e.g., diagnos-tic status and health service consultations). Furthermore, the associations between the outcomes of interest and the potential predictor or exposure variables were investigated independently within each sample (2007-NSMHWB and ARMHS), including interactions with geographical location, expressed as Interaction Odds Ratios (IOR). A significant p-value for the IOR suggests that the effect of the predictor variable on the outcome of inter-est varies by location within that sample (i.e., across Major cities, Inner Regional and Other locations for the 2007-NSMHWB sample, or across Inner Regional versus Other locations for the ARMHS sample).
To reduce the likelihood of Type I errors (within each analysis series), we used Bonferroni-adjusted family-wise error rates, controlling for the number of predictor vari-ables examined; for example, setting the threshold level of significance at p < 0.003 (i.e., .05/17) for the 17 individual predictors examined within the relevant regression ana-lyses for a particular outcome and dataset.
Results
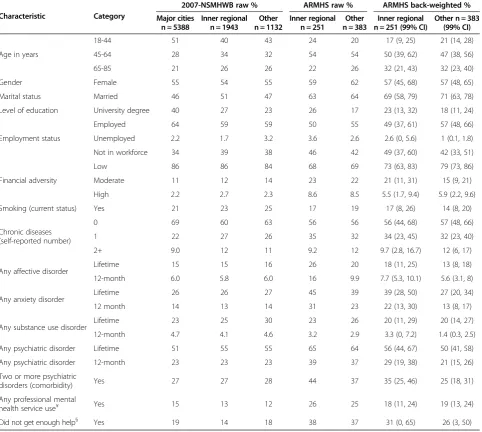
A total of 634 participants completed the suicidality module of the WMH-CIDI-3.0 within ARMHS (251 from Inner regional and 383 from Other regions) and were compared to 5,388 urban residents and 3,075 non-urban residents from the 2007-NSMHWB sample (Table 2). This comparison indicated that the ARMHS sample included a higher proportion of female participants than the 2007-NSMHWB (61% vs. 55%, p = 0.002) and a lower proportion of younger participants (e.g., 22% vs. 48% in the 18–44 year age group, p < 0.001). Raw percentages from both samples plus back-weighted ARMHS data (with 99% Confidence intervals [CIs]) are shown in Table 2; the latter can be used to identify potential differences from the corresponding aggregate characteristics for the 2007-NSMHWB dataset. Additional file 1: Table S1 details actual participant numbers (i.e., cell sizes) for each of the characteristics examined –which are the denomi-nators for the rates reported in subsequent tables.
For the comparisons within samples, there were no statistically significant differences between Inner regional and Other participants for the ARMHS sample (using back-weighted data) for any characteristic. Within the 2007-NSMHWB sample, participant characteristics were similar for those living in Inner regional compared with Other regions, however those living in Major cities were younger (e.g., 51% vs. 41% in the 18–44 year age group, p < 0.001), had higher levels of education (e.g., 40% vs. 26% with a University or higher degree, p < 0.001) and
Inderet al. BMC Psychiatry2014,14:208 Page 5 of 20
employment (64% vs. 59% employed, p < 0.001), and lower chronic disease rates (31% vs. 39%, p < 0.001) when com-pared to Inner regional and Other regions.
As shown in Table 2 and Additional file 1: Table S1, for the comparison across samples for Inner regional areas, 2007-NSMHWB participants were younger than ARMHS (back-weighted) participants (e.g., 40% vs. 17% in the 18–44 year age group, p < 0.001). ARMHS partici-pants were also more likely to be married (69% vs. 51%, p < 0.001), to have reported financial adversity (27% vs. 14%, p < 0.001), and to have met criteria for a lifetime anxiety disorder (39% vs. 26%, p < 0.001). For the compari-son across samples for Other regions, 2007-NSMHWB participants were also more likely to be younger (e.g., 43%
vs. 21% in the 18–44 year age group, p < 0.001), un-employed (3.2% vs. 1.0%, p = 0.010), smokers (25% vs. 14%, p < 0.001), and to have met criteria for lifetime substance use disorder (30% vs. 20%, p < 0.001). ARMHS participants in Other regions were more likely to be married (71% vs. 47%, p < 0.001), and to have used pro-fessional mental health services (19% vs. 12%, p < 0.001) (see Table 2 and Additional file 1: Table S1). No other differences were observed.
[image:6.595.58.541.102.534.2]There were no statistically significant differences between regions (Inner regional compared to Other regions) or be-tween samples (ARMHS compared to 2007-NSMHWB) for rates of lifetime or 12-month suicidal ideation or attempts, as shown in Table 3. Overall, 3.7% of the Table 2 Comparison of characteristics by region for 2007-NSMHWB and ARMHS samples
Characteristic Category
2007-NSMHWB raw % ARMHS raw % ARMHS back-weighted %
Major cities n = 5388
Inner regional n = 1943
Other n = 1132
Inner regional n = 251
Other n = 383
Inner regional n = 251 (99% CI)
Other n = 383 (99% CI)
Age in years
18-44 51 40 43 24 20 17 (9, 25) 21 (14, 28)
45-64 28 34 32 54 54 50 (39, 62) 47 (38, 56)
65-85 21 26 26 22 26 32 (21, 43) 32 (23, 40)
Gender Female 55 54 55 59 62 57 (45, 68) 57 (48, 65)
Marital status Married 46 51 47 63 64 69 (58, 79) 71 (63, 78)
Level of education University degree 40 27 23 26 17 23 (13, 32) 18 (11, 24)
Employment status
Employed 64 59 59 50 55 49 (37, 61) 57 (48, 66)
Unemployed 2.2 1.7 3.2 3.6 2.6 2.6 (0, 5.6) 1 (0.1, 1.8)
Not in workforce 34 39 38 46 42 49 (37, 60) 42 (33, 51)
Financial adversity
Low 86 86 84 68 69 73 (63, 83) 79 (73, 86)
Moderate 11 12 14 23 22 21 (11, 31) 15 (9, 21)
High 2.2 2.7 2.3 8.6 8.5 5.5 (1.7, 9.4) 5.9 (2.2, 9.6)
Smoking (current status) Yes 21 23 25 17 19 17 (8, 26) 14 (8, 20)
Chronic diseases (self-reported number)
0 69 60 63 56 56 56 (44, 68) 57 (48, 66)
1 22 27 26 35 32 34 (23, 45) 32 (23, 40)
2+ 9.0 12 11 9.2 12 9.7 (2.8, 16.7) 12 (6, 17)
Any affective disorder Lifetime 15 15 16 26 20 18 (11, 25) 13 (8, 18)
12-month 6.0 5.8 6.0 16 9.9 7.7 (5.3, 10.1) 5.6 (3.1, 8)
Any anxiety disorder Lifetime 26 26 27 45 39 39 (28, 50) 27 (20, 34)
12 month 14 13 14 31 23 22 (13, 30) 13 (8, 17)
Any substance use disorder Lifetime 23 25 30 23 26 20 (11, 29) 20 (14, 27)
12-month 4.7 4.1 4.6 3.2 2.9 3.3 (0, 7.2) 1.4 (0.3, 2.5)
Any psychiatric disorder Lifetime 51 55 55 65 64 56 (44, 67) 50 (41, 58)
Any psychiatric disorder 12-month 23 23 23 39 37 29 (19, 38) 21 (15, 26)
Two or more psychiatric
disorders (comorbidity) Yes 27 27 28 44 37 35 (25, 46) 25 (18, 31)
Any professional mental
health service use¥ Yes 15 13 12 26 25 18 (11, 24) 19 (13, 24)
Did not get enough help§ Yes 19 14 18 38 37 31 (0, 65) 26 (3, 50)
NSMHWB: National Survey of Mental Health and Well-being; ARMHS: Australian Rural Mental Health Study, raw percentages and back-weighted for K10 stratification; see Additional file1: Table S1 for cell sizes; CI: Confidence Intervals. ¥ Past 12 months; § Consulted a Mental Health professional in last 12 months and did not get enough help/info as needed. Assessments were based on WMH-CIDI-3.0: World Mental Health Composite International Diagnostic Interview version 3.0.
Inderet al. BMC Psychiatry2014,14:208 Page 6 of 20
2007-NSMHWB sample reported a lifetime suicide attempt compared with an estimated 5.8% of the ARMHS sample (p = 0.254). Further descriptors of suicidal behaviour across regions for the ARMHS (raw data) and the 2007-NSM HWB samples are shown in Additional file 2: Table S2.
12-month suicidal ideation
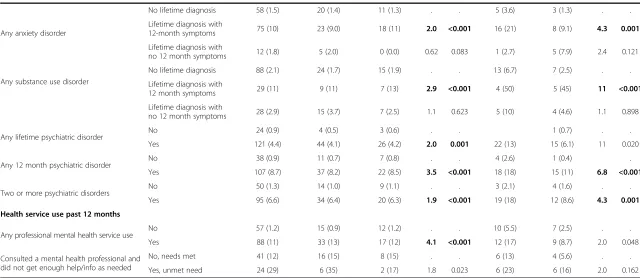
Logistic regression analyses for the outcome of 12-month suicidal ideation (adjusted for age, gender and K10 psy-chological distress) in both samples are shown in Table 4. Factors associated with 12-month suicidal ideation across the two samples, analysed independently, were broadly similar, with similar effect sizes. The common factors across samples that significantly increased the odds of experiencing 12-month suicidal ideation were mental health factors including high psychological distress (AORs of 50 and 36, p < 0.001), any 12-month affective, anxiety or substance use disorder (AORs ranging from 2.0 to 11, p < 0.001), and any 12-month psychiatric disorder or mul-tiple disorders (AORs ranging from 1.9 to 6.8, p < 0.001). In the NSMHWB sample only, the adjusted odds of 12-month suicidal ideation were lower in married persons (AOR 0.43, p < 0.001), and higher in those with moderate psychological distress (AOR 9.7, p < 0.001), moderate or high financial adversity (AORs of 1.7 and 2.9, p < 0.001), any lifetime psychiatric disorder (AOR 2.0, p = 0.001), and any mental health professional service use in the past 12 months (AOR 4.1, p < 0.001).
Lifetime suicidal ideation
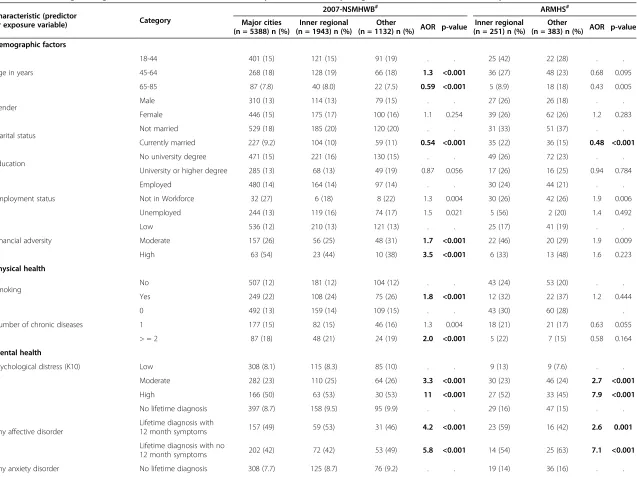
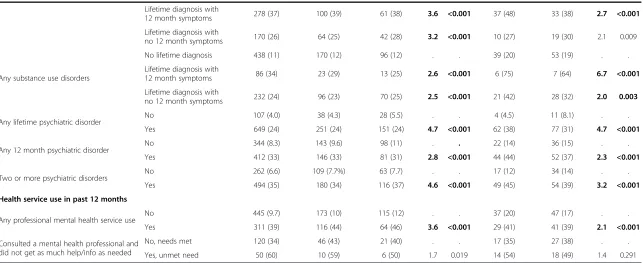
For the outcome of lifetime suicidal ideation (adjusted for age, gender and K10 psychological distress) the re-sults for both samples are shown in Table 5. The factors associated with lifetime suicidal ideation were also simi-lar across samples. Among the demographic variables there were statistically significantly lower odds of life-time suicidal ideation for those currently married (AORs ranging from 0.48 to 0.54, p < 0.001). Among the mental health factors, those reporting moderate to high psycho-logical distress (AORs ranging from 2.7 to 11, p < 0.001), those with any lifetime or 12-month affective disorder
(AORs ranging from 2.6 to 7.1, p < 0.001), or substance use disorders (AORs ranging from 2.0 to 6.7, p < 0.001), those with 12-month anxiety disorders (AORs ranging from 2.7 to 3.6, p < 0.001), any lifetime or 12-month psychi-atric disorder (AORs ranging from 2.3 to 4.7, p < 0.001), two or more psychiatric disorders (AOR 3.2 to 4.6, p < 0.001) and those using mental health services (AORs of 2.1 to 3.6, p < 0.001), increased the odds of reporting lifetime suicidal ideation for both samples.
In the NSMHWB sample only, compared with those aged 18–44 years, there were higher odds of lifetime suicidal ideation in those aged 45–64 years (AOR 1.3, p < 0.001) and lower odds in those aged 65–85 years (AOR 0.59, p < 0.001). In terms of the physical health factors, current smoking (AOR 1.8, p < 0.001) and report-ing two or more chronic diseases (AOR 2.0, p <0.001) were associated with lifetime suicidal ideation as was reporting moderate to high financial adversity (AORs 1.7 and 3.5, p < 0.001). For mental health factors, any lifetime anxiety disorder without 12 months symptoms was associ-ated with increased odds of lifetime suicidal ideation (AOR 3.2, p < 0.001).
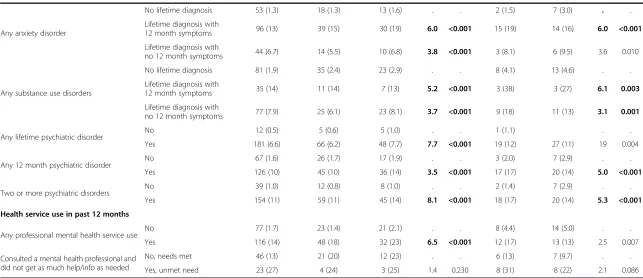
Lifetime suicide attempts
[image:7.595.58.539.112.202.2]For the outcome of lifetime suicide attempts (adjusted for age, gender and K10 psychological distress) the results for both samples are shown in Table 6. The only demo-graphic factor statistically significantly associated with lower odds of lifetime suicide attempts across both samples was being currently married (AORs ranging from 0.29 to 0.36, p < 0.001). The mental health factors statistically significantly associated with higher odds of lifetime suicide attempts across both samples were current high psycho-logical distress (AOR ranging from 4.7 to 12, p < 0.001) and those with any lifetime or 12-month affective disorder (AORs ranging from 4.0 to 6.7, p < 0.001), any anxiety dis-order with 12-month symptoms (AOR of 6.0, p < 0.001), any substance use disorder (AORs ranging from 3.1 to 5.2, p < 0.003), any 12-month psychiatric disorder (AORs ranging from 3.5 to 5, p < 0.001), and having two or more Table 3 Percentage of participants reporting lifetime and 12 month suicidal ideation and attempts in 2007-NSMHWB and ARMHS samples
Variable
2007-NSMHWB raw % ARMHS raw % ARMHS back-weighted % (99% CI)
Chi square p-value Major cities
n = 5388
Inner regional n = 1943
Other n = 1132
Inner regional n = 251
Other n = 383
Inner regional n = 251
Other n = 383
Lifetime suicidal ideation 14 15 16 26 23 19 (11.2, 27.2) 15 (9.5, 19.6) 0.254
12-month suicidal ideation 2.7 2.5 2.6 8.8 4.2 5.1 (1.7, 8.5) 1.9 (0.7, 3.2) 0.864
Lifetime suicide attempt 3.6 3.7 4.7 8.0 7.0 7.2 (1.6, 12.8) 4.8 (1.7, 7.9) 0.202
12-month suicide attempt 0.4 0.3 0.8 1.2 0.8 0.7 (0, 1.7) 0.4 (0, 1.0) 0.093
NSMHWB: National Survey of Mental Health and Well-being; ARMHS: Australian Rural Mental Health Study, raw percentages and back-weighted for K10 stratification (i.e., to adjust for selection strategy); CI: Confidence Intervals. Assessments were based on WMH-CIDI-3.0: World Mental Health Composite International Diagnostic Interview version 3.0.
Inderet al. BMC Psychiatry2014,14:208 Page 7 of 20
Table 4 Selected logistic regressions for 12-month suicidal ideation by remoteness, comparing 2007-NSMHWB and ARMHS samples
Characteristic (predictor
or exposure variable) Category
2007-NSMHWB# ARMHS#
Major cities (n = 5388) n (%)
Inner Regional (n = 1943) n (%)
Other
(n = 1132) n (%) AOR p-value
Inner Regional (n = 251)n (%)
Other
(n = 383) n (%) AOR p-value
Demographic factors
Age in years
18-44 93 (3.4) 20 (2.5) 15 (3.1) . . 9 (15) 5 (6.4) . .
45-64 41 (2.7) 19 (2.9) 10 (2.8) 0.87 0.381 11 (8.1) 8 (3.9) 0.57 0.143
65-85 11 (1.0) 9 (1.8) 4 (1.4) 0.58 0.023 2 (3.6) 3 (3.0) 0.40 0.105
Gender Male 53 (2.2) 24 (2.7) 14 (2.7) . . 10 (9.7) 6 (4.1) . .
Female 92 (3.1) 24 (2.3) 15 (2.4) 0.93 0.606 12 (8.1) 10 (4.2) 0.83 0.596
Marital status Not married 116 (4.0) 34 (3.6) 25 (4.1) . . 12 (13) 9 (6.6) . .
Currently married 29 (1.2) 14 (1.4) 4 (0.8) 0.43 <0.001 10 (6.3) 7 (2.9) 0.65 0.218
Education No university degree 92 (2.8) 38 (2.7) 18 (2.1) . . 17 (9.2) 12 (3.8) . .
University degree 53 (2.5) 10 (1.9) 11 (4.2) 1.0 0.969 5 (7.6) 4 (6.2) 1.1 0.805
Employment status
Employed 78 (2.3) 21 (1.8) 15 (2.2) . . 9 (7.2) 9 (4.3) . .
Not in Workforce 7 (5.9) 1 (3.0) 3 (8.3) 1.5 0.011 10 (8.6) 7 (4.3) 1.6 0.249
Unemployed 60 (3.3) 26 (3.4) 11 (2.6) 1.8 0.095 3 (33) 2.0 0.338
Financial adversity
Low 88 (1.9) 26 (1.6) 12 (1.3) . . 7 (4.9) 7 (3.2) .
Moderate 38 (6.2) 14 (6.3) 12 (7.7) 1.7 0.001 7 (15) 4 (5.7) 1.7 0.217
High 19 (16) 8 (15) 5 (19) 2.9 <0.001 3 (17) 3 (11) 1.3 0.601
Physical health
Smoking No 85 (2.0) 31 (2.1) 18 (2.1) . . 15 (8.5) 8 (3.1) .
Yes 60 (5.4) 17 (3.8) 11 (3.9) 1.4 0.033 3 (8.1) 7 (12) 1.1 0.794
Number of chronic diseases
0 101 (2.7) 26 (2.2) 22 (3.1) . . 13 (9.2) 10 (4.6) . .
1 27 (2.2) 14 (2.6) 3 (1.0) 0.85 0.391 6 (6.9) 5 (4.1) 1.0 0.988
> = 2 17 (3.5) 8 (3.4) 4 (3.1) 1.4 0.161 3 (13) 1 (2.2) 1.2 0.787
Mental health
Psychological distress (K10)
Low 20 (0.5) 3 (0.2) 5 (0.6) . . 1 (1.4) . .
Moderate 59 (4.8) 18 (4.1) 13 (5.2) 9.7 <0.001 7 (5.4) 8 (4.2) 8.9 0.036
High 66 (20) 26 (22) 10 (18) 50 <0.001 14 (27) 8 (11) 36 <0.001
Any affective disorder
No lifetime diagnosis 70 (1.5) 22 (1.3) 11 (1.2) . . 7 (3.8) 6 (2.0) .
Lifetime diagnosis with
12-month symptoms 63 (20) 21 (19) 14 (21) 3.9 <0.001 13 (33) 6 (16) 5.5 <0.001
Lifetime diagnosis with no
12-month symptoms 12 (2.5) 5 (2.9) 4 (3.7) 0.97 0.895 2 (7.7) 4 (10) 2.7 0.057
Inder
et
al.
BMC
Psychiatry
2014,
14
:208
Page
8
o
f
2
0
http://ww
w.biomedce
ntral.com/1
471-244X/14
Table 4 Selected logistic regressions for 12-month suicidal ideation by remoteness, comparing 2007-NSMHWB and ARMHS samples(Continued)
Any anxiety disorder
No lifetime diagnosis 58 (1.5) 20 (1.4) 11 (1.3) . . 5 (3.6) 3 (1.3) . .
Lifetime diagnosis with
12-month symptoms 75 (10) 23 (9.0) 18 (11) 2.0 <0.001 16 (21) 8 (9.1) 4.3 0.001
Lifetime diagnosis with
no 12 month symptoms 12 (1.8) 5 (2.0) 0 (0.0) 0.62 0.083 1 (2.7) 5 (7.9) 2.4 0.121
Any substance use disorder
No lifetime diagnosis 88 (2.1) 24 (1.7) 15 (1.9) . . 13 (6.7) 7 (2.5) . .
Lifetime diagnosis with
12 month symptoms 29 (11) 9 (11) 7 (13) 2.9 <0.001 4 (50) 5 (45) 11 <0.001
Lifetime diagnosis with
no 12 month symptoms 28 (2.9) 15 (3.7) 7 (2.5) 1.1 0.623 5 (10) 4 (4.6) 1.1 0.898
Any lifetime psychiatric disorder No 24 (0.9) 4 (0.5) 3 (0.6) . . 1 (0.7) . .
Yes 121 (4.4) 44 (4.1) 26 (4.2) 2.0 0.001 22 (13) 15 (6.1) 11 0.020
Any 12 month psychiatric disorder No 38 (0.9) 11 (0.7) 7 (0.8) . . 4 (2.6) 1 (0.4) .
Yes 107 (8.7) 37 (8.2) 22 (8.5) 3.5 <0.001 18 (18) 15 (11) 6.8 <0.001
Two or more psychiatric disorders No 50 (1.3) 14 (1.0) 9 (1.1) . . 3 (2.1) 4 (1.6) . .
Yes 95 (6.6) 34 (6.4) 20 (6.3) 1.9 <0.001 19 (18) 12 (8.6) 4.3 0.001
Health service use past 12 months
Any professional mental health service use No 57 (1.2) 15 (0.9) 12 (1.2) . . 10 (5.5) 7 (2.5) . .
Yes 88 (11) 33 (13) 17 (12) 4.1 <0.001 12 (17) 9 (8.7) 2.0 0.048
Consulted a mental health professional and did not get enough help/info as needed
No, needs met 41 (12) 16 (15) 8 (15) . . 6 (13) 4 (5.6) . .
Yes, unmet need 24 (29) 6 (35) 2 (17) 1.8 0.023 6 (23) 6 (16) 2.0 0.162
NSMHWB: National Survey Mental Health and Well-being (aged 18–85); ARMHS: Australian Rural Mental Health Study.
#
Bracketed values refer to the percentage of each predictor variable sub-category reporting 12-month suicidal ideation; see Additional file1: Table S1 for cell sizes.
Note: Each predictor variable was included in a separate logistic regression, controlling for age, gender, and K10 psychological distress score (as appropriate); AOR: Adjusted Odds Ratio - adjusted for the covariates; bolded p-values are statistically significant (against Bonferroni-adjusted thresholds); see Additional file3: Tables S3a and Additional file3: Table S3b for AOR Confidence Intervals and (non-significant) Predictor variable x Region interactions.
Inder
et
al.
BMC
Psychiatry
2014,
14
:208
Page
9
o
f
2
0
http://ww
w.biomedce
ntral.com/1
471-244X/14
Table 5 Selected logistic regressions for lifetime suicidal ideation by remoteness, comparing 2007-NSMHWB and ARMHS samples
Characteristic (predictor
or exposure variable) Category
2007-NSMHWB# ARMHS#
Major cities (n = 5388) n (%)
Inner regional (n = 1943) n (%)
Other
(n = 1132) n (%) AOR p-value
Inner regional (n = 251) n (%)
Other
(n = 383) n (%) AOR p-value
Demographic factors
Age in years
18-44 401 (15) 121 (15) 91 (19) . . 25 (42) 22 (28) . .
45-64 268 (18) 128 (19) 66 (18) 1.3 <0.001 36 (27) 48 (23) 0.68 0.095
65-85 87 (7.8) 40 (8.0) 22 (7.5) 0.59 <0.001 5 (8.9) 18 (18) 0.43 0.005
Gender Male 310 (13) 114 (13) 79 (15) . . 27 (26) 26 (18) . .
Female 446 (15) 175 (17) 100 (16) 1.1 0.254 39 (26) 62 (26) 1.2 0.283
Marital status Not married 529 (18) 185 (20) 120 (20) . . 31 (33) 51 (37) . .
Currently married 227 (9.2) 104 (10) 59 (11) 0.54 <0.001 35 (22) 36 (15) 0.48 <0.001
Education No university degree 471 (15) 221 (16) 130 (15) . . 49 (26) 72 (23) . .
University or higher degree 285 (13) 68 (13) 49 (19) 0.87 0.056 17 (26) 16 (25) 0.94 0.784
Employment status
Employed 480 (14) 164 (14) 97 (14) . . 30 (24) 44 (21) . .
Not in Workforce 32 (27) 6 (18) 8 (22) 1.3 0.004 30 (26) 42 (26) 1.9 0.006
Unemployed 244 (13) 119 (16) 74 (17) 1.5 0.021 5 (56) 2 (20) 1.4 0.492
Financial adversity
Low 536 (12) 210 (13) 121 (13) . . 25 (17) 41 (19) . .
Moderate 157 (26) 56 (25) 48 (31) 1.7 <0.001 22 (46) 20 (29) 1.9 0.009
High 63 (54) 23 (44) 10 (38) 3.5 <0.001 6 (33) 13 (48) 1.6 0.223
Physical health
Smoking No 507 (12) 181 (12) 104 (12) . . 43 (24) 53 (20) . .
Yes 249 (22) 108 (24) 75 (26) 1.8 <0.001 12 (32) 22 (37) 1.2 0.444
Number of chronic diseases
0 492 (13) 159 (14) 109 (15) . . 43 (30) 60 (28) .
1 177 (15) 82 (15) 46 (16) 1.3 0.004 18 (21) 21 (17) 0.63 0.055
> = 2 87 (18) 48 (21) 24 (19) 2.0 <0.001 5 (22) 7 (15) 0.58 0.164
Mental health
Psychological distress (K10) Low 308 (8.1) 115 (8.3) 85 (10) . . 9 (13) 9 (7.6) . .
Moderate 282 (23) 110 (25) 64 (26) 3.3 <0.001 30 (23) 46 (24) 2.7 <0.001
High 166 (50) 63 (53) 30 (53) 11 <0.001 27 (52) 33 (45) 7.9 <0.001
Any affective disorder
No lifetime diagnosis 397 (8.7) 158 (9.5) 95 (9.9) . . 29 (16) 47 (15) . .
Lifetime diagnosis with
12 month symptoms 157 (49) 59 (53) 31 (46) 4.2 <0.001 23 (59) 16 (42) 2.6 0.001
Lifetime diagnosis with no
12 month symptoms 202 (42) 72 (42) 53 (49) 5.8 <0.001 14 (54) 25 (63) 7.1 <0.001
Any anxiety disorder No lifetime diagnosis 308 (7.7) 125 (8.7) 76 (9.2) . . 19 (14) 36 (16) . .
Inder
et
al.
BMC
Psychiatry
2014,
14
:208
Page
10
of
20
http://ww
w.biomedce
ntral.com/1
471-244X/14
Table 5 Selected logistic regressions for lifetime suicidal ideation by remoteness, comparing 2007-NSMHWB and ARMHS samples(Continued)
Lifetime diagnosis with
12 month symptoms 278 (37) 100 (39) 61 (38) 3.6 <0.001 37 (48) 33 (38) 2.7 <0.001
Lifetime diagnosis with
no 12 month symptoms 170 (26) 64 (25) 42 (28) 3.2 <0.001 10 (27) 19 (30) 2.1 0.009
Any substance use disorders
No lifetime diagnosis 438 (11) 170 (12) 96 (12) . . 39 (20) 53 (19) . .
Lifetime diagnosis with
12 month symptoms 86 (34) 23 (29) 13 (25) 2.6 <0.001 6 (75) 7 (64) 6.7 <0.001
Lifetime diagnosis with
no 12 month symptoms 232 (24) 96 (23) 70 (25) 2.5 <0.001 21 (42) 28 (32) 2.0 0.003
Any lifetime psychiatric disorder No 107 (4.0) 38 (4.3) 28 (5.5) . . 4 (4.5) 11 (8.1) . .
Yes 649 (24) 251 (24) 151 (24) 4.7 <0.001 62 (38) 77 (31) 4.7 <0.001
Any 12 month psychiatric disorder No 344 (8.3) 143 (9.6) 98 (11) . . 22 (14) 36 (15) . .
Yes 412 (33) 146 (33) 81 (31) 2.8 <0.001 44 (44) 52 (37) 2.3 <0.001
Two or more psychiatric disorders No 262 (6.6) 109 (7.7%) 63 (7.7) . . 17 (12) 34 (14) . .
Yes 494 (35) 180 (34) 116 (37) 4.6 <0.001 49 (45) 54 (39) 3.2 <0.001
Health service use in past 12 months
Any professional mental health service use No 445 (9.7) 173 (10) 115 (12) . . 37 (20) 47 (17) . .
Yes 311 (39) 116 (44) 64 (46) 3.6 <0.001 29 (41) 41 (39) 2.1 <0.001
Consulted a mental health professional and did not get as much help/info as needed
No, needs met 120 (34) 46 (43) 21 (40) . . 17 (35) 27 (38) . .
Yes, unmet need 50 (60) 10 (59) 6 (50) 1.7 0.019 14 (54) 18 (49) 1.4 0.291
NSMHWB: National Survey Mental Health and Well-being (aged 18–85); ARMHS: Australian Rural Mental Health Study.
#
Bracketed values refer to the percentage of each predictor (or exposure) variable sub-category reporting lifetime suicidal ideation; see Additional file1: Table S1 for cell sizes.
Note: Each predictor variable was included in a separate logistic regression, controlling for age, gender, and K10 psychological distress score (as appropriate); AOR: Adjusted Odds Ratio - adjusted for the covariates; bolded p-values are statistically significant (against Bonferroni-adjusted thresholds); see Additional file4: Table S4a and Additional file4: Table S4b for AOR Confidence Intervals and (non-significant) Predictor variable x Region interactions.
Inder
et
al.
BMC
Psychiatry
2014,
14
:208
Page
11
of
20
http://ww
w.biomedce
ntral.com/1
471-244X/14
Table 6 Selected logistic regressions for lifetime suicide attempts by remoteness comparing 2007-NSMHWB and ARMHS samples
Characteristic (predictor
or exposure variable) Category
2007-NSMHWB# ARMHS#
Major cities (n = 5388) n (%)
Inner regional (n = 1943) n (%)
Other
(n = 1132) n (%) AOR p-value
Inner regional (n = 251) n (%)
Other
(n = 383) n (%) AOR p-value
Demographic factors
Age in years
18-44 118 (4.3) 33 (4.2) 25 (5.2) . . 9 (15) 9 (12) . .
45-64 63 (4.1) 28 (4.2) 23 (6.4) 1.1 0.560 10 (7.4) 15 (7.3) 0.58 0.103
65-85 12 (1.1) 10 (2.0) 5 (1.7) 0.42 <0.001 1 (1.8) 3 (3.0) 0.21 0.007
Gender Male 65 (2.7) 24 (2.7) 17 (3.3) . . 10 (9.7) 7 (4.8) . .
Female 128 (4.3) 47 (4.5) 36 (5.8) 1.4 0.003 10 (6.8) 20 (8.5) 1.1 0.759
Marital status Not married 154 (5.3) 56 (5.9) 40 (6.6) . . 13 (14) 19 (14) . .
Currently married 39 (1.6) 15 (1.5) 13 (2.5) 0.36 <0.001 7 (4.4) 8 (3.3) 0.29 <0.001
Education No university degree 129 (4.0) 54 (3.8) 44 (5.0) . . 15 (8.1) 21 (6.6) . .
University or higher degree 64 (3.0) 17 (3.2) 9 (3.5) 0.69 0.004 5 (7.6) 6 (9.2) 1.0 0.956
Employment status
Employed 119 (3.4) 31 (2.7) 26 (3.9) . . 5 (4.0) 13 (6.3) . .
Not in Workforce 61 (3.4) 37 (4.9) 25 (5.9) 1.5 0.004 11 (9.5) 13 (8.1) 3.0 0.002
Unemployed 13 (11) 3 (9.1) 2 (5.6) 2.3 0.002 4 (44) 1 (10) 5.0 0.009
Financial adversity
Low 116 (2.5) 44 (2.6) 30 (3.2) . . 5 (3.5) 10 (4.5) . .
Moderate 49 (8.0) 16 (7.1) 18 (12) 1.9 <0.001 8 (17) 8 (11) 3.0 0.005
High 28 (24) 11 (21) 5 (19) 4.3 <0.001 4 (22) 5 (19) 2.9 0.036
Physical health
Smoking No 104 (2.4) 37 (2.5) 22 (2.6) . . 11 (6.3) 13 (5.0) . .
Yes 89 (8.0) 34 (7.7) 31 (11) 2.7 <0.001 7 (19) 9 (15) 2.1 0.051
Number of chronic diseases
0 127 (3.4) 46 (3.9) 34 (4.8) . . 14 (9.9) 19 (8.8) . .
1 48 (4.0) 17 (3.2) 12 (4.1) 1.3 0.294 4 (4.6) 5 (4.1) 0.60 0.218
> = 2 18 (3.7) 8 (3.4) 7 (5.5) 1.3 0.160 2 (8.7) 3 (6.5) 1.5 0.502
Mental health
Psychological distress (K10) Low 62 (1.6) 23 (1.7) 16 (1.9) . . 4 (5.7) 3 (2.5) . .
Moderate 71 (5.8) 28 (6.3) 24 (9.6) 3.7 <0.001 6 (4.7) 12 (6.3) 1.3 0.527
High 60 (18) 20 (17) 13 (23) 12 <0.001 10 (19) 12 (16) 4.7 <0.001
Any affective disorder
No lifetime diagnosis 72 (1.6) 27 (1.6) 23 (2.4) . . 6 (3.2) 11 (3.6) . .
Lifetime diagnosis with
12 month symptoms 56 (17) 20 (18) 14 (21) 5.1 <0.001 11 (28) 10 (26) 6.7 <0.001
Lifetime diagnosis with
no 12 month symptoms 65 (13) 24 (14) 16 (15) 6.4 <0.001 3 (12) 6 (15) 4.0 0.002
Inder
et
al.
BMC
Psychiatry
2014,
14
:208
Page
12
of
20
http://ww
w.biomedce
ntral.com/1
471-244X/14
Table 6 Selected logistic regressions for lifetime suicide attempts by remoteness comparing 2007-NSMHWB and ARMHS samples(Continued)
Any anxiety disorder
No lifetime diagnosis 53 (1.3) 18 (1.3) 13 (1.6) . . 2 (1.5) 7 (3.0) . .
Lifetime diagnosis with
12 month symptoms 96 (13) 39 (15) 30 (19) 6.0 <0.001 15 (19) 14 (16) 6.0 <0.001
Lifetime diagnosis with
no 12 month symptoms 44 (6.7) 14 (5.5) 10 (6.8) 3.8 <0.001 3 (8.1) 6 (9.5) 3.6 0.010
Any substance use disorders
No lifetime diagnosis 81 (1.9) 35 (2.4) 23 (2.9) . . 8 (4.1) 13 (4.6) . .
Lifetime diagnosis with
12 month symptoms 35 (14) 11 (14) 7 (13) 5.2 <0.001 3 (38) 3 (27) 6.1 0.003
Lifetime diagnosis with
no 12 month symptoms 77 (7.9) 25 (6.1) 23 (8.1) 3.7 <0.001 9 (18) 11 (13) 3.1 0.001
Any lifetime psychiatric disorder No 12 (0.5) 5 (0.6) 5 (1.0) . . 1 (1.1) . .
Yes 181 (6.6) 66 (6.2) 48 (7.7) 7.7 <0.001 19 (12) 27 (11) 19 0.004
Any 12 month psychiatric disorder No 67 (1.6) 26 (1.7) 17 (1.9) . . 3 (2.0) 7 (2.9) . .
Yes 126 (10) 45 (10) 36 (14) 3.5 <0.001 17 (17) 20 (14) 5.0 <0.001
Two or more psychiatric disorders No 39 (1.0) 12 (0.8) 8 (1.0) . . 2 (1.4) 7 (2.9) . .
Yes 154 (11) 59 (11) 45 (14) 8.1 <0.001 18 (17) 20 (14) 5.3 <0.001
Health service use in past 12 months
Any professional mental health service use No 77 (1.7) 23 (1.4) 21 (2.1) . . 8 (4.4) 14 (5.0) . .
Yes 116 (14) 48 (18) 32 (23) 6.5 <0.001 12 (17) 13 (13) 2.5 0.007
Consulted a mental health professional and did not get as much help/info as needed
No, needs met 46 (13) 21 (20) 12 (23) . . 6 (13) 7 (9.7) . .
Yes, unmet need 23 (27) 4 (24) 3 (25) 1.4 0.230 8 (31) 8 (22) 2.1 0.086
NSMHWB: National Survey Mental Health and Well-being (aged 18–85); ARMHS: Australian Rural Mental Health Study.
#
Bracketed values refer to the percentage of each predictor (or exposure) variable sub-category reporting lifetime suicide attempt; see Additional file1: Table S1 for cell sizes.
Note: Each predictor variable was included in a separate logistic regression, controlling for age, gender, and K10 psychological distress score (as appropriate); AOR: Adjusted Odds Ratio - adjusted for the covariates; bolded p-values are statistically significant (against Bonferroni-adjusted thresholds); see Additional file5: Table S5a and Additional file5: Table S5b for AOR Confidence Intervals and (non-significant) Predictor variable x Region interactions.
Inder
et
al.
BMC
Psychiatry
2014,
14
:208
Page
13
of
20
http://ww
w.biomedce
ntral.com/1
471-244X/14
lifetime psychiatric disorders (AORs ranging from 5.3 to 8.1, p < 0.001).
In the NSMHWB sample only, older age reduced the odds of a lifetime suicide attempt (AOR 0.42, p < 0.001) and being unemployed (AOR 2.3, p = 0.002) or experien-cing moderate or high financial adversity (AORs 1.9 to 4.3, p < 0.001) increased the odds of a lifetime suicide attempt. In terms of mental health factors in the NSMHWB, experi-encing current moderate psychological distress, having any lifetime anxiety disorder without 12-month symptoms, and any lifetime psychiatric disorder increased the odds of a lifetime suicide attempt (AORs of 3.7, 3.8 and 7.7, p < 0.001 respectively). Reporting any professional mental health ser-vice use in the past 12 months also statistically significantly increased the odds of a lifetime suicide attempt (AOR 6.5, p < 0.007) in the NSMHWB sample.
Suicidal ideation across geographical regions
There were no statistically significant interaction effects for geographical location with any predictor variable tested for the outcomes of 12-month or lifetime suicidal ideation or lifetime suicide attempt (IORs and 99% CIs are shown in Additional file 3: Table S3a, Additional file 4: Table S4a and Additional file 5: Table S5a for the 2007-NSMHWB sample, and S3b, S4b and S5b for the ARMHS sample); that is, the observed associations between the predictor variables and the outcomes of interest reported above did not vary by geographical location (within samples).
Additional comparisons and regression analyses within the ARMHS sample
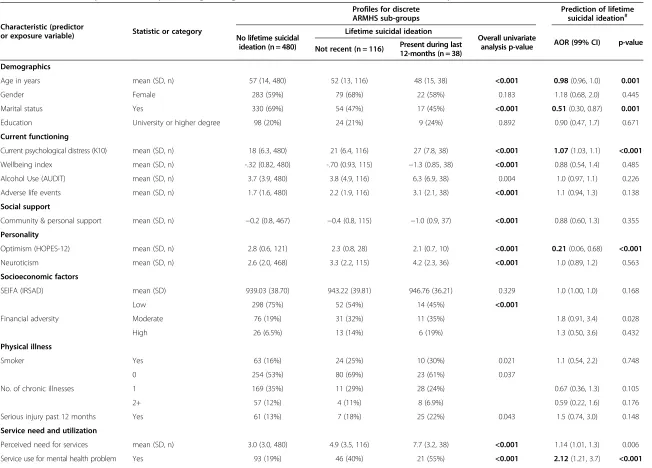
As there were additional variables collected in the ARMHS sub-sample, which were not available in the national dataset, we undertook some further analyses. Firstly, we classified the 634 ARMHS participants into three discrete groups: no lifetime suicidal ideation (76%); lifetime idea-tion, but not recently (18%); and ideation during the last 12-months (5.9%) in order to assess the influence of the additional ARMHS variables reporting current functioning and social support. The left-hand columns of Table 7 present simple (univariate) profiles for these groups; overall statistical tests are reported (chi-square tests for the categorical variables and one-way ANOVAs for the continuous measures). In short, those with lifetime sui-cidal ideation tended to be: younger, not married, with higher psychological distress, lower wellbeing, more recent adverse events, lower community and personal support, lower optimism, higher neuroticism, greater financial adversity, greater perceived need for services, and greater service use for mental health. The reporting of a lifetime psychiatric disorder (any affective disorder, any anxiety disorder and any substance use disorder) was also significantly associated with lifetime suicidal ideation at the univariate level.
The right-hand columns of Table 7 report similar logis-tic regression models to those presented earlier, but in this instance, each analysis was adjusted for the key factors that were significant in the parallel analyses (see Table 5): age, gender, psychological distress, marital status and professional mental health service use. Consequently, from the ARMHS sub-analysis we identified two poten-tial additional predictors of lifetime suicidal ideation: lower optimism (HOPES-12; AOR 0.21, p < 0.001) and a (Bonferroni-adjusted non-significant) trend for lower infra-structure and service accessibility (AOR 0.91, p = 0.007). All lifetime psychiatric disorders also remained significant (p < 0.001) in these analyses (affective disorder AOR 3.7; anxiety disorder AOR 2.2; and substance use disorder AOR 2.3).
Discussion
As suicide death rates have been consistently higher in rural than in urban settings, differences in rates of suicidal ideation or attempts and determinants of suicidal ideation and attempts across the geographical spectrum from urban to rural regions were explored. Any modifiable differences found could have a major impact on the development of interventions to prevent suicidal behav-iour. Using the 2007-NSMHWB and ARMHS data in parallel analyses, we found no difference in the rates or the key determinants of suicidal ideation or attempts, across geographical region.
The main “determinants” of 12-month and lifetime suicidal ideation and lifetime suicide attempts across geographical regions were current psychological distress and psychiatric disorder. This is consistent with findings in previous studies of the general population [45,46]. In our analyses, psychiatric disorder was associated with over a four-fold increase in the odds of reporting lifetime suicidal ideation in both datasets (see Table 5), with life-time affective disorder making the largest contribution (AORs from 2.6 to 7.1). For lifetime suicide attempts the major contributors were reporting a lifetime affective disorder (with or without 12 month symptoms) or a life-time anxiety disorder with 12 month symptoms (see Table 6). Geographical location was not significantly associ-ated with suicidal ideation or attempts (see Table 3) and there were no associated interaction effects in the logistic regressions (see Additional file 3: Table S3, Additional file 4: Table S4 and Additional file 5: Table S5).
The consistently strong associations between current psychological distress and each of the outcomes (see Tables 4, 5, 6 and 7) may also partially reflect the influ-ence of long-run symptomatology, as well as the ongoing disabling consequences that often accompany psychiatric conditions, such as employment disruption and/or asso-ciated financial adversity. It should be noted that within our analysis framework, current psychological distress was
Inderet al. BMC Psychiatry2014,14:208 Page 14 of 20
Table 7 Additional comparisons and expanded logistic regressions for lifetime suicidal ideation in ARMHS sample (n = 634)
Characteristic (predictor
or exposure variable) Statistic or category
Profiles for discrete ARMHS sub-groups
Prediction of lifetime suicidal ideation#
No lifetime suicidal ideation (n = 480)
Lifetime suicidal ideation
Overall univariate
analysis p-value AOR (99% CI) p-value Not recent (n = 116) Present during last
12-months (n = 38)
Demographics
Age in years mean (SD, n) 57 (14, 480) 52 (13, 116) 48 (15, 38) <0.001 0.98(0.96, 1.0) 0.001
Gender Female 283 (59%) 79 (68%) 22 (58%) 0.183 1.18 (0.68, 2.0) 0.445
Marital status Yes 330 (69%) 54 (47%) 17 (45%) <0.001 0.51(0.30, 0.87) 0.001
Education University or higher degree 98 (20%) 24 (21%) 9 (24%) 0.892 0.90 (0.47, 1.7) 0.671
Current functioning
Current psychological distress (K10) mean (SD, n) 18 (6.3, 480) 21 (6.4, 116) 27 (7.8, 38) <0.001 1.07(1.03, 1.1) <0.001
Wellbeing index mean (SD, n) -.32 (0.82, 480) -.70 (0.93, 115) −1.3 (0.85, 38) <0.001 0.88 (0.54, 1.4) 0.485
Alcohol Use (AUDIT) mean (SD, n) 3.7 (3.9, 480) 3.8 (4.9, 116) 6.3 (6.9, 38) 0.004 1.0 (0.97, 1.1) 0.226
Adverse life events mean (SD, n) 1.7 (1.6, 480) 2.2 (1.9, 116) 3.1 (2.1, 38) <0.001 1.1 (0.94, 1.3) 0.138
Social support
Community & personal support mean (SD, n) −0.2 (0.8, 467) −0.4 (0.8, 115) −1.0 (0.9, 37) <0.001 0.88 (0.60, 1.3) 0.355
Personality
Optimism (HOPES-12) mean (SD, n) 2.8 (0.6, 121) 2.3 (0.8, 28) 2.1 (0.7, 10) <0.001 0.21(0.06, 0.68) <0.001
Neuroticism mean (SD, n) 2.6 (2.0, 468) 3.3 (2.2, 115) 4.2 (2.3, 36) <0.001 1.0 (0.89, 1.2) 0.563
Socioeconomic factors
SEIFA (IRSAD) mean (SD) 939.03 (38.70) 943.22 (39.81) 946.76 (36.21) 0.329 1.0 (1.00, 1.0) 0.168
Financial adversity
Low 298 (75%) 52 (54%) 14 (45%) <0.001
Moderate 76 (19%) 31 (32%) 11 (35%) 1.8 (0.91, 3.4) 0.028
High 26 (6.5%) 13 (14%) 6 (19%) 1.3 (0.50, 3.6) 0.432
Physical illness
Smoker Yes 63 (16%) 24 (25%) 10 (30%) 0.021 1.1 (0.54, 2.2) 0.748
No. of chronic illnesses
0 254 (53%) 80 (69%) 23 (61%) 0.037
1 169 (35%) 11 (29%) 28 (24%) 0.67 (0.36, 1.3) 0.105
2+ 57 (12%) 4 (11%) 8 (6.9%) 0.59 (0.22, 1.6) 0.176
Serious injury past 12 months Yes 61 (13%) 7 (18%) 25 (22%) 0.043 1.5 (0.74, 3.0) 0.148
Service need and utilization
Perceived need for services mean (SD, n) 3.0 (3.0, 480) 4.9 (3.5, 116) 7.7 (3.2, 38) <0.001 1.14 (1.01, 1.3) 0.006
Service use for mental health problem Yes 93 (19%) 46 (40%) 21 (55%) <0.001 2.12(1.21, 3.7) <0.001
Inder
et
al.
BMC
Psychiatry
2014,
14
:208
Page
15
of
20
http://ww
w.biomedce
ntral.com/1
471-244X/14
Table 7 Additional comparisons and expanded logistic regressions for lifetime suicidal ideation in ARMHS sample (n = 634)(Continued)
Rural factors
Live on farm Yes 116 (25%) 23 (20%) 8 (21%) 0.576 0.89 (0.47, 1.7) 0.639
Proportion of life in a rural area mean (SD, n) 0.70 (0.31, 475) 0.67 (0.30, 113) 0.73 (0.31, 38) 0.573 0.84 (0.36, 1.9) 0.601
Remoteness category
Inner regional 185 (39%) 44 (38%) 22 (58%) 0.029 .
Outer regional 175 (36%) 53 (46%) 10 (26%) 1.09 (0.61, 1.9) 0.698
Remote/ Very Remote 120 (25%) 19 (16%) 6 (16%) 0.63 (0.30, 1.3) 0.11
Infrastructure and services accessibility mean (SD, n) 4.00 (3.15, 480) 3.30 (2.55, 116) 3.03 (2.31, 38) 0.021 0.91 (0.82, 1.0) 0.007
Lifetime psychiatric morbidity
Affective disorder Yes 65 (14%) 53 (46%) 30 (79%) <0.001 3.7(2.0, 6.7) <0.001
Anxiety disorder Yes 166 (35%) 69 (59%) 30 (79%) <0.001 2.2(1.3, 3.8) <0.001
Substance use disorder Yes 94 (20%) 44 (38%) 18 (47%) <0.001 2.3(1.3, 4.1) <0.001
ARMHS: Australian Rural Mental Health Study; SD: Standard deviation; K10: Kessler-10 measure of psychological distress; AUDIT: Alcohol Use Disorder Identification Test; HOPES-12: Hunter Opinions and Personal Expectations Scale; SEIFA (IRSAD) Index of Relative Socio-Economic Advantage and Disadvantage; ASGC: Australian Standard Geographic Classification; AOR: Adjusted Odds Ratio.
#
See the right-hand columns of Table5for the percentages of each predictor variable sub-category reporting lifetime suicidal ideation; the predictors were included in separate logistic regressions, controlling for age, gender, K10 psychological distress score, marital status and professional mental health service use (as appropriate); bolded p-values are statistically significant (against Bonferroni-adjusted thresholds).
Inder
et
al.
BMC
Psychiatry
2014,
14
:208
Page
16
of
20
http://ww
w.biomedce
ntral.com/1
471-244X/14
examined in relative isolation, whereas the contributions of psychiatric disorder, employment status, financial adversity and the other predictors were assessed with current psychological distress and the other key covariates statistically controlled.
The findings regarding psychiatric disorder and suicidal ideation and attempts strongly support the view that strategies to target prevention and early detection of psychiatric disorder are particularly relevant to suicide prevention [47]. The significant association between 12-month suicidal ideation and 12-month disorder rates could also be accounted for by overlap in symptom criteria for major depressive disorder, but not anxiety disorders. The link with 12-month anxiety disorder could be accounted for by comorbid depressive disorder in those with anxiety disorder. Previous analysis from this sample has indicated a significant independent effect of anxiety-related conditions, specifically post-traumatic stress dis-order, on suicidal ideation and behaviours [48]. In addition, depression and suicide have been shown to be related but independent constructs [48,49].
To better understand the rural–urban disparities in suicide requires research that goes beyond analysis of disorder rates alone and can explore the distribution of personal, social and community level factors that may have a bearing on the trajectory and impact of mental illness, and its personal and social impact [50,51]. Import-ant characteristics of non-urban areas that may impact health outcomes not well represented in existing geo-graphic categories of ‘rurality’ or ‘remoteness’ [16,17,52] include district level socio-economic disadvantage and other characteristics of the populations themselves. Some examples include: indigeneity; higher proportions of the population working in occupations with attendant health risks (such as primary industries); lower access to specific health services; greater vulnerability to adverse environ-mental events, and greater vulnerability to adverse social and economic impacts when those events occur; vulner-ability to population shifts; and geographic isolation.
In our analyses, social factors including employment, financial adversity and marital status were significantly associated with suicidal ideation and attempt and war-rant further investigation. There is a large body of work linking unemployment with poorer mental health, in-cluding an earlier report from ARMHS indicating high levels of distress among rural unemployed [53]. Previous research has identified significant associations between financial hardship and incident major depression in an Australian sample [54]. It should also be noted that the presence in the current study of, for example, a modest but non-differential association (across regions) between financial hardship and lifetime suicidal ideation, tends to suggest that sub-regions with pervasive financial hard-ship (regardless of geographical location) will tend to
experience higher rates of suicidality. However, the impact of personal financial hardship may be moderated by per-sonal characteristics such as optimism and by resources of the district in which people reside, hence the importance of rural community characteristics. Previous analyses have indicated the significant role of social networks and community connection in mental health outcomes [55], consistent with a large body of work suggesting the moderating effects of social networks and support [56].
Other Australian research has also detected a significant association between loss of rural infrastructure, popula-tions and resources, and population distress levels [57], and this is reflected in our findings regarding concern about rural infrastructure and services, and suicidal idea-tion. This may reflect the perceptions and experiences among those with high levels of distress and greater need for assistance, who become more conscious of the limita-tions of surrounding community resources.
The contexts across rural, regional and major cities are very different and it is feasible that psychological distress, suicidal ideation and mental disorder, in general, do not differ by geographical location; however death by suicide does [1]. One of the most effective methods of suicide prevention is restriction of access to lethal means [47]. The context in rural areas is very conducive to access to effective means of suicide, especially with access to and familiarity with firearms [17]. There is also access to isolation; hence it is easier not to be found in rural areas until it is too late, following potentially less lethal means such as hanging or overdose. There are also issues around help-seeking behaviours and rural culture [58,59].
To better account for the differences in suicide rates between rural and metropolitan regions, above and be-yond what we already know, further research is needed. Perhaps efforts would be better placed in evaluating tar-geted intervention programs for those at highest risk of death by suicide in rural areas including farmers and Indi-genous peoples [60] and in developing evidenced based suicide prevention strategies.
Strengths and limitations
Major strengths of this analysis are the use of a Composite International Diagnostic Interview in both samples to measure the outcomes and potential determinants at a similar point in time, the large sample size and the inclu-sion of a substantial proportion of participants from outer regional, remote and very remote regions. However, there are several limitations of this approach. Firstly, these two datasets provided coarse comparisons across regions, and were limited by the small number of common variables that assessed known determinants of suicidal ideation at a more fine-grained level (e.g., personality factors, social support, or valid measures of personal socio-economic factors). Both data sources provided cross-sectional data
Inderet al. BMC Psychiatry2014,14:208 Page 17 of 20