This is the pre-peer reviewed version of the following article: Kubiak K.J., Bigerelle M., Mathia T.G., Dubois A., Dubar L., Dynamic evolution of interface roughness during friction and wear processes. Scanning Vol 36 (2014) p.30-38, which has been published in final form at http://onlinelibrary.wiley.com...
Dynamic evolution of interface roughness during friction and wear processes
K.J. Kubiak
1,2*, M. Bigerelle
2,3, T.G. Mathia
4, A. Dubois
2,3, L. Dubar
2,31
University of Leeds, School of Mechanical Engineering, Institute of Engineering Thermofluids, Surfaces and Interfaces (iETSI), Woodhouse Lane, Leeds LS2 9JT, United Kingdom,
2Université de Valenciennes et du Hainaut-Cambrésis, Laboratoire TEMPO, EA4542, Campus Mont Houy 59313
Valenciennes Cedex 9, France, 3
PRES Lille Nord de France,
4Ecole Centrale de Lyon, Laboratoire de Tribologie et Dynamique des Systèmes (LTDS), CNRS UMR 5513, 36 Avenue Guy de
Collongue, 69134 Ecully, France.
*Corresponding author: [email protected]
Abstract
Dynamic evolution of surface roughness and influence of initial roughness (Sa=0.282 to 6.73 µm) during friction and wear
processes has been analyzed experimentally. The mirror polished and rough surfaces (28 samples in total) have been prepared by surface polishing on Ti-6Al-4V and AISI 1045 samples. Friction and wear have been tested in classical sphere/plane configuration using linear reciprocating tribometer with very small displacement from 130 to 200 microns. After an initial period of rapid degradation, dynamic evolution of surface roughness converges to certain level specific to a given tribosystem. However, roughness at such dynamic interface is still increasing and analysis of initial roughness influence revealed that to certain extent, a rheology effect of interface can be observed and dynamic evolution of roughness will depend on initial condition and history of interface roughness evolution. Multiscale analysis shows that morphology created in wear process is composed from nano, micro and macro scale roughness. Therefore, mechanical parts working under very severe contact conditions, like rotor/blade contact, screws, clutch etc. with poor initial surface finishing are susceptible to have much shorter lifetime than a quality finished parts.
Keywords: dynamic surface roughness, dry friction, roughness metrology, surface finishing.
Nomenclature:
F (Hz) - frequency of sinusoidal displacement, P (N) - normal load in contact,
Q (N) - tangential load in contact, δ (µ m) - relative displacement in contact, N - number of cycles in fretting test, Sq (µ m) - Root mean square height,
Ssk - Skewness,
Sku - Kurtosis,
Sp (µ m) - Maximum peak height,
Sv (µ m) - Maximum pit height,
Sz (µ m) - Maximum height,
Sa (µ m) - Arithmetic mean height,
Smc (µ m) - Inverse areal material ratio,
Sxp (µ m) - Extreme peak height,
Spd (1/mm²) - Density of peaks,
Spc (1/mm) - Arithmetic mean peak curvature,
S10z (µ m) - Ten point height,
S5p (µ m) - Five point peak height,
S5v (µ m) - Five point pit height.
1 Introduction
Initial surface roughness can have significant influence on friction and wear processes in tribological contacts under fretting conditions [1, 2, 3]. Damage induced by fretting is considered as a plague for modern industry and can be found in many engineering applications [4] for example in transport industry, electrical contacts, bridge cable lines, rotor/blade contact of jet engine, but also in dental implants and brackets [5], hip and knee prosthesis. Degradation of such contact is a dynamic process and
conditions at interface are constantly changing [6]. Wear process, abrasion in contact and creation of third body will influence dynamic evolution of interface roughness. For very severe contact conditions [7] often encountered in fretting, initial surface will be totally removed and newly created surface will usually be very complex due to physical and chemical processes taking place at interface. Therefore, multiscale analysis approach should be used to evaluate interface morphology. Along with statistical parameters, used to evaluate roughness height and spatial characteristic, many researchers started to use multiscale decomposition method [8, 9, 10]. Fourier transform, wavelet transformation and fractal methods are more often used [11, 12, 13, 14]. Taking into account multiscale roughness of interface and dynamic nature of friction and wear processes, it is important to analyze the interface roughness evolution during sliding and wear [15]. From a practical point of view, initial roughness in manufacturing process is much easier to control. It is frequently used to obtain specific functionalities of final parts and components. Therefore, in this paper, we will focus on initial roughness and its influence on friction and wear process dynamics.
2 Experimental procedure
2.1 Tested materials
This is the pre-peer reviewed version of the following article: Kubiak K.J., Bigerelle M., Mathia T.G., Dubois A., Dubar L., Dynamic evolution of interface alloy (Ti-6Al-4V). Two relatively hard materials were
selected as counterbodies to simplify analysis and avoid high wear rate: AISI 52100 ball bearing steel and Al2O3
ceramic ball. For analysis of initial roughness influence
and dynamic evolution of interface roughness the plane specimens AISI 1045 were tested against AISI 52100 ball and a plane Ti-6Al-4V specimens against ceramic ball.
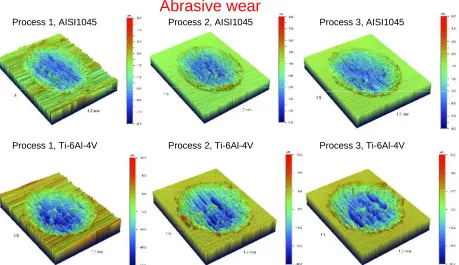
Process 1, AISI1045 Process 2, AISI1045 Process 3, AISI1045
Process 1, Ti-6Al-4V Process 2, Ti-6Al-4V Process 3, Ti-6Al-4V
[image:2.595.72.531.107.372.2]Abrasive wear
Figure 1: 3D morphologies with different initial surface roughness (Process 1, 2 and 3) prepared by abrasive polishing on a low carbon alloy AISI 1045 and titanium alloy Ti-6Al-4V. Test conditions: P=10 N, δ*=200 µm, F=15 Hz, N=5000 cycles, contact configuration plane/sphere AISI 1045/AISI 52100 and Ti-6Al-4V/Al2O3 respectively.
2.2 Rough surface preparation
The experimental specimens were machined into small rectangular blocks and they were polished to obtain an uniform roughness on their working surface. Subsequently different grit size were involved to produce surfaces with Sa roughness ranging from 0.035 to 6.73 µm. Tests
performed to analyze dynamic evolution of surface roughness were carried out directly on the ‘almost mirror’ polished surfaces with Sa=0.035 µm. However, influence
of initial surface roughness was also investigated using specimens with different initial roughness ranging form Sa=0.282 to 6.73 µm.
Commercially available spheres from ball bearing were used as counterbodies, they are characterized by smooth surface of about Sa=0.2 µ m and no additional treatment
were used in this case.
Preparation of the surface by abrasive polishing can generate initial compressive residual stress near to the surface. However, high local contact stress during fretting will lead to relaxation of initial residual stress after few cycles in gross slip regime [16] when whole contact area is subjected to relative sliding. Therefore, in this study carried out in gross slip regime, the initial residual stress will not be taken into account.
2.3 Surface Roughness measurements
This is the pre-peer reviewed version of the following article: Kubiak K.J., Bigerelle M., Mathia T.G., Dubois A., Dubar L., Dynamic evolution of interface roughness during friction and wear processes. Scanning Vol 36 (2014) p.30-38, which has been published in final form at http://onlinelibrary.wiley.com... fretting wear and presence of third body in the contact
causing very deep scratches in centre of wear trace. More abrasive character can be observed for titanium alloy.
2.4 Experimental setup for friction and wear tests
The experimental analysis of initial surface roughness influence on friction, wear and dynamic evolution of interface morphology were carried out using linear micro-displacement tribometer [17]. Reciprocating micro-displacement motion with a frequency F of 15 Hz is generated by electrodynamic shaker. Test is controlled by imposing constant displacement. Figure 2 shows schematic diagram of used tribometer and interface contact configuration. During the tests, normal load in the contact was applied by fixed mass and was kept constant at P=10 N and 20 N. Tangential force (Q) and relative displacement (δ) were recorded continuously, using that signals, various tribological parameters can be calculated and displacement amplitude is used in feedback loop to keep displacement amplitude constant during the test (18, 19).
Plane specimen Sphere D=25.4 mm
Normal load P=10 N
displacement amplitude
δ*=50-200 µm
Displacement sensor
Tangential force sensor
Full Slip Fretting Loop
Q
δ
a)
b)
c)
Energy dissipated in interface Ed δ∗
Q*
Figure 2: Fretting test: (a) contact configuration, (b) fretting loop and (c) fretting wear scar (Ti-6Al-4V) (after Kubiak et al. 2011 [17]).
3 Results and discussion
Friction and wear are complex phenomena involving physical and chemical interactions of interface and also mechanical deformations of near surface material. During dry contact friction, even for the conditions involving only elastic contact deformation in macroscopic scale, due to roughness of real surface, contact between two solids take place first on asperities peaks. Stress distribution in local contact spots can however exceed the elastic limit and materials on a smaller scale will be deformed plastically. Therefore, by controlling surface morphology one can control how the contact between solids will take place.
3.1 Dynamic evolution of roughness during wear
process
Dynamic evolution of surface morphology has been evaluated by analysis of surface profiles after tests with different number of cycles. Initially mirror polished surface of Ti-6Al-4V has been tested in sphere/plane configuration for 2000, 5000, 7500 and 10000 cycles. Profiles of worn plane surface in direction perpendicular to sliding direction are plotted in Figure 3. Spherical shape of wear scars has been removed from profile and only roughness is plotted and analyzed. Already after the first 2000 cycles, a significant surface degradation and increase in roughness can be observed. Summary of roughness parameters evolution can be found in Table 1. Slight increase in roughness can be observed between 2000 and 5000 cycles, but no further degradation was observed for this configuration. Note that tests were performed on mirror polished surface and therefore influence of initial roughness is very limited in this case and each test will have similar rheological history. Evolution of wear on sphere counterbodies have similar tendency to evolution on plane surface. Observed wear has abrasive character and after initial period of intensive degradation, an equilibrium state between material removal from peaks and valleys of asperities is reached. Roughness of interface will in this case slightly increase but it is already at very high level.
Length = 1.43 mm Pt = 18.4 µm Scale = 30.0 µm
0 0.2 0.4 0.6 0.8 1 1.2 1.4 mm µm
-10 0 10
Length = 1.41 mm Pt = 20.2 µm Scale = 30.0 µm
0 0.2 0.4 0.6 0.8 1 1.2 1.4 mm µm
-10 0 10
Length = 1.51 mm Pt = 23.0 µm Scale = 30.0 µm
0 0.2 0.4 0.6 0.8 1 1.2 1.4 mm µm
-10 0 10
Length = 1.40 mm Pt = 20.4 µm Scale = 30.0 µm
0 0.2 0.4 0.6 0.8 1 1.2 1.4 mm µm
-10 0 10
Length = 1.94 mm Pt = 0.196 µm Scale = 3.00 µm
0 0.2 0.4 0.6 0.8 1 1.2 1.4 1.6 1.8 mm µm
-1 0 1
N=2000 cycles
N=5000 cycles
N=7500 cycles
[image:3.595.51.270.301.517.2]N=10 000 cycles N=0 cycles, Initial surface
[image:3.595.321.548.381.761.2]This is the pre-peer reviewed version of the following article: Kubiak K.J., Bigerelle M., Mathia T.G., Dubois A., Dubar L., Dynamic evolution of interface direction perpendicular to contact sliding direction (plane
[image:4.595.314.555.56.350.2]material Ti-6Al-4V, P=20 N, δ*=130 µm, F=15 Hz).
Table 1: Dynamic evolution of surface morphology during wear process, measured at different number of cycles in a wear trace on surface with removed spherical form and filtered with Gaussian filter 0.08mm (plane material Ti-6Al-4V, P = 20 N, δ*=130 µm , F=15 Hz).
Cycles Initial 2000 5000 7000 10000
Height Parameters
Sq (µ m) 0.045 2.09 1.82 1.5 1.56
Ssk 0.229 -0.249 -0.214 -0.228 -0.802
Sku 3.23 3.77 5.05 3.27 5.16
Sp (µ m) 0.197 15.3 19.9 12.4 12.9
Sv (µ m) 0.272 15.3 23.1 16.5 17.2
Sz (µ m) 0.47 30.6 43 28.9 30.2
Sa (µ m) 0.035 1.61 1.43 1.22 1.23
Functional Parameters
Smc (µ m) 0.058 2.66 2.17 1.97 1.87
Sxp (µ m) 0.083 4.72 4.05 3.04 3.52
Feature Parameters
Spd (1/mm²) 277 184 94.7 137 113
Spc (1/mm) 7.81 319 547 324 422
S10z (µ m) 0.32 23.5 31.4 18.7 25
S5p (µ m) 0.12 10.3 16.1 9.14 9.51
S5v (µ m) 0.20 13.2 15.3 9.56 15.5
3.2 Influence of initial surface roughness on dynamic
evolution of interface
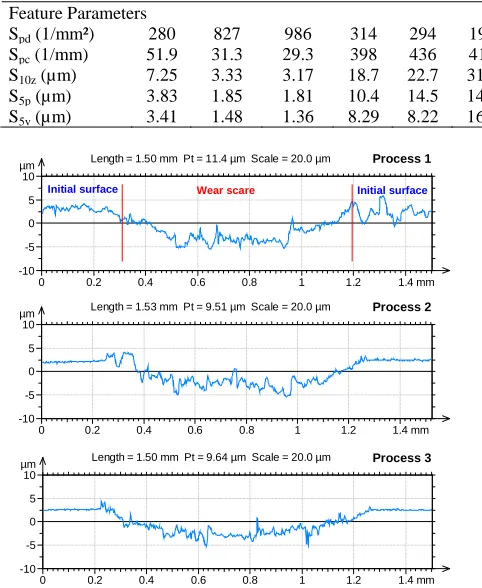
Influence of initial roughness on dynamic evolution of interface morphology was analyzed on specimens prepared on AISI 1045 and Ti-6Al-4V material with different initial roughness. In this case, tests were carried out against AISI 52100 sphere. Profiles of the middle cross section of wear scars on Ti-6Al-4V measured in direction perpendicular to sliding direction are presented in Figure 4. Three surfaces with different initial roughness can be directly compared after the test with identical tribological conditions. Summary of roughness parameters measured inside the fretting scars is presented in Table 2 and Table 3 for Ti-6Al-4V and AISI 1045 material respectively. It can be noted that there are differences in the surface roughness inside the fretting traces after the test. They are related to initial surface roughness. This confirms that the rheological evolution and history of the contact degradation have an influence on friction and wear processes. However, influence of the material and microstructure should be further investigated.
Table 2: Roughness parameters measured on initial surface and inside of wear scars, spherical form of wear scar have been removed and Gaussian filter 0.08 were used, material Ti-6Al-4V, P=10 N, δ*=200 µm, N=5000 cycles, F=15 Hz.
Initial surface Wear trace
Process# 1 2 3 1 2 3
Height Parameters
Sq (µm) 1.43 0.441 0.365 1.88 2.41 2.92
Sp (µm) 6.48 2.2 2.06 14.4 16.4 15.4
Sv (µm) 6.73 1.61 1.71 10.7 11.2 19.6
Sz (µm) 13.2 3.81 3.77 25.1 27.5 35.1
Sa (µm) 1.11 0.339 0.282 1.43 1.89 2.14
Functional Parameters
Smc (µm) 1.79 0.554 0.459 2.3 2.76 3.13
Sxp (µm) 3.13 0.82 0.667 3.85 5.55 7.97
Feature Parameters
Spd (1/mm²) 280 827 986 314 294 194
Spc (1/mm) 51.9 31.3 29.3 398 436 412
S10z (µm) 7.25 3.33 3.17 18.7 22.7 31.1
S5p (µm) 3.83 1.85 1.81 10.4 14.5 14.4
S5v (µm) 3.41 1.48 1.36 8.29 8.22 16.7
Length = 1.50 mm Pt = 9.64 µm Scale = 20.0 µm
0 0.2 0.4 0.6 0.8 1 1.2 1.4 mm µm
-10 -5 0 5 10
Length = 1.53 mm Pt = 9.51 µm Scale = 20.0 µm
0 0.2 0.4 0.6 0.8 1 1.2 1.4 mm µm
-10 -5 0 5 10
Length = 1.50 mm Pt = 11.4 µm Scale = 20.0 µm
0 0.2 0.4 0.6 0.8 1 1.2 1.4 mm µm
-10 -5 0 5 10
Process 1
Process 2
Process 3
Wear scare
Initial surface Initial surface
[image:4.595.42.286.147.359.2]Figure 4: 2D profiles of fretting wear scar, middle plane perpendicular to sliding direction at maximum wear depth, material Ti-6Al-4V, for displacement amplitude 200 µm.
Table 3: Roughness parameters measured on initial surface and inside of wear scars, spherical form of wear scar have been removed and Gaussian filter 0.08 were used, material AISI 1045, P=10 N, δ*=200 µm, N=5000 cycles, F=15 Hz.
Initial surface Wear trace
Process# 1 2 3 1 2 3
Height Parameters
Sq (µm) 2.88 0.52 0.377 0.974 1.02 0.792
Sp (µm) 11.7 2.5 2.07 9.19 6.19 3.51
Sv (µm) 15.7 2.46 1.46 6.09 5.23 4.19
Sz (µm) 27.4 4.97 3.53 15.3 11.4 7.7
Sa (µm) 2.16 0.409 0.282 0.712 0.756 0.593
Functional Parameters
Smc (µm) 3.24 0.662 0.466 1.11 1.24 0.93
Sxp (µm) 7 0.982 0.689 1.84 2.02 1.68
Feature Parameters
Spd (1/mm²) 107 800 741 492 437 749
Spc (1/mm) 78.1 35 27.7 337 136 118
S10z (µm) 11.4 3.82 3.17 11.9 8.8 5.62
S5p (µm) 4.72 1.95 1.88 7.52 4.67 2.56
S5v (µm) 6.72 1.87 1.29 4.4 4.13 3.05
3.3 Multiscale Power spectral density analysis
[image:4.595.315.568.446.630.2]This is the pre-peer reviewed version of the following article: Kubiak K.J., Bigerelle M., Mathia T.G., Dubois A., Dubar L., Dynamic evolution of interface roughness during friction and wear processes. Scanning Vol 36 (2014) p.30-38, which has been published in final form at http://onlinelibrary.wiley.com... Multilevel analysis is revealing important changes in
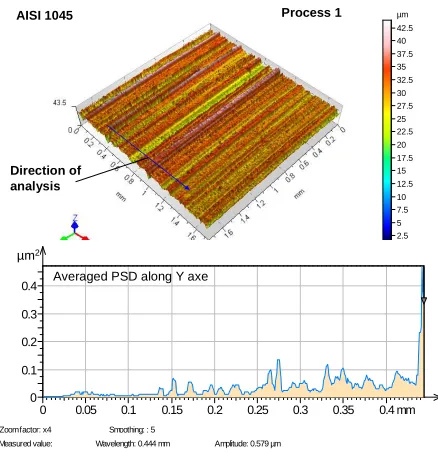
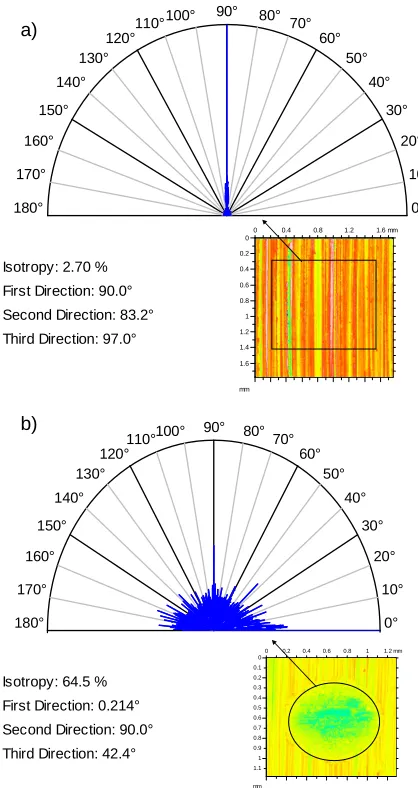
distribution of Power Spectral Density function on initial roughness and morphology created during wear process. Initial surface morphology prepared by abrasive polishing is composed from frequencies corresponding to the wavelength i.e. peaks on PSD graph in Figure 5. These kind of dominant frequencies are likely to indicate surface anisotropy, which in this case is very high and only 2.7 % of isotropy, has been calculated on initial surface (Figure 8a). Isotropy in tribological contact is increasing during the fretting test and after 5000 cycles is about 64 % (Figure 8b). The results obtained for initial surface morphology are rather intuitive and they are similar for other surfaces prepared by polishing and other unidirectional processes like milling or turning, where rather single motif corresponding to the tool feed step, will be dominant in PSD distribution.
Sliding direction is perpendicular to initial surface roughness texture and as it can be observed in Figure 5 and Figure 6 due to wear process initial surface is totally removed and new rough surface is created. However, this is a very dynamic process and final roughness of interface will depend on the history of contact and roughness evolution during the friction process.
µm
0 2.5 5 7.5 10 12.5 15 17.5 20 22.5 25 27.5 30 32.5 35 37.5 40 42.5
AISI 1045 Process 1
0 0.05 0.1 0.15 0.2 0.25 0.3 0.35 0.4 mm
µm2
0 0.1 0.2 0.3 0.4
Zoom factor: x4 Smoothing: : 5
Measured value: Wavelength: 0.444 mm Amplitude: 0.579 µm Averaged PSD along Y axe
µm2
Direction of analysis
Figure 5: Surface morphology and Averaged Power Spectral Density function of AISI 1045 (Process 1) surface before a test.
Multiscale analysis of surface morphology inside the fretting scar shows increasing and regularly distributed Power Spectral Density function with tendency to reduce the maximum wavelength in spectrum (Figure 6). This means that morphology created in wear process is composed from nano, micro and macro scale roughness. Therefore, abrasive wear process take place at all scale levels. Analyzing obtained PSD for worn surfaces, one can expect to find self-similarity at different levels. Figure 7 confirms that hypothesis, showing similar roughness profiles of surface created by abrasive wear process at different scale levels.
µm
0 2.5 5 7.5 10 12.5 15 17.5 20 22.5 25 27.5 30 32.5
Process 1 AISI 1045, δ*=150 µm
0 0.02 0.04 0.06 0.08 0.1 0.12 0.14 0.16 0.18 mm µm²
0 0.1 0.2 0.3 0.4 0.5
Zoom factor: x4 Smoothing: : 5
Measured value: Wavelength: 0.181 mm Amplitude: 0.410 µm Averaged PSD along Y axe (inside the wear scar) µm2
Figure 6: Power spectral density analysis of AISI 1045 (Process 1) surface after the test with P=10 N, δ*=150 µ m, F=15 Hz, N=5000 cycles.
Length = 1.41 mm P t = 92.5 µm S cale = 200 µm
0 0.2 0.4 0.6 0.8 1 1.2 1.4 mm
µm
-75 -50 -25 0 25 50 75 100
Length = 264 µm Pt = 14.0 µm S cale = 20.0 µm
0 25 50 75 100 125 150 175 200 225 250 µm
µm
-7.5 -5 -2.5 0 2.5 5 7.5 10
a)
b)
Figure 7: Example of self similarity of roughness profiles of worn metallic surface observed at different magnification. Profiles a) and b) present the same surface at different scale, AISI 1045, P=10 N, δ*=150 µm, F=15 Hz, N=5000 cycles.
[image:5.595.321.543.54.280.2] [image:5.595.327.538.339.546.2] [image:5.595.50.269.342.568.2]This is the pre-peer reviewed version of the following article: Kubiak K.J., Bigerelle M., Mathia T.G., Dubois A., Dubar L., Dynamic evolution of interface 0°
10° 20° 30° 40° 50° 60° 70° 80° 90° 100° 110° 120° 130°
140°
150°
160°
170°
180°
Isotropy: 2.70 %
First Direction: 90.0°
Second Direction: 83.2°
Third Direction: 97.0°
0 0.4 0.8 1.2 1.6 mm
mm 0
0.2 0.4
0.6
0.8
1 1.2
1.4
1.6
a)
0° 10° 20° 30° 40° 50° 60° 70° 80° 90° 100° 110° 120° 130°
140°
150°
160°
170°
180°
Isotropy: 64.5 %
First Direction: 0.214°
Second Direction: 90.0°
Third Direction: 42.4°
0 0.2 0.4 0.6 0.8 1 1.2 mm
mm 0 0.1 0.2 0.3 0.4 0.5 0.6 0.7 0.8 0.9 1 1.1
b)
Figure 8: Analysis of texture direction of a) initial and b) worn interface roughness and its variation during fretting test with AISI 1045, P=10 N, δ*=150 µm, F=15 Hz, N=5000 cycles.
4 Conclusions
Dynamic evolution of surface roughness during friction and wear processes has been analyzed using first series of mirror polished Ti-6Al-4V samples and second series of samples with different initial roughness (Sa=0.282 to
6.73 µm) prepared on Ti-6Al-4V and AISI 1045 samples. Analysis of dynamic evolution of roughness during friction process shows that the degradation of material in abrasive wear process rapidly changes the roughness in tribological contact. After an initial period of rapid degradation, condition of the interface will stabilize and roughness increase is much slower. However, analysis of initial roughness influence revealed that to certain extent a memory effect of interface exist and dynamic evolution of roughness will depend on initial condition and rheology of interface roughness evolution. Therefore, mechanical parts exposed to friction with poor initial finishing are susceptible to have much shorter lifetime than quality finished parts. This especially can concern the parts working under very severe contact conditions like rotor/blade contact, screws, clutch etc…
Multiscale analysis shows that new surface created during abrasive wear process is rather uniform at different scales. That confirms that morphology created in wear process is composed from nano, micro and macro scale roughness. Depending on specific application, initial surface morphology can be used to manage the friction and wear processes in more controllable way.
5 Acknowledges
K.J. Kubiak would like to thank all staff members of Laboratory TEMPO at the University of Valenciennes in France for inviting him to the laboratory, for financial support of this work and for very fruitful collaboration.
6 References
[1] Stahlmann J, Nicodemus E.R, Sharma S.C, Groche P., Surface roughness evolution in FEA simulations of bulk metal forming process, Wear, 2012, 288 : 78 - 87.
[2] Kubiak, K. & Mathia, T. Influence of roughness on contact interface in fretting under dry and boundary lubricated sliding regimes Wear, 2009, 267 : 315 - 321.
[3] Sokoloff, J. B. Surface roughness and dry friction Physical Review E, 2012, 85 : 027102.
[4] Fu, Y. Q.; Loh, N. L.; Batchelor, A. W.; Liu, D. X.; Zhu, X. D.; He, J. W. & Xu, K. W. Improvement in fretting wear and fatigue resistance of Ti-6Al-4V by application of several surface treatments and coatings Surface & Coatings Technology, 1998, 106 : 193-197.
[5] Rapiejko, C.; Fouvry, S.; Grosgogeat, B. Wendler, B, A representative ex-situ fretting wear investigation of orthodontic arch-wire/bracket contacts, Wear, 2009, 266 : 850 - 858.
[6] Jerier, J. F. Molinari, J. F. Normal contact between rough surfaces by the Discrete Element Method Tribology International, 2012, 47 : 1-8.
[7] Kasarekar, A. T.; Sadeghi, F. & Tseregounis, S. Fretting fatigue of rough surfaces Wear, 2008, 264 : 719-730.
[8] Bigerelle, M.; Van Gorp, A.; Gautier, A. & Revel, P. Multiscale morphology of high-precision turning process surfaces Proceedings of the Institution of Mechanical Engineers Part B-journal of Engineering Manufacture, 2007, 221 : 1485-1497. [9] Bouchbinder, E, Procaccia, I; Santucci, S, Vanel, L, Fracture surfaces as multiscaling graphs, Physical Review Letters, 2006, 96 : 055509.
[10] Bigerelle, M.; Mathia, T. & Bouvier, S. The multi-scale roughness analyses and modeling of abrasion with the grit size effect on ground surfaces Wear, 2012, 286, 124-135.
[image:6.595.58.267.65.459.2]This is the pre-peer reviewed version of the following article: Kubiak K.J., Bigerelle M., Mathia T.G., Dubois A., Dubar L., Dynamic evolution of interface roughness during friction and wear processes. Scanning Vol 36 (2014) p.30-38, which has been published in final form at http://onlinelibrary.wiley.com...
[12] Scott R.S, Ungar P.S, Bergstrom T.S, Brown C.A, Grine F.E, Teaford M.F, Walker A, Dental microwear texture analysis within-species diet variability in fossil hominins, Nature 2005, 436/4 : 693-695.
[13] Kang, M. C.; Kim, J. S. & Kim, K. H. Fractal dimension analysis of machined surface depending on coated tool wear Surface & Coatings Technology, 2005, 193.
[14] Ungar P.S, Brown C.A, Bergstrom T.S, Walker A, Quantification of dental microwear by tandem scanning confocal microscopy and scale-sensitive fractal analyses, Scanning 2003, 25 : 185-193. [15] Elliott, D.; Fisher, J. & Clark, D. Effect of counterface
surface roughness and its evolution on the wear and friction of PEEK and PEEK-bonded carbon fibre composites on stainless steel Wear, 1998, 217 : 288 – 296.
[16] Kubiak, K.; Mathia, T. & Fouvry, S. Interface roughness effect on friction map under fretting contact conditions Tribology International, 2010, 43 : 1500 - 1507.
[17] Kubiak K.J., Liskiewicz T.W., Mathia T.G., Surface morphology in engineering applications: Influence of roughness on sliding and wear in dry fretting, (2011) Tribology International 44 : 1427-1432.
[18] Kubiak, K.; Fouvry, S. & Marechal, A. A practical methodology to select fretting palliatives: Application to shot peening, hard chromium and WC-Co coatings Wear, 2005, 259 : 367 - 376. [19] Kubiak, K.; Fouvry, S.; Marechal, A. & Vernet, J.